Ultimate Guide to TEM Sample Prep for Nanoparticles: Protocols for Drug Delivery & Biomedical Research
This comprehensive guide details the critical steps and considerations for preparing nanoparticle samples for Transmission Electron Microscopy (TEM) analysis.
Ultimate Guide to TEM Sample Prep for Nanoparticles: Protocols for Drug Delivery & Biomedical Research
Abstract
This comprehensive guide details the critical steps and considerations for preparing nanoparticle samples for Transmission Electron Microscopy (TEM) analysis. Tailored for researchers, scientists, and drug development professionals, it covers foundational principles of why preparation matters, step-by-step methodologies for common nanoparticle types (including lipid and polymeric nanoparticles), troubleshooting for artifacts and aggregation, and validation techniques to ensure data reliability. The article empowers users to obtain high-resolution, interpretable TEM data essential for characterizing size, morphology, and structure in biomedical applications.
Why TEM Sample Prep is the Make-or-Break Step in Nanoparticle Analysis
The efficacy, biodistribution, toxicity, and overall performance of nanomedicines—including lipid nanoparticles (LNPs), polymeric nanoparticles, inorganic nanoparticles, and viral vectors—are intrinsically governed by their physicochemical properties. Among these, size, morphology (shape), and internal/external structure are paramount. Transmission Electron Microscopy (TEM) is the premier analytical technique for directly visualizing these attributes at the nanoscale. Within the broader thesis on TEM sample preparation for nanoparticle characterization, this document details specialized protocols and application notes for accurate and artifact-free TEM analysis of nanomedicines.
Application Notes: Quantitative Insights from TEM Data
Table 1: Impact of Nanoparticle Physicochemical Properties on Biological Behavior
| Property | Typical TEM-Measured Range (Nanomedicine) | Key Biological/Functional Implication |
|---|---|---|
| Size (Hydrodynamic vs. Core) | LNP: 60-120 nm (core); Polymeric: 50-200 nm | Opsonization, renal clearance (cutoff ~10 nm), cellular uptake efficiency. |
| Size Uniformity (PDI from TEM) | PDI < 0.2 is desirable (by DLS) | Batch-to-batch reproducibility, predictable pharmacokinetics. |
| Morphology | Spherical, rod-like, hexagonal, core-shell | Cellular internalization pathways (e.g., rods vs spheres), drug loading/release kinetics. |
| Surface Texture/Coating | Visible corona, PEG layer staining | Stealth properties, targeting ligand density, and orientation. |
| Structural Integrity | Lamellarity of LNPs, crystal lattice of inorganics | Payload encapsulation efficiency, stability, and triggered release. |
Table 2: Comparative Analysis of TEM Staining Protocols for Nanomedicines
| Stain/Technique | Mechanism | Best For | Critical Consideration |
|---|---|---|---|
| Uranyl Acetate (Negative) | Stains background, highlights surface. | Liposomes, LNPs, viral capsids. | pH-dependent aggregation; handle as radioactive waste. |
| Phosphotungstic Acid (PTA) | Negative stain, lower contrast than UA. | Proteins, polymeric NPs. | Adjust to neutral pH to prevent degradation. |
| Osmium Tetroxide (OsO₄) | Fixes and stains lipids, adds contrast. | LNPs, bilayer structures. | Highly toxic vapor; requires dedicated fixation. |
| Cryo-TEM (No Stain) | Vitrification preserves native state. | All labile structures, mRNA-LNPs, micelles. | Requires specialized equipment, expert operation. |
Experimental Protocols
Protocol 3.1: Negative Staining TEM for Lipid Nanoparticles (LNPs)
Objective: To visualize LNP size, morphology, and structural integrity (lamellarity). Materials: See "Scientist's Toolkit" (Section 5). Procedure:
- Glow Discharge: Treat a carbon-coated TEM grid (200-mesh) in a glow discharger for 30-45 seconds to create a hydrophilic surface.
- Sample Application: Pipette 5-10 µL of diluted LNP suspension (in appropriate buffer, e.g., 10 mM HEPES, pH 7.4) onto the grid. Incubate for 60 seconds.
- Blotting: Gently blot away excess liquid using filter paper from the side, leaving a thin film.
- Staining: Immediately apply 10 µL of 2% aqueous uranyl acetate solution. Incubate for 45 seconds.
- Final Blot and Dry: Blot away stain thoroughly and air-dry the grid for 5 minutes in a covered Petri dish.
- Imaging: Insert grid into TEM. Acquire images at various magnifications (e.g., 30,000x, 80,000x) using low-dose conditions.
Protocol 3.2: Cryo-TEM Preparation for mRNA-LNP Formulations
Objective: To image LNPs in their fully hydrated, native state to assess mRNA encapsulation and morphology. Procedure:
- Vitrification Setup: Fill the cryo-workstation (Vitrobot or manual plunger) with liquid ethane. Pre-blot chamber humidity to >90%.
- Grid Preparation: Use quantifoil or lacey carbon grids. Perform glow discharge just prior to use.
- Sample Loading: Apply 3 µL of LNP formulation to the grid. Do not dilute to avoid disrupting equilibrium.
- Blotting and Plunge-Freezing: Blot automatically or manually for 2-4 seconds, then rapidly plunge the grid into liquid ethane. The goal is to form a thin, vitreous ice film.
- Storage and Transfer: Transfer the grid under liquid nitrogen to a cryo-holder. Maintain at <-170°C at all times.
- Imaging: Insert cryo-holder into TEM. Image at ~-180°C using a defocus of -3 to -5 µm to generate phase contrast.
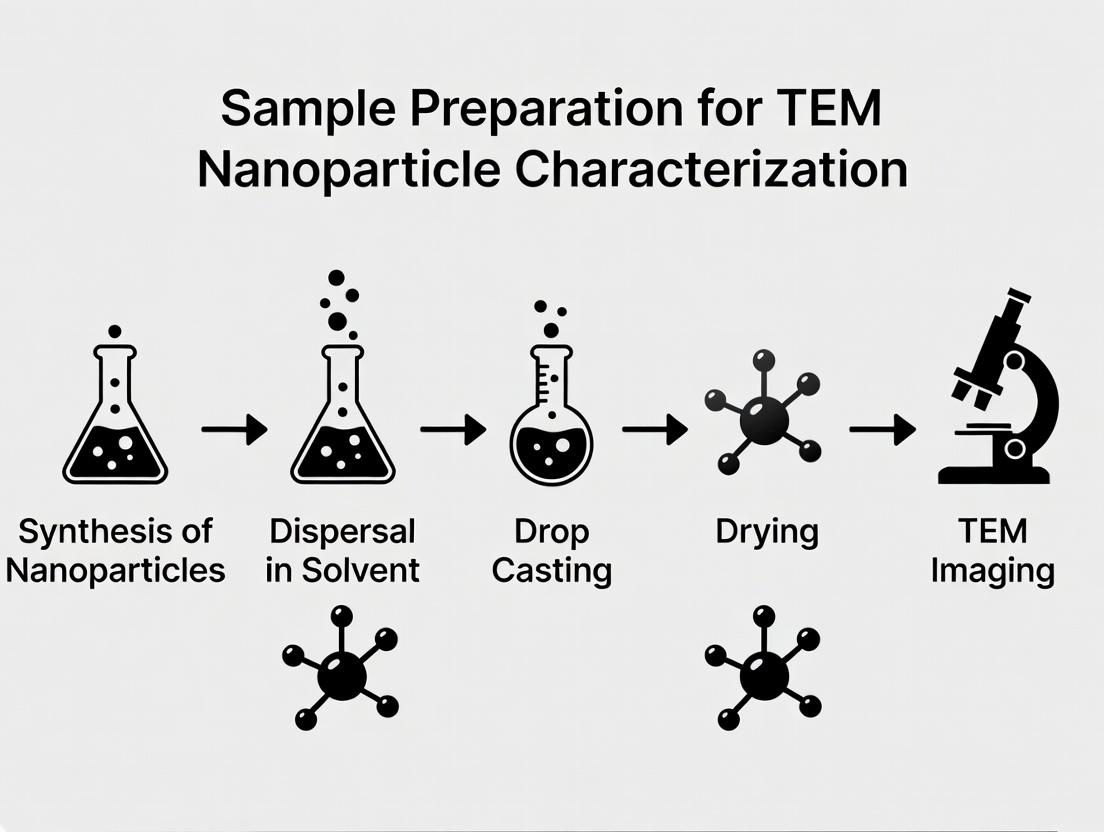
Visualization of Workflows and Relationships
Title: TEM in the Nanomedicine Development Pipeline
Title: TEM Sample Preparation Decision Workflow
The Scientist's Toolkit: Key Research Reagent Solutions
Table 3: Essential Materials for TEM of Nanomedicines
| Item | Function & Rationale | Example Product/Specification |
|---|---|---|
| Continuous Carbon Film Grids | Provide uniform, amorphous support film for high-resolution imaging. | 200-400 mesh copper grids. Quantifoil grids for cryo-TEM. |
| Uranyl Acetate (2% aqueous) | High-contrast negative stain for lipids and polymers. | Pre-filtered (0.22 µm), pH ~4.5. |
| Phosphotungstic Acid (PTA) | Lower-contrast, negative stain for pH-sensitive samples. | Adjust to pH 7.0 with NaOH. |
| Glow Discharger | Creates a hydrophilic grid surface for even sample spreading. | Low-pressure air or argon plasma. |
| Vitrification System | Rapidly freezes samples to preserve native hydrated structure. | Vitrobot, manual plunger. |
| Liquid Nitrogen & Ethane | Cryogen for vitrification; forms amorphous, not crystalline, ice. | High-purity ethane for cryo-TEM. |
| Cryo-TEM Holder | Maintains sample at cryogenic temperatures within the TEM column. | Gatan or Thermo Fisher models. |
| Image Analysis Software | For quantifying size, morphology, and structure from TEM micrographs. | ImageJ/Fiji, Thermo Fisher Velox, Gatan DigitalMicrograph. |
Application Notes on Sample Preparation for TEM Nanoparticle Characterization
Accurate characterization of nanoparticles (NPs) via Transmission Electron Microscopy (TEM) is foundational to research in drug delivery, catalysis, and diagnostics. The validity of data on size, morphology, and dispersion is directly contingent on sample preparation quality. This document details prevalent pitfalls and provides corrective protocols, framed within the thesis that rigorous, standardized preparation is the critical determinant of reliable nanostructural analysis.
Core Pitfalls and Quantitative Impact
The following table summarizes common preparation errors and their quantifiable effects on TEM-derived data, as supported by recent literature.
Table 1: Impact of Common Preparation Pitfalls on TEM Data Fidelity
| Pitfall Category | Specific Error | Resulting Artefact/Misinterpretation | Reported Magnitude of Error |
|---|---|---|---|
| Aggregation/Agglomeration | Inadequate surfactant/dispersant use; improper solvent choice; rapid drying. | Clustering perceived as primary particle size; skewed size distribution. | Can increase apparent "particle" size by 200-500%. Polydispersity Index (PDI) values inflated by >0.3. |
| Sample Cleanliness | Contaminants from grids, tweezers, or ambient dust; residual salts from synthesis. | Extraneous features masking NPs; crystalline salts misidentified as NP phases. | Up to 40% of analyzed grid squares may be unusable, reducing statistical power. |
| Concentration & Loading | Suspension too concentrated or too dilute. | Overlap/aggregation vs. insufficient particle count for analysis. | Optimal surface coverage for counting is 5-15%. Deviations >10% significantly bias statistics. |
| Drying Artefacts | Air-drying of aqueous suspensions with high surface tension. | Capillary forces causing particle collapse, aggregation, or rearrangement at drop edges ("coffee ring" effect). | Particle density at ring edge can be 10x higher than center, distorting dispersion assessment. |
| Structural Degradation | High-energy sonication; exposure to incompatible pH during grid functionalization. | Particle etching, fragmentation, or dissolution. | Size reduction of up to 15% reported for soft polymeric NPs after excessive sonication. |
| Grid Selection | Use of hydrophobic grids for aqueous samples, or incompatible support films. | Poor adhesion, uneven distribution, or unwanted chemical interactions. | Can lead to 100% sample loss from grid squares during imaging. |
Detailed Experimental Protocols for Mitigation
Protocol 1: Standardized Dispersion for Hydrophobic Nanoparticles
Aim: To achieve monodisperse, non-aggregated deposition of hydrophobic NPs (e.g., PLGA, polystyrene) onto TEM grids. Reagents: NP stock suspension in organic solvent (e.g., chloroform, toluene), compatible dispersant (e.g., 0.1% w/v polyvinylpyrrolidone in ethanol), fresh solvent. Procedure:
- Dilution & Stabilization: Dilute NP stock 1:100 in a mixture of 90% fresh organic solvent and 10% dispersant solution. Vortex gently for 10 seconds.
- Brief Sonication: Sonicate in a bath sonicator for 30 seconds at low power (100W). CRITICAL: Do not exceed 1 minute to prevent degradation.
- Immediate Deposition: Within 30 seconds of sonication, pipette 3-5 µL of the suspension onto a hydrophilic carbon-coated TEM grid (e.g., glow-discharged).
- Controlled Drying: Place grid in a covered Petri dish with a small vent. Allow solvent to evaporate slowly over 15-20 minutes in a fume hood.
- Final Rinse (Optional): If dispersant residue is a concern, gently apply 5 µL of pure solvent to the grid and immediately wick away. Repeat once.
Protocol 2: Aqueous NP Deposition via Negative Stain to Preserve Dispersion
Aim: To immobilize aqueous NPs (e.g., liposomes, protein nanoparticles) in their native hydrated state and prevent drying artefacts. Reagents: Aqueous NP suspension, double-filtered deionized water (0.22 µm), 2% uranyl acetate solution (pH ~4.5, filtered), or 2% phosphotungstic acid (neutral pH). Procedure:
- Grid Activation: Use glow-discharged hydrophilic continuous carbon grids to ensure even wetting.
- Sample Application: Apply 5 µL of optimally diluted NP suspension to the grid. Allow to adsorb for 60 seconds.
- Liquid Removal: Gently wick away excess liquid with filter paper from the side, leaving a thin film.
- Stain Application: Immediately apply 5 µL of negative stain. Let sit for 30-45 seconds.
- Final Wick & Dry: Wick away all stain thoroughly. Air-dry the grid for at least 10 minutes before TEM insertion. CAUTION: Uranyl acetate is radioactive and toxic; follow institutional safety protocols.
Visualization of Workflows and Relationships
Title: Causal Pathway from Poor Prep to Misleading Data
Title: Reliable TEM Sample Preparation Workflow
The Scientist's Toolkit: Essential Research Reagent Solutions
Table 2: Key Materials for Reliable TEM Nanoparticle Preparation
| Item | Function & Importance | Selection Notes |
|---|---|---|
| Glow Discharger | Renders carbon-coated grids hydrophilic, ensuring even sample spread and adhesion. Critical for aqueous samples. | Use low-pressure air or argon/amylamine for functionalization. |
| Ultra-Sonicator (Bath) | Provides low-energy disaggregation of NP clusters. Prevents structural damage vs. probe sonication. | Calibrate power/time; use ice bath to prevent heating. |
| Continuous Carbon Films on 300-400 Mesh Grids | Provides uniform, amorphous support with minimal background structure. The standard for most NP work. | Lacey or holey carbon can be used for high-res, but requires expertise. |
| Uranyl Acetate (2% aqueous) | High-contrast negative stain; fixes biological specimens. Essential for visualizing soft materials. | Radioactive. Always filter before use (0.22 µm). |
| Phosphotungstic Acid (PTA, 1-2%) | Negative stain, neutral pH. Less harsh than uranyl acetate for pH-sensitive NPs. | Adjust to pH 7.0 with NaOH for neutral staining. |
| Poly-L-Lysine Solution | Grid functionalizer. Creates a positively charged surface to enhance adhesion of anionic NPs. | Use 0.1% w/v, apply for 30-60 sec, then rinse thoroughly. |
| Precision Micropipettes & Filter Paper | For reproducible sample volume application and controlled liquid wicking. | Use fine-tipped filter paper (e.g., Whatman No.1) cut into wedges. |
| Plasma Cleaner (Alternative to Glow Discharger) | Provides more consistent and cleaner surface activation of grids, reducing hydrocarbon contamination. | Oxygen plasma is effective for creating a hydrophilic surface. |
| Dedicated TEM Grid Storage Box | Prevents mechanical damage, dust contamination, and oxidation of prepared grids. | Use nitrogen-filled desiccator for long-term storage of sensitive samples. |
Within a thesis on sample preparation for Transmission Electron Microscopy (TEM) nanoparticle characterization, the initial planning phase is critical. The properties of the nanoparticles (NPs) themselves and the specific information required from the analysis directly dictate every subsequent step in preparation, imaging, and data interpretation. Incorrect assumptions at this stage lead to artifacts, misinterpretation, and invalid data. This protocol outlines the systematic evaluation required prior to any experimental work.
Core Nanoparticle Properties: Pre-Characterization Checklist
A comprehensive understanding of the following NP properties is essential for designing a valid TEM sample preparation protocol.
Table 1: Key Nanoparticle Properties and Their Impact on TEM Preparation
| Property | Impact on TEM Preparation | Desired Pre-TEM Information (if unknown) |
|---|---|---|
| Core Composition | Determines contrast, beam sensitivity, and required analytical mode (e.g., EDS, EELS). | Expected elements; crystalline or amorphous nature. |
| Size Range | Dictates grid type, support film, staining necessity, and magnification range. | Approximate mean size and polydispersity (DLS, NTA). |
| Shape / Morphology | Influences dispersion technique and the need for tilting tomography. | Expected shape (spherical, rod, cubic, etc.). |
| Surface Chemistry | Determines aggregation state, compatibility with solvents, and interaction with support films. | Coating material (e.g., PEG, citrate, polymer), charge (zeta potential). |
| Solvent / Medium | Defines grid pretreatment, washing requirements, and risk of crystallization artifacts. | Buffer type, ionic strength, presence of stabilizers (BSA, surfactants). |
| Concentration | Affects dilution factor and deposition volume to achieve optimal monolayer coverage. | Particle count per mL (from DLS or NTA). |
| Stability | Determines the urgency of grid preparation and potential for on-grid aggregation. | Sensitivity to air, temperature, or dilution. |
Desired Information: Aligning Goals with Techniques
Clearly defining the research question constrains the preparation methodology. The table below maps desired information to appropriate TEM techniques and sample preparation considerations.
Table 2: Mapping Desired Information to TEM Techniques and Preparation Notes
| Desired Information | Primary TEM Mode | Critical Sample Prep Considerations | Potential Artifacts to Avoid |
|---|---|---|---|
| Size & Size Distribution | Bright-Field (BF) Imaging | Monodisperse, non-aggregated deposition. Statistically significant number of particles (>200). | Aggregation, staining artifacts, beam-induced shrinking. |
| Shape & Morphology | BF Imaging, Tomography | Preservation of native shape; no flattening on substrate. Tilt series for 3D. | Drying forces distorting soft particles, preferential orientation. |
| Crystallinity & Structure | High-Resolution TEM (HRTEM), Selected Area Electron Diffraction (SAED) | Clean, amorphous-free support films (e.g., ultrathin carbon). Minimal beam exposure. | Contamination, support film interference, beam damage. |
| Elemental Composition | Energy-Dispersive X-Ray Spectroscopy (EDS) | Conductive coating to prevent charging; grid choice (e.g., Cu not for Cu analysis). | Grid element signal overlap, spurious X-rays. |
| Core-Shell Structure | Scanning TEM (STEM), EDS Line Scans | Ultrathin supports, high contrast between elements. | Beam mixing of layers, poor signal-to-noise. |
| Ligand Distribution | Negative Staining, Cryo-TEM | For cryo-TEM: rapid vitrification to preserve hydration shell. | Stain penetration issues, dehydration of shell. |
Experimental Protocol: Systematic Pre-TEM Assessment and Grid Selection
Protocol Title: Pre-TEM Nanoparticle Assessment and Preliminary Grid Screening
Objective: To evaluate key nanoparticle properties and select an optimal initial grid preparation strategy.
I. Materials & Reagent Solutions
- Nanoparticle suspension (as provided).
- Ultrapure water (HPLC grade, 18.2 MΩ·cm).
- Common TEM Grids:
- 400-mesh Copper Grids (Ted Pella #01800).
- Formvar/Carbon-coated grids (Ted Pella #01754-F).
- Holey Carbon grids (Quantifoil) (Electron Microscopy Sciences #Q350AR-13).
- Ultra-thin Carbon films on Lacey Carbon (Ted Pella #01824).
- Glow Discharger (e.g., PELCO easiGlow).
- Plasma cleaner (optional, for advanced hydrophilicity).
- Bench-top centrifuge (for NP concentration if needed).
- Dynamic Light Scattering (DLS) / Nanoparticle Tracking Analysis (NTA) instrument.
- Zeta potential analyzer.
II. Procedure
Step 1: Collate Known Synthesis & Physicochemical Data 1.1. Document all known synthesis details: core materials, coatings, reaction solvents, and purification steps. 1.2. Gather any existing characterization data (DLS, UV-Vis, Zeta Potential).
Step 2: Assess Dispersion Medium & Stability 2.1. Visually inspect the suspension for aggregation or precipitation. 2.2. If in a high-salt buffer (>50 mM), consider buffer exchange to a volatile ammonium acetate buffer (e.g., using a centrifugal filter) to prevent salt crystallization on the grid. 2.3. Perform a 1:10 and 1:100 dilution in its native solvent and note if aggregation occurs.
Step 3: Preliminary Size and Charge Measurement 3.1. DLS/NTA: Dilute NPs to appropriate concentration in their native solvent. Measure hydrodynamic diameter and PDI. Note: This informs dilution factor for TEM. 3.2. Zeta Potential: Measure to understand surface charge and colloidal stability. Note: Highly charged samples may interact strongly with charged support films.
Step 4: Initial Grid Screening Strategy 4.1. Based on Table 2 and results from Steps 1-3, select two contrasting grid types for initial trials. * Example 1 (Hard, inorganic NPs): Use a Formvar/Carbon grid and an Ultrathin Carbon on Lacey grid. * Example 2 (Soft, biological NPs): Use a Holey Carbon grid for cryo-TEM evaluation and a negatively stained Formvar/Carbon grid. 4.2. Prepare grids by glow discharge (30-60 sec, medium current) to render them hydrophilic. 4.3. Apply 3-5 µL of nanoparticle suspension (optimally diluted based on DLS concentration) to each grid. 4.4. Blot after 60 sec and air dry (for room temperature TEM) or blot and rapidly plunge freeze (for cryo-TEM). 4.5. Image at low magnification first to assess dispersion, concentration, and artifacts.
III. Data Interpretation and Next Steps
- Compare the two grid types. Evaluate particle distribution, aggregation, and integrity.
- If aggregation is universal, introduce surfactants (e.g., 0.01% w/v Triton X-100) or change buffer.
- If particles are invisible, adjust concentration or consider negative staining (for soft materials).
- This screening directly informs the final, optimized preparation protocol for the thesis research.
The Scientist's Toolkit: Essential Research Reagent Solutions
Table 3: Key Reagents and Materials for TEM Nanoparticle Sample Preparation
| Item | Function & Rationale |
|---|---|
| Holey Carbon Grids (Quantifoil) | Provides a stable, amorphous-free support over holes, ideal for high-resolution imaging and cryo-TEM, preventing background interference. |
| Ultra-thin Continuous Carbon Films (<5 nm) | Minimizes background scattering for high-contrast imaging of small NPs (<10 nm) and high-resolution work. |
| Uranyl Acetate (2% aqueous) | Common negative stain; envelopes particles, providing high contrast of outlines and surface features for soft or organic nanoparticles. |
| Ammonium Acetate Buffer (100-200 mM) | A volatile buffer used for buffer exchange; it evaporates cleanly under vacuum, leaving minimal crystalline salts. |
| Glycerol (10% v/v) | Added to viscous samples (e.g., from serum) to facilitate even spreading and reduce the "coffee ring" effect during grid drying. |
| Pluronic F-127 (0.1% w/v) | A non-ionic, amphiphilic polymer surfactant used to reduce nanoparticle aggregation on the grid without introducing heavy metal artifacts. |
| Glow Discharge System | Creates a hydrophilic, negatively charged surface on hydrophobic carbon films, ensuring even dispersion of aqueous samples. |
Visualized Workflows
Workflow for NP TEM Prep Planning
Info Goals Dictate Technique & Prep
Essential Lab Equipment and Consumables for TEM Sample Prep
Within a thesis focused on advancing nanoparticle characterization for drug delivery systems, Transmission Electron Microscopy (TEM) is indispensable for obtaining high-resolution images of nanoparticle morphology, size distribution, and internal structure. The cornerstone of acquiring publication-quality TEM data is rigorous, reproducible sample preparation. This application note details the essential equipment and consumables required for TEM sample preparation of nanoparticle suspensions, framed within a research context aimed at minimizing artifacts and ensuring statistical relevance.
Essential Equipment and Consumables: The Scientist's Toolkit
A successful TEM nanoparticle workflow requires both precise instrumentation and high-purity disposable items. The following tables categorize and detail these essentials.
Table 1: Core Capital Equipment
| Equipment | Primary Function in TEM Sample Prep | Key Specification Considerations |
|---|---|---|
| Analytical Balance | Precisely weighing nanoparticles, precursors, or staining salts. | Capacity: 60-120 g; Readability: 0.01 mg (for small sample masses). |
| Ultrasonic Bath or Probe Sonicator | Dispersing nanoparticle agglomerates in suspension prior to grid application. | Bath: 40-80 kHz; Probe: Adjustable power (1-10W for sensitive samples). |
| Glove Box (Argon/N₂) | Preparing air-sensitive nanoparticles (e.g., some metallic NPs) to prevent oxidation. | Oxygen and moisture levels <1 ppm. |
| Plasma Cleaner (Harrick Plasma, etc.) | Rendering TEM grids hydrophilic to ensure even sample adhesion and spreading. | Low-pressure RF plasma; oxygen or argon gas. |
| Critical Point Dryer (CPD) | Drying delicate, porous, or hydrogel-embedded nanoparticles without structural collapse. | Automated CO₂ cycle with temperature/pressure control. |
| Ultramicrotome | Sectioning resin-embedded nanoparticle samples (e.g., for cellular uptake studies). | Diamond knife; sectioning range 50-200 nm. |
Table 2: Key Consumables & Reagents
| Consumable/Reagent | Function & Importance | Selection Criteria |
|---|---|---|
| TEM Support Grids | The substrate onto which the sample is applied. | Material: Copper (most common), gold (for biological samples), nickel; Mesh: 200-400; Coating: Continuous carbon or formvar/carbon for stability. |
| Filter Paper (High-grade) | Blotting excess liquid from TEM grids during negative staining or washing. | Lint-free, high wet-strength (e.g., Whatman No. 1). |
| Micro-pipettes & Tips | Accurately dispensing small volumes (3-10 µL) of nanoparticle suspension. | Positive displacement tips for viscous samples; volume range: 0.5-10 µL. |
| Staining Reagents | Enhancing contrast of organic or polymeric nanoparticle shells. | Uranyl Acetate (2%): High contrast, but radioactive. Phosphotungstic Acid (PTA, 1-2%): Negative stain, non-radioactive. Ammonium Molybdate: For pH-sensitive samples. |
| Embedding Resin Kits | Encapsulating nanoparticles for ultramicrotomy sectioning (e.g., for in vitro studies). | Epoxy resins (Epon, Spurr's) or acrylic resins (LR White) for different hardness. |
| Dewar Flask for LN₂ | Storage of cryo-grids or certain frozen-hydrated samples. | 50 L capacity for long-term storage. |
Application Notes & Detailed Protocols
Protocol: Standard Negative Staining for Polymeric Nanoparticles
Objective: To visualize the size and shape of liposomal or polymeric nanoparticles with enhanced contrast.
Materials:
- Purified nanoparticle suspension (0.1-1 mg/mL concentration)
- Carbon-coated 300-mesh copper grids
- Plasma cleaner
- Uranyl acetate (2%, pH ~4.5) or PTA (2%, pH ~7.0)
- Parafilm
- Filter paper wedges
- Two glass Petri dishes
- Micropipettes and tips
Methodology:
- Grid Activation: Place carbon-coated grids in a plasma cleaner for 30-45 seconds under low pressure to render them hydrophilic.
- Sample Application: Float a grid, carbon-side down, on a 50 µL droplet of nanoparticle suspension placed on Parafilm for 60 seconds.
- Washing: Carefully blot the edge of the grid with filter paper, then immediately float it on a droplet of deionized water for 10 seconds. Repeat with a second water droplet.
- Negative Staining: Transfer the grid to a 50 µL droplet of the chosen stain (e.g., uranyl acetate) for 30-60 seconds.
- Drying: Blot the grid thoroughly from the edge with filter paper to leave a thin, even film. Let it air-dry completely in a covered Petri dish.
- Storage: Store grids in a rigid grid box in a desiccator prior to TEM imaging.
Protocol: Cryo-TEM Sample Preparation (Vitrification)
Objective: To image nanoparticles in a near-native, hydrated state, preventing drying artifacts.
Materials:
- Quantifoil or C-flat holey carbon grids (Au or Cu, 300 mesh)
- Vitrification robot (e.g., Vitrobot) or manual plunger
- Ethane/propane mixture
- Liquid nitrogen and Dewars
- Filter paper (standardized blotting force/time)
- Glow discharger
Methodology:
- Grid Preparation: Glow-discharge holey carbon grids to make them hydrophilic.
- Loading: Apply 3-5 µL of nanoparticle suspension to the grid in the Vitrobot chamber (maintained at 100% humidity, 22°C).
- Blotting: Automatically blot from both sides for 2-5 seconds to create a thin liquid film across the holes.
- Plunging: Rapidly plunge the grid into liquid ethane cooled by liquid nitrogen, achieving vitrification (>10⁴ K/sec).
- Transfer & Storage: Transfer the grid under LN₂ to a pre-cooled grid storage box and maintain at liquid nitrogen temperature.
Visualizing Workflows and Relationships
Title: TEM Nanoparticle Prep Pathway Decision Flow
Title: Core Reagent Solutions & Their Functions
Step-by-Step TEM Prep Protocols: From Droplet to Grid for Diverse Nanoparticles
Within the critical workflow of transmission electron microscopy (TEM) for nanoparticle characterization, selecting the appropriate grid and support film is a foundational step that dictates imaging quality and analytical success. This guide, framed within the broader thesis of optimizing sample preparation for nanoparticle research in drug development, details the applications and protocols for three prevalent supports: continuous carbon, holey carbon, and Formvar films.
Film Types: Properties and Quantitative Comparison
| Property | Continuous Carbon Film | Holey Carbon (Quantifoil, C-flat) | Formvar (Polyvinyl Formaldehyde) |
|---|---|---|---|
| Primary Application | General nanoparticle sizing, morphology, high-resolution imaging of stained biological samples. | Cryo-EM, tomography, 3D reconstruction, analysis of particles suspended in vitreous ice. | Routine screening, immuno-gold labeling, negative staining of proteins/viruses. |
| Typical Thickness | 5-20 nm | 5-20 nm (with 1-2 μm holes) | 10-30 nm |
| Stability under Beam | Excellent, high conductivity. | Excellent, high conductivity. | Poor, susceptible to melting/charging. |
| Background Noise | Moderate (amorphous carbon). | Very Low in holes; high on carbon. | Low when clean, but can be variable. |
| Autofluorescence | Low | Low | High (interferes with correlative light microscopy). |
| Cost | Moderate | High | Low |
| Best For (Nanoparticles) | Solid metallic NPs, liposomes, polymerosomes (on support). | Liposomes, exosomes, protein-conjugated NPs in vitreous ice. | Preliminary screening of NP shape/size distribution. |
Experimental Protocols
Protocol 1: Preparing a Continuous Carbon Film Grid for Negative Staining
Application: Assessing size and morphology of lipid nanoparticles (LNPs) or inorganic nanocrystals.
Materials: Continuous carbon film on 300-400 mesh copper grids, phosphate-buffered saline (PBS), nanoparticle suspension, 1-2% uranyl acetate (or 2% phosphotungstic acid), filter paper.
Method:
- Plasma Clean (Optional but recommended): Subject the grid to a glow discharge system (low pressure, air or argon) for 30-60 seconds to render the carbon hydrophilic.
- Sample Application: Pipette 5-10 µL of the nanoparticle suspension (in PBS or relevant buffer) onto the carbon film. Allow to adsorb for 60 seconds.
- Blotting: Gently touch the edge of the grid with a piece of filter paper to remove excess liquid. Do not let the grid dry completely.
- Negative Stain: Immediately apply a 10 µL droplet of 1-2% uranyl acetate to the grid. Let it sit for 60 seconds.
- Final Blot and Dry: Blot off excess stain thoroughly from the edge. Allow the grid to air-dry completely before TEM insertion.
- Storage: Store in a grid box in a desiccator.
Protocol 2: Preparing a Holey Carbon Grid for Cryo-EM of Nanoparticles
Application: Visualizing drug-loaded liposomes or viral vectors in a near-native, vitrified state.
Materials: Quantifoil R 1.2/1.3 300-mesh gold grids, vitrification system (e.g., Vitrobot), nanoparticle suspension, filter paper (Whatman No. 1), liquid ethane.
Method:
- Grid Glow Discharge: Use a glow discharger to make the holey carbon grid hydrophilic just before use (30-40 seconds, medium power).
- Vitrobot Setup: Set Vitrobot parameters to 100% humidity, 4°C (or room temperature as appropriate), blot force 0-5, blot time 3-5 seconds.
- Loading: Pipette 3-4 µL of the purified nanoparticle suspension onto the grid (glow-discharged side) within the Vitrobot chamber.
- Blotting and Plunging: Initiate the automated blotting sequence, which removes excess liquid, leaving a thin film spanning the holes. The grid is automatically plunged into liquid ethane, achieving vitrification.
- Storage: Transfer the grid under liquid nitrogen to a cryo-grid storage box and then into a cryo-TEM holder.
Protocol 3: Preparing a Formvar Film Grid for Immunogold Labeling
Application: Localizing specific surface antigens on functionalized nanoparticles.
Materials: Formvar-coated nickel grids, blocking buffer (1% BSA in PBS), primary antibody, gold-conjugated secondary antibody, wash buffer (PBS).
Method:
- Float and Transfer: Float a Formvar film on water and pick up with a nickel grid. Allow to dry.
- Sample Adsorption: Place a 10 µL droplet of nanoparticle suspension on the Formvar film for 20 minutes in a humidity chamber.
- Blocking: Wash grid on a 50 µL droplet of PBS, then transfer to a 50 µL droplet of blocking buffer for 15 minutes.
- Primary Antibody: Incubate on a 20 µL droplet of diluted primary antibody for 1 hour at room temperature.
- Wash: Rinse by sequentially placing the grid on six separate 50 µL droplets of PBS (2 minutes each).
- Secondary Antibody: Incubate on a 20 µL droplet of gold-conjugated (e.g., 10 nm) secondary antibody for 1 hour.
- Final Wash and Stain: Wash again on six PBS droplets. Optionally, negatively stain with 1% uranyl acetate for 30 seconds, blot, and air-dry.
Decision Workflow for Support Film Selection
Decision Workflow for TEM Support Film Selection
The Scientist's Toolkit: Key Research Reagent Solutions
| Item | Function in TEM Sample Prep |
|---|---|
| Glow Discharger | Renders hydrophobic carbon/plastic films hydrophilic, ensuring even sample spreading. |
| Uranyl Acetate (2%) | Common negative stain; provides high contrast by embedding around particles. |
| Phosphotungstic Acid (2%, pH 7) | Negative stain alternative for pH-sensitive samples; less granular than uranyl. |
| BSA (Bovine Serum Albumin) | Used in blocking buffers to prevent non-specific binding in immunogold labeling. |
| Protein A-Gold Conjugates (5-15 nm) | Secondary probes for immunogold labeling; provide precise localization of antigens. |
| Vitrification System (Vitrobot) | Automated instrument for reproducible plunge freezing of samples for cryo-EM. |
| Liquid Ethane | Cryogen for rapid vitrification of aqueous samples, preventing ice crystal formation. |
| Continuous Carbon Film (300 mesh Cu) | Standard, robust support for high-resolution imaging of stable nanoparticles. |
| Quantifoil R 1.2/1.3 Gold Grids | Holey carbon grids with defined hole size/spacing optimized for cryo-EM tomography. |
| Formvar-Carbon Coated Nickel Grids | Combines Formvar's ease with carbon's stability; ideal for immunolabeling. |
Within the broader thesis on sample preparation for Transmission Electron Microscopy (TEM) nanoparticle characterization, negative staining remains a foundational, rapid technique for visualizing morphology, size, and aggregation state. It is indispensable for researchers in nanomedicine and drug development assessing liposomes, viral vectors, and protein-based therapeutics. This protocol details the application of the two most common and high-contrast stains: uranyl acetate (UA) and phosphotungstic acid (PTA).
Key Research Reagent Solutions
| Reagent | Primary Function | Key Considerations |
|---|---|---|
| Uranyl Acetate (UA) | High-contrast, heavy metal stain. Binds to biomolecules, leaving background dark. | Superior resolution (~1.5 nm). Light-sensitive, radioactive. Requires proper disposal. |
| Phosphotungstic Acid (PTA) | Non-radioactive, acidic stain. Stains the background, leaving specimen light. | Lower intrinsic contrast than UA. Can denature acid-sensitive specimens. |
| Carbon-coated EM Grids | Provide a hydrophilic, conductive support film for sample adhesion. | 300-400 mesh copper grids are standard. Glow discharge enhances hydrophilicity. |
| Sample Buffer | The solution (e.g., PBS, ammonium acetate) in which the nanoparticle sample is suspended. | Must be volatile and low-salt to prevent crystallization artifacts. |
| Whatman No. 1 Filter Paper | Used to wick away excess liquid from the grid. | High absorbency and low particle shedding are critical. |
Quantitative Stain Properties Comparison
Table 1: Characteristics of Uranyl Acetate vs. Phosphotungstic Acid
| Property | Uranyl Acetate (UA) | Phosphotungstic Acid (PTA) |
|---|---|---|
| Standard Working pH | ~4.5 (acidic) | Adjusted to 6.5-7.0 with NaOH/KOH |
| Typical Concentration | 0.5% - 2.0% (w/v) in H₂O | 1.0% - 2.0% (w/v) in H₂O |
| Primary Interaction | Ionic binding to -COO⁻ & -PO₄⁻ groups | General negative charge, surrounds specimen |
| Contrast Level | Very High | Moderate to High |
| Resolution Potential | ~1.5 nm | ~2-3 nm |
| Radioactive | Yes (weak α-emitter) | No |
| Stability | Light-sensitive, precipitate over time | Stable aqueous solution |
| Best For | Proteins, viruses, DNA, lipid structures | Acid-stable specimens, routine screening |
Detailed Protocols
Protocol A: Single-Drop Negative Staining with Uranyl Acetate
This protocol is optimized for high-contrast imaging of robust nanoparticles like viruses or liposomes.
- Grid Preparation: Render carbon-coated grids hydrophilic via glow discharge (30-60 seconds, low pressure).
- Sample Application: Apply a 5-10 µL droplet of purified nanoparticle suspension to the grid surface. Allow to adsorb for 60 seconds.
- Wash: Touch the edge of the grid to a droplet of deionized water (or volatile buffer like 50 mM ammonium acetate) for 2-3 seconds to remove salts. Blot side-edge with filter paper.
- Stain Application: Immediately apply a 10 µL droplet of filtered 2% uranyl acetate solution. Stain for 30-45 seconds.
- Final Blot: Wick away the stain completely by touching the edge of the grid to filter paper, leaving a thin film.
- Drying: Air-dry completely in a covered petri dish. Store in grid box. Image as soon as possible.
Protocol B: Double-Layer Negative Staining with Phosphotungstic Acid
This method, using neutralized PTA, is gentler and suitable for initial screening or acid-sensitive samples.
- Grid & Sample: Follow steps 1-3 of Protocol A.
- First Stain Layer: Apply a 10 µL droplet of 1% PTA (pH 7.0) for 10 seconds. Blot completely.
- Second Stain Layer: Re-apply a fresh 10 µL droplet of 1% PTA (pH 7.0) for 10 seconds.
- Final Blot & Dry: Wick away all liquid. Air-dry thoroughly before TEM observation.
Workflow & Decision Pathway
Within the broader thesis on sample preparation for TEM nanoparticle characterization, this protocol addresses the critical challenge of maintaining the structural integrity of lipid-based nanoparticles during TEM analysis. Liposomes and LNPs are inherently dynamic and susceptible to fusion, degradation, and the introduction of artifacts during preparation, which can skew size distribution, lamellarity, and morphology data. The following application notes and detailed protocols are designed to mitigate these issues, ensuring reliable and reproducible imaging for drug development and formulation research.
Key Challenges & Stabilization Strategies
The primary challenges in TEM preparation of lipid nanoparticles are fusion/aggregation during sample drying, structural distortion due to staining, and ice crystal damage in cryo-TEM. Stabilization is achieved through careful control of buffer conditions, the use of cryo-protectants, and optimized staining/vitrification techniques.
Table 1: Common Artifacts and Preventive Strategies
| Artifact Type | Cause | Preventive Strategy | Resulting Artifact in TEM |
|---|---|---|---|
| Particle Fusion/Aggregation | Evaporation-driven concentration, hydrophobic interaction | Use of continuous carbon support grids; rapid vitrification; inclusion of steric stabilizers (e.g., PEG) | Clumped particles, irregular large aggregates |
| Membrane Disruption | Osmotic shock, detergent contamination | Use of iso-osmotic buffers (e.g., sucrose, HEPES); strict avoidance of detergents | Broken vesicles, "flower-like" structures |
| Negative Stain Artifacts | Over-staining, incomplete drying, stain crystallization | Optimized stain concentration (1-2% uranyl acetate); use of methylamine tungstate; blotting for consistent film | Crystalline aggregates, uneven background, false membrane features |
| Ice Crystallization (Cryo) | Slow vitrification, insufficient blotting | Use of ethane/propane cryogen; optimized blot time/temperature; humidity control >95% | Dark, granular ice, obscured particle boundaries |
Detailed Experimental Protocols
Protocol 3.1: Negative Stain TEM with Artifact Prevention
Objective: To image liposomes/LNPs with minimal aggregation and stain artifacts. Materials: LNP sample, 400-mesh continuous carbon grids, 1-2% uranyl acetate (pH 4.0) or 2% ammonium molybdate, filter paper, glow discharger. Procedure:
- Grid Preparation: Glow discharge continuous carbon grids for 30-45 seconds to create a hydrophilic surface.
- Sample Application: Dilute sample in appropriate iso-osmotic buffer (e.g., 300 mM sucrose, 20 mM HEPES). Apply 3-5 µL to the grid and incubate for 60 seconds.
- Blotting: Gently blot excess liquid with filter paper from the grid edge, leaving a thin film.
- Staining (Immediate): Apply 5 µL of stain to the grid for 45 seconds. Do not allow to dry.
- Final Blot & Dry: Blot stain thoroughly and air-dry for 5 minutes.
- Critical Note: Image immediately to prevent stain crystallization. For sucrose-containing buffers, a brief, gentle wash with Milli-Q water after sample incubation may be needed before staining to reduce sugar background.
Protocol 3.2: Cryo-TEM Sample Vitrification Protocol
Objective: To vitrify samples for native-state imaging, preventing fusion and drying artifacts. Materials: Quantifoil or Lacey carbon grids (200-300 mesh), vitrification device (e.g., Vitrobot), liquid ethane, blotting paper, humidity control chamber. Procedure:
- Grid Preparation: Plasma clean grids for 15-20 seconds to ensure high hydrophilicity.
- Vitrobot Setup: Set chamber to >95% humidity and 22°C (or 4°C for temperature-sensitive samples).
- Loading: Apply 3 µL of sample to the grid inside the vitrobot chamber.
- Blotting: Blot for 3-5 seconds with medium force to create a thin film (20-150 nm).
- Plunge-Freeze: Immediately plunge into liquid ethane cooled by liquid nitrogen. Transfer to liquid nitrogen storage.
- Key Parameter: Blot time is sample-dependent. Optimal time yields a film thin enough for transmission but thick enough to contain particles without distortion.
The Scientist's Toolkit: Research Reagent Solutions
Table 2: Essential Materials for Preventing Artifacts
| Item | Function & Rationale |
|---|---|
| Continuous Carbon Film Grids | Provides uniform, non-perforated support, preventing particle aggregation at hole edges common in holey carbon grids. |
| Uranyl Acetate (1-2%, pH 4) | Standard negative stain; low pH helps stabilize acidic phospholipids. Pre-mix and filter (0.22 µm) to prevent crystals. |
| Ammonium Molybdate (2%, pH 7.0) | Near-neutral stain alternative, reduces lipid extraction and is less granular for finer detail. |
| Sucrose or Trehalose (300 mM) | Provides iso-osmotic conditions, prevents osmotic shock and collapse of vesicles during drying. |
| PEG-lipids (e.g., DSPE-PEG2000) | Included in formulation or dilution buffer to provide steric stabilization, preventing fusion on the grid. |
| Glow Discharger / Plasma Cleaner | Creates a consistently hydrophilic grid surface, ensuring even sample spread and reduced aggregation. |
| Liquid Ethane / Propane | Cryogen for rapid vitrification; cools faster than liquid nitrogen alone, preventing ice crystal formation. |
| Vitrobot or Manual Plunge Freezer | Standardized instrument for controlling blot time, force, humidity, and plunge speed for reproducible cryo-grids. |
Workflow and Decision Diagrams
Title: Decision Workflow for TEM Prep of Lipid Nanoparticles
Title: Root Cause & Solution Map for LNP TEM Artifacts
1. Introduction: Context Within TEM Sample Preparation Thesis
This protocol is a dedicated module within a comprehensive thesis on transmission electron microscopy (TEM) sample preparation for nanoparticle characterization. Polymeric nanoparticles (PNPs) and micelles present unique challenges in TEM analysis due to their low inherent electron contrast (composed primarily of light elements like C, H, O, N) and susceptibility to deformation, aggregation, and structural collapse during drying. This document provides application notes and detailed protocols to overcome these challenges, enabling accurate size, morphology, and structural assessment critical for drug development and formulation science.
2. Core Challenges and Quantitative Data Summary
The primary hurdles in TEM analysis of polymeric nanostructures are summarized in the table below.
Table 1: Key Challenges in TEM Analysis of Polymeric Nanostructures
| Challenge | Root Cause | Consequence on TEM Image |
|---|---|---|
| Low Electron Contrast | Low atomic number (Z) of polymer constituents (e.g., PLGA, PEG, PLA). | Poor visibility, faint images, inability to distinguish core-shell structure. |
| Drying Artifacts | High surface tension of water during air-drying. | Particle aggregation, flattening, coalescence, and destruction of micellar morphology. |
| Solvent-Induced Deformation | Partial solubility or swelling in residual solvent. | Altered size and shape, blurred boundaries. |
| Beam Sensitivity | Polymer degradation under high electron dose. | Morphological changes and mass loss during imaging. |
3. Detailed Experimental Protocols
Protocol 3.1: Negative Staining for Enhanced Contrast
- Objective: To surround low-contrast particles with a heavy metal salt, enhancing edge delineation and revealing surface morphology.
- Materials: PNP/micelle suspension, Uranyl acetate (2% w/v, pH ~4.5) or Phosphotungstic acid (2% w/v, neutral pH), Carbon-coated TEM grids (200-400 mesh), Parafilm, Filter paper.
- Procedure:
- Plasma clean the carbon-coated grid for 30 seconds to render it hydrophilic.
- Place a 10 µL droplet of the nanoparticle suspension on the grid. Allow to adsorb for 60 seconds.
- Blot the liquid carefully with filter paper from the grid edge, leaving a thin film.
- Immediately place a 10 µL droplet of the stain solution onto the grid. Incubate for 30-60 seconds.
- Blot the stain thoroughly and completely dry the grid in air.
- Image at 80-100 kV to minimize beam damage.
- Critical Note: Staining time and concentration must be optimized. Over-staining can obscure detail, while under-staining provides insufficient contrast.
Protocol 3.2: Cryogenic-TEM (cryo-TEM) to Preserve Native State
- Objective: To vitrify the sample, immobilizing particles in a thin layer of amorphous ice, preventing drying artifacts and observing the hydrated state.
- Materials: PNP/micelle suspension, Lacey carbon or Quantifoil TEM grids, Vitrification device (plunger), Liquid ethane, Filter paper, Cryo-transfer holder.
- Procedure:
- Apply 3-5 µL of sample to a glow-discharged grid.
- Blot excess sample with filter paper from the back side for 2-5 seconds to create a thin liquid film (<1 µm).
- Rapidly plunge the grid into liquid ethane cooled by liquid nitrogen.
- Transfer the vitrified grid under liquid nitrogen to a cryo-holder.
- Insert the holder into the TEM and image at ~-175°C using low-dose techniques (<20 e⁻/Ų) at 120-200 kV.
- Critical Note: Sample concentration and blotting time are crucial for obtaining an optimal ice thickness.
Protocol 3.3: Advanced Drying Protocol (Critical Point Drying - Principle)
- Objective: To remove solvent without crossing a liquid-vapor phase boundary, minimizing surface tension forces.
- Note: While Cryo-TEM is preferred, Critical Point Drying (CPD) can be an alternative for some samples. This is a specialized instrument protocol.
- General Workflow: Chemical fixation (e.g., glutaraldehyde) -> Solvent dehydration (ethanol series) -> Solvent substitution with transitional fluid (e.g., liquid CO₂) -> Heat above critical point (31°C, 73.8 bar for CO₂) -> Vent gas slowly.
4. Visualization: Workflow Decision Logic
Diagram Title: TEM Method Selection for Polymeric Nanoparticles
5. The Scientist's Toolkit: Essential Research Reagents & Materials
Table 2: Key Research Reagent Solutions for TEM of Polymeric Nanostructures
| Item | Function & Rationale |
|---|---|
| Uranyl Acetate (2%, pH 4.5) | High-Z negative stain. Provides strong amorphous coating around particles, highlighting boundaries. Acidic pH may not be suitable for all polymers. |
| Phosphotungstic Acid (PTA, 1-2%, neutral pH) | Alternative negative stain. Less electron-dense than uranium but neutral pH is gentler on sensitive polymers and allows for staining of coated grids. |
| Glow Discharger / Plasma Cleaner | Renders hydrophobic carbon grids hydrophilic, ensuring even sample spreading and thin ice formation for cryo-TEM. |
| Holey Carbon Grids (Quantifoil/Lacey) | Grids with a regular or irregular holey carbon film. Essential for cryo-TEM to suspend vitrified sample over holes, minimizing background noise. |
| Liquid Ethane | Cryogen for vitrification. Its high heat capacity enables cooling rates fast enough to form amorphous, non-crystalline ice, preserving native structure. |
| Cryo-TEM Holder | Specially designed TEM holder that maintains the grid at liquid nitrogen temperatures (< -170°C) during transfer and imaging, preventing ice crystallization. |
| Glutaraldehyde (e.g., 0.1-2%) | Cross-linking fixative. Can be used to lightly stabilize sensitive polymeric structures (especially micelles) prior to staining or CPD, reducing deformation. |
Within the broader thesis on sample preparation for TEM nanoparticle characterization, cryogenic transmission electron microscopy (cryo-TEM) stands as the definitive technique for imaging nanoparticles in a hydrated, near-native state. This protocol is indispensable for researchers in drug development, particularly for characterizing lipid nanoparticles (LNPs), exosomes, polymeric micelles, and protein complexes, where preserving the hydrated structure is critical for accurate size, morphology, and lamellarity assessment. Conventional negative stain or room-temperature TEM introduces artifacts through dehydration, adsorption, and flattening. Cryo-TEM vitrifies the sample, immobilizing it in a glass-like ice film, preventing ice crystal formation that would damage delicate structures. This application note details a protocol optimized for nanoparticle suspensions, enabling high-resolution structural analysis under conditions that closely mimic the native physiological environment.
Key Materials & Research Reagent Solutions
Table 1: Essential Reagents and Materials for Cryo-TEM Sample Preparation
| Item Name | Function & Rationale |
|---|---|
| Quantifoil or C-flat Holey Carbon Grids | TEM grids with a regular array of holes. The sample is suspended across these holes, enabling imaging without a background carbon film that could obscure details or induce adsorption artifacts. |
| Glow Discharger (Plasma Cleaner) | Renders the grid hydrophilic by introducing charged groups on the carbon surface. This ensures even spreading of the aqueous sample across the grid holes. |
| Vitrification Robot (e.g., Vitrobot, GP2) | An automated plunge freezer that controls blot time, force, humidity (95-100%), and temperature (e.g., 4°C or 22°C) for highly reproducible vitrification. |
| Liquid Ethane / Propane Cryogen | Cryogen with high heat capacity. Rapid cooling (>10^4 K/sec) in liquid ethane/propane achieves vitrification, forming amorphous ice instead of crystalline ice. |
| Liquid Nitrogen Dewars | For storage and transfer of vitrified grids at approximately -180°C, maintaining the vitreous state. |
| Cryo-TEM Holder | Specially designed TEM holder that keeps the grid at cryogenic temperatures (≤ -170°C) during imaging to prevent devitrification. |
| Filter Paper (Blotting Paper) | High-quality, standardized filter paper for the automated blotting process to remove excess sample and create a thin film (typically 20-200 nm thick). |
Detailed Experimental Protocol
Protocol: Vitrification of Nanoparticle Suspensions for Cryo-TEM
Objective: To prepare a vitrified, hydrated sample of nanoparticles on a TEM grid for near-native state imaging.
Materials Preparation:
- Sample: Purified nanoparticle suspension (e.g., LNPs, exosomes). Optimize concentration empirically; a typical starting point is 0.05-0.5 mg/mL for proteins, 10^10-10^11 particles/mL for vesicles.
- Grid Preparation: Use 200-300 mesh copper grids with a holey carbon film (e.g., Quantifoil R 2/2). Glow discharge the grids for 30-60 seconds at a medium current level (e.g., 15-25 mA) under a partial atmosphere of air or argon. Use grids immediately (within 15-60 minutes).
- Cryogen Setup: Cool a liquid ethane/propane container within a liquid nitrogen bath. The ethane should be just frozen and then melted to a slushy state for optimal heat transfer.
Vitrification Procedure (Using an Automated Plunge Freezer):
- Instrument Setup: Configure the Vitrobot or equivalent. Standard parameters for many nanoparticles: Chamber humidity: 95-100%, Temperature: 4°C or 22°C, Blot time: 2-5 seconds, Blot force: variable (start with medium setting), Drain time: 0 seconds. Note: These parameters require optimization for each sample type.
- Loading: Mount a glow-discharged grid into the plunge freezer tweezers.
- Application: Apply 3-5 µL of the sample suspension onto the grid (carbon side).
- Blotting: Initiate the automated blot sequence. Two pieces of filter paper gently remove excess liquid from both sides of the grid, leaving a thin film suspended across the holes.
- Plunging: The robot immediately plunges the grid into the liquid ethane slush. The ultra-rapid cooling vitrifies the water in the film.
- Transfer: Under liquid nitrogen, carefully transfer the grid from the ethane chamber into a pre-cooled grid storage box within a liquid nitrogen dewar. Grids are stored under liquid nitrogen until imaging.
Imaging:
- Transfer the grid storage box under liquid nitrogen to the cryo-TEM.
- Load the grid into a pre-cooled cryo-holder using a cryo-transfer station to prevent frost accumulation.
- Insert the holder into the TEM and image at an acceleration voltage of 120-300 kV, using low-dose techniques to minimize beam damage.
Table 2: Critical Optimization Parameters and Typical Values
| Parameter | Typical Starting Range | Purpose & Impact |
|---|---|---|
| Sample Concentration | 0.05 - 0.5 mg/mL (protein) | Too high causes particle overlap/aggregation; too low yields empty micrographs. |
| Blot Time | 2 - 5 seconds | Controls film thickness. Longer times yield thinner ice, which is better for resolution but may disrupt particles. |
| Blot Force | Instrument-specific (e.g., 0-20) | Affects fluid removal. High force can cause preferential orientation or deformation. |
| Wait Time (after application) | 0 - 30 seconds | Allows particles to adsorb to the air-water interface, which can be a source of denaturation. Minimizing this is often key. |
| Humidity | ≥ 95% | Prevents evaporation of the thin film during the blotting process, which can concentrate salts and alter pH. |
Visualization of Workflows and Relationships
Cryo-TEM Sample Prep Workflow
Key Challenge: Air-Water Interface Denaturation
In the context of a thesis on sample preparation for Transmission Electron Microscopy (TEM) nanoparticle characterization, particularly in nanomedicine and drug delivery research, the choice of drying method is a critical, often irreversible step. The method selected directly influences the preservation of nanoparticle size, morphology, dispersion state, and surface characteristics. Air drying, blotting, and critical point drying (CPD) represent a spectrum from the simplest to the most technically complex approaches, each with distinct impacts on sample integrity and consequent TEM imaging fidelity. This article provides detailed application notes and protocols to guide researchers in selecting and implementing the appropriate technique.
Comparative Analysis of Drying Methods
The following table summarizes the core characteristics, artifacts, and recommended applications for each method, based on current literature and standard practice.
Table 1: Comparative Summary of Drying Techniques for TEM Nanoparticle Samples
| Parameter | Air Drying | Blotting (Passive) | Critical Point Drying (CPD) |
|---|---|---|---|
| Principle | Evaporation of liquid at ambient pressure and temperature. | Capillary withdrawal of liquid via absorbent paper, leaving a thin film. | Replacement of liquid with transitional fluid, then surpassing the critical point to avoid liquid-gas interface. |
| Primary Artifact | Severe aggregation/agglomeration; salt crystal precipitation; flattening of soft materials (e.g., liposomes). | Meniscus effects leading to "coffee-ring" deposition at droplet edges; some aggregation. | Minimal aggregation; best preservation of 3D structure of soft or porous materials. |
| Sample Integrity | Poor. High surface tension forces distort and pull nanoparticles together. | Moderate to Good. Reduces, but does not eliminate, capillary forces. | Excellent. Effectively eliminates destructive capillary forces. |
| Complexity/Cost | Low (bench-top). | Low (requires filter paper). | High (specialized equipment, high-pressure vessels). |
| Typical Process Time | 10-60 minutes. | 5-15 minutes. | 1.5-3 hours (including chamber purges). |
| Ideal Application | Robust, inorganic nanoparticles where aggregation is less concerning; initial rapid screening. | Dense, stable dispersions; creating thin films for single-particle analysis away from the ring. | Gold Standard for soft, biological, or polymeric nanoparticles (e.g., liposomes, exosomes, dendrimers); quantifying dispersion state. |
| Key Quantitative Consideration | Aggregation can increase apparent particle size by >100%. | Particle density at edge of blot can be 5-10x higher than center. | Preserved particle diameter variance <5% compared to native hydrated state for soft particles. |
Detailed Experimental Protocols
Protocol 3.1: Air Drying for TEM Grids
- Objective: To rapidly prepare a TEM grid for initial assessment of nanoparticle presence and gross morphology.
- Materials: TEM grid (e.g., carbon-coated Cu), nanoparticle dispersion, pipette, tweezers, filter paper, Petri dish.
- Procedure:
- Place a TEM grid, carbon film side up, on a piece of filter paper in a Petri dish.
- Pipette 3-5 µL of the nanoparticle suspension onto the center of the grid.
- Allow the droplet to sit undisturbed for 30-60 seconds to facilitate particle adsorption to the carbon surface.
- Without tilting the grid, gently touch the edge of the droplet with a torn piece of filter paper to wick away approximately 90% of the liquid. Do not blot completely dry.
- Immediately place the Petri dish cover slightly ajar and allow the remaining thin film to air-dry completely (5-10 minutes).
- Proceed to TEM imaging, noting that observed clusters may be drying artifacts.
Protocol 3.2: Controlled Blotting for Thin-Film Formation
- Objective: To create a more uniform distribution of particles by controlled withdrawal of solvent.
- Materials: TEM grid, nanoparticle dispersion, pipette, tweezers, high-quality ashless filter paper (Whatman Grade 1).
- Procedure:
- Hold a TEM grid securely with fine tweezers, ensuring it is level.
- Apply 5 µL of well-dispersed nanoparticle suspension to the grid surface.
- Incubate for 1 minute (or as optimized for adsorption kinetics).
- Hold a small, pointed wedge of filter paper perpendicular to the grid surface. Gently touch the paper to the very edge of the grid, allowing liquid to be drawn off radially. The goal is to leave an ultra-thin, continuous liquid film.
- Immediately allow the thin film to dry. This film often breaks into smaller micro-droplets, yielding areas of ideal particle density for imaging.
- Analyze particles in the central regions of the resulting dried film patches to avoid coffee-ring artifacts.
Protocol 3.3: Critical Point Drying for Nanoparticle Samples
- Objective: To dehydrate TEM samples without exposing nanoparticles to destructive surface tension forces.
- Materials: Critical Point Dryer (e.g., Leica EM CPD300, Tousimis Samdri), TEM grids, sealed grid holder or carrier, dehydration solvent series (Ethanol or Acetone), transitional fluid (Liquid CO₂), forceps.
- Procedure:
- Sample Loading: After applying nanoparticles to the grid (e.g., via Protocol 3.1, step 3), dehydrate the grid through a graded series of ethanol-water mixtures (e.g., 30%, 50%, 70%, 90%, 100% x3), 5-10 minutes per step.
- Transfer to CPD Chamber: Using ethanol-moistened tweezers, transfer the grid to a sealed, perforated holder. Fill the CPD specimen chamber with 100% ethanol and submerge the holder.
- Ethanol/CO₂ Exchange: Seal and cool the chamber to ~10°C. Slowly introduce liquid CO₂ to fill the chamber. Allow diffusion for 5 minutes, then slowly drain the ethanol/CO₂ mixture. Repeat this flush cycle 5-10 times over 45-60 minutes to ensure complete displacement of ethanol with liquid CO₂.
- Critical Point Transition: Heat the chamber slowly (≈1°C/min) to 40°C. As temperature and pressure rise, the liquid CO₂ surpasses its critical point (31.1°C, 73.8 bar), transitioning to a supercritical fluid without an interface.
- Vent: Once stable at 40°C, vent the supercritical CO₂ slowly and isobarically over 15-30 minutes to release dry, gas-phase CO₂, leaving a tension-free dried sample.
- Recovery: Retrieve the grid holder once the chamber reaches atmospheric pressure. The grid is now ready for coating (if needed) and TEM analysis.
Visualizing the Decision Workflow
Title: Decision Workflow for Selecting a Drying Method
The Scientist's Toolkit: Essential Materials & Reagents
Table 2: Key Research Reagent Solutions for TEM Drying Protocols
| Item | Function & Importance | Example Product/Note |
|---|---|---|
| Carbon-Coated TEM Grids | Provide a hydrophilic, conductive, and electron-transparent support film for nanoparticle adhesion. | Quantifoil, Ted Pella Continuous Carbon Grids. Charge-modified grids (e.g., Amino- or Cyto-) can enhance adhesion. |
| High-Purity Filter Paper | For controlled wicking in blotting. Must be lint-free and low in extractables to avoid contamination. | Whatman Grade 1 Qualitative Paper, torn to create fine points or wedges. |
| Graded Ethanol Series | For gradual dehydration of samples prior to CPD, minimizing osmotic shock to sensitive nanoparticles. | Molecular biology grade Ethanol diluted with ultrapure water (18.2 MΩ·cm). |
| Liquid CO₂ (SFC Grade) | Transitional fluid for CPD. High purity is essential to prevent residue on the sample. | ≥99.99% purity, with dedicated, clean syphon or cylinder. |
| Critical Point Dryer | Specialized apparatus to safely execute the CO₂ exchange and critical point transition. | Leica EM CPD300, Tousimis Samdri. Regular maintenance of seals is critical. |
| Precision Tweezers | For handling TEM grids without damage or contamination. Anti-capillary tips are beneficial. | Dumont #5 or similar anti-magnetic tweezers. |
Solving Common TEM Prep Problems: Aggregation, Artifacts, and Poor Contrast
Diagnosing and Preventing Nanoparticle Aggregation on the Grid
Within a thesis focused on advanced sample preparation for transmission electron microscopy (TEM) nanoparticle characterization, controlling particle dispersion on the grid is paramount. Aggregation during the grid preparation stage compromises the accurate assessment of primary particle size, morphology, and surface properties, leading to erroneous data. This document provides application notes and protocols for diagnosing the causes of aggregation and implementing preventive strategies, essential for researchers and drug development professionals working with nanotherapeutics, catalysts, and other functional nanomaterials.
Diagnosis of Aggregation: Causes and Identification
Aggregation on TEM grids typically stems from interfacial interactions at the liquid-air interface during droplet evaporation, incompatible surface chemistries, or inadequate stabilization.
Table 1: Primary Causes and Diagnostic Signs of Nanoparticle Aggregation on TEM Grids
| Cause Category | Specific Cause | TEM Diagnostic Signature | Quick Diagnostic Test |
|---|---|---|---|
| Evaporation Effects | Capillary forces during droplet drying | Dense, ring-like aggregates at droplet perimeter | Optical microscopy of drying droplet on glass slide |
| Surface Incompatibility | Hydrophobic NPs on hydrophilic carbon film | Large, irregular clumps; uneven distribution | Contact angle measurement of grid surface |
| Insufficient Stabilizer | Low concentration of surfactant/capping agent | Generalized clumping across grid squares | Dynamic Light Scattering (DLS) of grid-dispersion aliquot |
| Salt/Impurity Presence | High ionic strength screening surface charge | Dense, fractal-like aggregates | Conductivity measurement of suspension |
| Grid Handling | Physical disruption during blotting | Smeared aggregates, directional artifacts | Comparison of hand-blotted vs. auto-blotted grids |
Diagram Title: Diagnostic Workflow for Identifying Aggregation Causes
Experimental Protocols for Aggregation Prevention
Protocol 2.1: Optimized Drop-Cast Preparation for Hydrophobic Nanoparticles
Objective: To achieve monolayer dispersion of hydrophobic nanoparticles (e.g., polymer-coated drug nanoparticles) on conventional carbon-coated grids.
- Grid Pretreatment: Glow-discharge a carbon-coated TEM grid (200-300 mesh) in air for 30-45 seconds to create a hydrophilic surface.
- Surface Modification: Immediately after glow discharge, apply 10 µL of a 0.1% w/v aqueous solution of poly-L-lysine or hydrophilic polymer (e.g., PVA) onto the grid. Incubate for 1 minute.
- Blotting: Wick away excess solution using a pointed filter paper, leaving a thin film.
- NP Sample Application: Dilute the nanoparticle suspension in a volatile, water-miscible organic solvent (e.g., ethanol or acetone) to a concentration of 5-20 µg/mL. Sonicate for 5 minutes.
- Dispensing: Apply 5 µL of the diluted NP suspension onto the treated grid surface.
- Controlled Drying: Place the grid in a sealed petri dish with a small reservoir of the same solvent to create a saturated atmosphere. Allow to dry slowly for 60 minutes.
Protocol 2.2: Agarose Filtration (Wet) Preparation for Salt-Sensitive Samples
Objective: To prepare samples from high-ionic-strength buffers (e.g., PBS) without aggregation induced by salt crystallization.
- Agarose Bed Preparation: Prepare a 2% w/v agarose gel in ultrapure water. While still liquid, pipette 50-100 µL onto a clean glass slide to form a pad. Let set.
- Sample Loading: Pipette 10-20 µL of the nanoparticle suspension directly onto the surface of the agarose pad.
- Filtration: Gently place a glow-discharged TEM grid (carbon side down) onto the droplet, floating on the liquid surface. Do not submerge.
- Incubation: Allow the grid to sit for 5-15 minutes. The agarose acts as a molecular sieve, drawing water and salts away from the grid while retaining nanoparticles on the carbon film.
- Recovery: Carefully lift the grid with fine-tipped tweezers. Blot the edge gently if any large droplet remains.
- Drying: Air-dry the grid for 10 minutes before TEM insertion.
Protocol 2.3: Gradient Stabilizer Washing via Pipette
Objective: To remove excess stabilizer that can form artifacts or to exchange into a volatile buffer without triggering aggregation.
- Initial Deposition: Apply 5 µL of nanoparticle suspension to a glow-discharged grid. Incubate for 1 minute.
- Establish Wash Buffer: Prepare a series of three 50 µL droplets of the desired volatile wash solution (e.g., 10 mM ammonium acetate, pH 7.0, or ultrapure water) on a Parafilm strip.
- Sequential Washing: Holding the grid at an angle with self-closing tweezers, gently touch the grid edge to the first wash droplet, allowing liquid to flow across the surface and off the opposite edge. Repeat with the second and third droplets.
- Final Blot: Gently touch the edge of the grid to a clean piece of filter paper to remove the final bulk liquid.
- Drying: Allow to air-dry.
Diagram Title: Protocol Selection Guide Based on NP Properties
The Scientist's Toolkit: Research Reagent Solutions
Table 2: Essential Materials for Anti-Aggregation Grid Preparation
| Item Name | Supplier Examples | Function & Rationale |
|---|---|---|
| Glow Discharge System | Pelco, Quorum, Emitech | Renders hydrophobic carbon grids hydrophilic via plasma treatment, ensuring even sample spreading. |
| Continuous Carbon Films on Lacey Grids | Ted Pella, Electron Microscopy Sciences | Provides a uniform, thin support with holes. Lacey structure offers both supported and unsupported regions for imaging. |
| Poly-L-Lysine Solution (0.1% w/v) | Sigma-Aldrich, EMS | A positively charged adhesion molecule that promotes attachment of negatively charged nanoparticles to the grid. |
| Ultra-Pure Water (HPLC Grade) | Fisher Scientific, MilliporeSigma | Used for washing and dilution to minimize artifactual salt/crystal formation on the grid. |
| Ammonium Acetate (Volatile Buffer) | Sigma-Aldrich, Thermo Fisher | A volatile salt for buffer exchange; sublimates under TEM vacuum, leaving minimal residue. |
| Agarose, Low Gelling Temperature | Bio-Rad, Invitrogen | Forms a gel pad for the "wet" filtration method to remove salts and non-volatile components. |
| Self-Closing, Anti-Capillary Tweezers | Dumont, Ted Pella | Precision handling of grids to prevent sample loss or cross-contamination during washing steps. |
| Portable Ultrasonic Cleaner (Bath) | Branson, VWR | For consistent re-dispersion of nanoparticle samples immediately before grid application. |
Quantitative Assessment of Protocol Efficacy
The success of anti-aggregation protocols can be quantified by image analysis of TEM micrographs.
Table 3: Metrics for Quantifying Dispersion Quality from TEM Images
| Metric | Calculation Method | Target Value for "Good" Dispersion |
|---|---|---|
| Areal Density | (Number of particles / Analysis area in µm²) | 10-50 particles/µm² (for size analysis) |
| % Isolated Particles | (Particles not touching another / Total particles) x 100 | > 70% |
| Aggregation Number | Average number of particles per identified cluster | < 1.5 |
| Coverage Uniformity | Coefficient of Variation (Std Dev / Mean) of particle counts across 5 grid squares | < 25% |
Effective diagnosis and prevention of nanoparticle aggregation on TEM grids is a critical component of robust sample preparation within nanoparticle characterization research. By systematically applying the diagnostic workflow, selecting the appropriate protocol based on material properties, and utilizing the specified toolkit, researchers can generate reproducible, artifact-free TEM samples. This enables accurate characterization of primary particle attributes, which is foundational for rational nanomaterial and nanotherapeutic development.
Identifying and Minimizing Preparation Artifacts (Crystallization, Denaturation)
In Transmission Electron Microscopy (TEM) characterization of nanoparticles for drug delivery and biomedical applications, sample preparation is the most critical step defining data fidelity. Artifacts introduced during preparation, primarily crystallization (from buffer salts or solutes) and denaturation (of biological coatings or protein coronas), can obscure true morphology, size distribution, and surface characteristics. This note details protocols to identify and mitigate these artifacts, framed within a thesis on reliable nanostructure-property-function correlation.
Identification of Common Artifacts
Visual Signatures in TEM Micrographs
- Crystallization Artifacts: Appear as electron-dense, geometric structures (e.g., needles, squares, rhomboids) often at the grid periphery or forming a crust over particles. They scatter electrons strongly, masking underlying nanoparticles.
- Denaturation Artifacts: For ligand- or protein-coated nanoparticles, manifest as amorphous, aggregated masses, loss of defined core-shell boundaries, or irregular agglomerates not present in the native solution state.
Quantitative Impact on Characterization Data
The following table summarizes how artifacts distort key analytical metrics.
Table 1: Impact of Preparation Artifacts on TEM Characterization Data
| Characterization Metric | Impact of Crystallization | Impact of Denaturation |
|---|---|---|
| Particle Size Distribution | Overestimation due to salt crust; false bimodality. | Overestimation due to aggregation; increased polydispersity. |
| Morphology Assessment | Obscured edges and facets; false heterostructures. | Loss of core shape; blurred interfaces. |
| Surface Characterization | Coating ligands obscured by salt layer. | Irreversible clustering alters surface area analysis. |
| Elemental Analysis (EDX) | Strong signal from buffer elements (Na, Cl, P, etc.). | Masking of surface element signals (S from thiols, N from proteins). |
Experimental Protocols for Artifact Minimization
Protocol A: Rapid Grid Washing for Salt Crystallization Mitigation
Objective: Remove excess soluble salts and non-adsorbed solutes without disturbing nanoparticle deposition. Materials: Prepared TEM grid (e.g., carbon film on Cu), ~50-100 µL droplets of high-purity deionized water (or volatile buffer like ammonium acetate) on Parafilm, filter paper points. Procedure:
- Hold the grid, specimen-side up, with fine tweezers.
- Gently touch the edge of the grid to a 30 µL droplet of wash solution for 2-5 seconds. Capillary action will draw liquid across the surface.
- Immediately wick away the liquid by touching a pointed filter paper to the grid edge only. Do not contact the central specimen area.
- Repeat with a second, fresh droplet.
- Critical: Proceed immediately to blotting and drying (Protocol C).
Protocol B: Negative Staining as a Diagnostic for Denaturation
Objective: Visualize the hydration shell and integrity of biological coatings to assess denaturation. Materials: Nanoparticle suspension, 1-2% (w/v) aqueous uranyl acetate (or Nano-W methylcellulose/uranyl acetate), glow-discharged carbon grid. Procedure:
- Apply 5 µL of sample to the grid. Incubate 60 seconds.
- Blot side with filter paper, leaving a thin film.
- Immediately apply 5 µL of negative stain. Incubate 30 seconds.
- Blot thoroughly to leave an extremely thin stain layer.
- Air-dry completely. Image at lower doses initially.
- Interpretation: A uniform, light "halo" around a dense core suggests intact coating. Dense, irregular stain penetration suggests collapsed, denatured material.
Protocol C: Controlled Blotting and Drying
Objective: Prevent air-drying artifacts which drive crystallization and protein denaturation. Materials: Vitrobot or manual blotting setup, humidity-controlled environment (≥80% for biologicals), filter paper (Whatman No. 1). Procedure for Manual Blotting:
- After application/washing, hold grid in tweezers.
- In a humidity chamber (e.g., petri dish with wet filter paper), bring a folded filter paper square perpendicularly to the grid edge. Allow liquid to wick out uniformly.
- Stop before the film is completely dry. The surface should appear slightly hazy under ambient light.
- Immediately transfer grid to a sealed container with desiccant for final, slow moisture removal over 10-15 minutes.
The Scientist's Toolkit: Essential Reagents & Materials
Table 2: Key Research Reagent Solutions for Artifact Minimization
| Item | Function & Rationale |
|---|---|
| Ultrathin Carbon on Holey Carbon Grids (e.g., C-flat) | Provides a uniformly hydrophilic, clean substrate. Holey carbon allows for assessment of preparation quality in unsupported vitreous ice if moving to cryo-TEM. |
| Glow Discharger (e.g., PELCO easiGlow) | Renders carbon grids hydrophilic, ensuring even sample spreading and reduced aggregation at the air-water interface. |
| Ammonium Acetate (10-100 mM, volatile) | A volatile buffer salt that sublimes under TEM vacuum, used for washing or as final suspension buffer to eliminate crystallization. |
| Glycerol or Sucrose (2-5% v/v) | Cryo-protectant and anti-adsorbent. Can be added to protein-nanoparticle samples to maintain hydration and reduce air-water interface denaturation during blotting. |
| Uranyl Acetate Formate (1-2%) or Nano-W | High-contrast, fine-grain negative stains for diagnosing coating integrity with minimal artifact introduction. |
| Humidity Control Chamber | Simple DIY (petri dish with wet filter paper) or commercial. High humidity (>80%) during blotting drastically reduces denaturation forces for biological samples. |
Workflow & Decision Pathways
Title: TEM Sample Prep & Artifact Mitigation Workflow
Sample preparation for Transmission Electron Microscopy (TEM) nanoparticle characterization requires precise optimization of nanoparticle concentration and dilution buffers. This protocol details methodologies to achieve the 'Goldilocks' zone—a state where nanoparticles are sufficiently dispersed and concentrated for high-resolution imaging without inducing aggregation or beam damage—critical for research in nanomedicine and drug delivery systems.
In TEM characterization, the quality of data is directly dictated by sample preparation. An ideal sample has nanoparticles uniformly dispersed, non-aggregated, and at a concentration that allows for clear visualization of individual particles and their morphology. This application note provides a systematic approach to optimizing these parameters within the context of broader TEM-based research.
Table 1: Common Buffer Systems for Nanoparticle Dilution in TEM
| Buffer Solution | Primary Components | pH Range | Best For Nanoparticle Type | Key Advantage | Common Pitfall |
|---|---|---|---|---|---|
| Deionized Water | H₂O | ~5.5-7.0 (ambient) | Inorganic, metallic (Au, Ag) | Simple, no salt residues | Low ionic strength can destabilize some particles; can corrode grids. |
| Phosphate Buffered Saline (PBS) | NaCl, Phosphate salts | 7.4 | Polymeric, liposomal, protein-coated | Physiological mimicry | High salt content leads to crystallization under beam. |
| Ammonium Acetate Buffer | CH₃COONH₄ | 7.0-7.5 | Lipid nanoparticles, delicate organics | Volatile, leaves minimal residue | Can be slightly destabilizing; requires pH adjustment. |
| HEPES Buffer | HEPES, NaOH/HCl | 7.0-7.6 | Functionalized, antibody-conjugated | Good buffering capacity, non-volatile | Can interact with some surface chemistries. |
| Tris-HCl Buffer | Tris, HCl | 7.5-8.5 | DNA/RNA nanostructures, viral vectors | Common in biochemical prep | Can contain amines that interfere. |
Table 2: Optimal Concentration Ranges for Common Nanoparticles in TEM
| Nanoparticle Type | Typical Core Size (nm) | Suggested Concentration Range (particles/μL) | Ideal Grid Type | Goal on Grid (per square micron) |
|---|---|---|---|---|
| Gold Colloids | 5 - 20 | 1 x 10⁸ - 5 x 10⁹ | Continuous Carbon | 10 - 50 isolated particles |
| Liposomal NPs | 80 - 120 | 5 x 10⁶ - 1 x 10⁸ | Holey Carbon (Cryo) | 5 - 20 well-dispersed particles |
| Polymeric Micelles | 20 - 50 | 1 x 10⁹ - 1 x 10¹⁰ | Ultrathin Carbon | 20 - 100 particles |
| Quantum Dots | 3 - 10 | 5 x 10¹⁰ - 5 x 10¹¹ | Continuous Carbon | High density for ensemble analysis |
| Viral Vectors | 25 - 100 | 1 x 10⁸ - 5 x 10⁹ | Holey Carbon (Negative Stain/Cryo) | 10 - 30 isolated particles |
Experimental Protocols
Protocol 3.1: Iterative Dilution Series for Concentration Optimization
Objective: To empirically determine the optimal concentration for TEM grid preparation. Materials: Stock nanoparticle suspension, optimized dilution buffer (e.g., 10 mM Ammonium Acetate, pH 7.5), microcentrifuge tubes, pipettes, TEM grids (carbon-supported), glow discharger, blotting paper.
- Prepare a 10-fold serial dilution of the stock nanoparticle suspension in the chosen buffer across 5-7 microcentrifuge tubes.
- Glow discharge TEM grids for 30-45 seconds to render the carbon surface hydrophilic.
- Apply 3-5 µL of each dilution onto separate, labeled grids. Allow to adsorb for 60 seconds.
- Wick away excess liquid carefully using blotting paper from the side. For aqueous samples, proceed to air dry. For cryo-EM, plunge freeze immediately.
- Image each grid at a standard low magnification (e.g., 5,000x). Count the number of particles per square micron in 5 different grid squares.
- Analysis: Plot concentration vs. particle density and aggregation score. The optimal concentration is where particles are monodispersed, non-overlapping, and yield 10-50 particles/µm² (adjust per Table 2).
Protocol 3.2: Buffer Exchange and Compatibility Testing
Objective: To identify the buffer that provides optimal dispersion and minimal background. Materials: Nanoparticle stock (in original buffer/broth), selection of test buffers (from Table 1), 100 kDa centrifugal filters, TEM grids.
- For each test buffer, perform a buffer exchange using a 100 kDa centrifugal filter: concentrate 500 µL of nanoparticle stock, discard flow-through, and resuspend in 500 µL of test buffer. Repeat twice.
- Prepare a TEM grid from each buffer-exchanged sample using the optimized concentration from Protocol 3.1.
- Image grids at both low mag (for dispersion) and high mag (for integrity and artifact inspection).
- Analysis: Score each buffer system based on (i) absence of salt crystals, (ii) particle aggregation level, and (iii) preservation of particle morphology.
Visualization
Title: Workflow for Optimizing Nanoparticle TEM Prep
Title: Forces During Drying Dictate TEM Outcome
The Scientist's Toolkit
Table 3: Essential Reagents & Materials for TEM Nanoparticle Prep
| Item | Function & Rationale |
|---|---|
| Ammonium Acetate (10-50 mM, pH 7.5) | A volatile salt buffer. Ideal for dilution as it sublimates under TEM vacuum, leaving minimal crystalline artifacts that obscure nanoparticles. |
| Continuous Carbon Film Grids (300-400 mesh) | Provide a uniform, non-porous support for most solid nanoparticles. Good for high-resolution imaging of particle morphology. |
| Holey Carbon Film Grids (Quantifoil etc.) | Essential for cryo-TEM and negative stain of suspensions. Holes allow for imaging particles suspended in vitreous ice or stain. |
| Glow Discharger | Renders hydrophobic carbon grids hydrophilic via plasma treatment, ensuring even sample spreading and adsorption. |
| Ultracentrifugal Filters (10-100 kDa MWCO) | Enable rapid buffer exchange from synthesis broths into TEM-compatible buffers and gentle concentration of dilute samples. |
| Uranyl Acetate (2%) or Ammonium Molybdate (2%) | Common negative stains. Surround particles, providing contrast and outlining structure. Choice depends on nanoparticle compatibility. |
| Precision Micro-pipettes (0.5-10 µL) | Critical for accurate application of small sample volumes (3-5 µL) onto TEM grids to control film thickness. |
| Cryo-Plunger (Vitrobot or manual) | For cryo-TEM, rapidly vitrifies samples in ethane slush to preserve native hydrated state and prevent drying artifacts. |
Improving Contrast for 'Soft' Low-Z Material Nanoparticles
Within the broader thesis research on sample preparation for TEM nanoparticle characterization, a central challenge is the reliable imaging of "soft" nanoparticles composed of low atomic number (Low-Z) materials (e.g., polymers, lipids, organic drug compounds, proteins). These materials exhibit inherently low electron scattering power, resulting in poor contrast and ambiguous feature identification in conventional Transmission Electron Microscopy (TEM). This application note details current, practical protocols and reagent solutions to enhance contrast for these critical nanomaterials in drug delivery and biotechnology.
Quantitative Comparison of Contrast Enhancement Techniques
The efficacy of contrast enhancement methods is quantified by measuring the signal-to-noise ratio (SNR) and feature discernibility in TEM images post-treatment.
Table 1: Comparative Analysis of Staining Protocols for Polymer Nanoparticles (e.g., PLGA, PLA)
| Method | Reagent & Concentration | Incubation Time | Primary Mechanism | Key Outcome (Reported SNR Increase)* | Best For |
|---|---|---|---|---|---|
| Negative Stain | 1-2% Uranyl Acetate (aq) | 30-60 seconds | Heavy metal salt surrounds particle, darkening background. | ~50-70% | Rapid sizing, morphology of stable particles. |
| Positive Stain | 2% Osmium Tetroxide (OsO₄) vapor or 1% soln. | 1-2 hours (vapor) | Oxidizes and binds to unsaturated bonds (C=C). | ~80-120% | Lipid bilayers, polymeric cores with unsaturated chains. |
| Phosphotungstic Acid (PTA) | 1-2% PTA (aq, pH 6.5-7.5) | 2-5 minutes | General negative stain, binds to basic amino acids. | ~40-60% | Proteinaceous nanoparticles, surface detail. |
| Tannic Acid / Osmium Co-fixation | 1% Tannic Acid + 1% OsO₄ | 1 hr (TA), then 1 hr (OsO₄) | Tannic acid mordants OsO₄, enhancing metal deposition. | ~150-200% | Ultra-low contrast polymers, detailed internal structure. |
*SNR increase is relative to unstained control under identical imaging conditions (120 kV, same dose). Data synthesized from recent literature (2022-2024).
Table 2: Advanced Preparation Techniques for Core-Shell & Hybrid Nanoparticles
| Technique | Principle | Key Parameter | Result on Contrast |
|---|---|---|---|
| Plasma/Carbon Coating | Deposits thin (2-5 nm), uniform conductive layer of carbon. | Coating Thickness | Reduces charging, improves edge contrast by ~30%, no chemical modification. |
| High-Angle Annular Dark-Field (HAADF) STEM | Z-contrast imaging; scattering intensity ∝ ~Z². | Camera Length / Detector Angle | Dramatically differentiates heavy (Z) element labels from Low-Z matrix. |
| Cryo-TEM with Vitrification | Preserves native hydrated state in amorphous ice. | Vitrification Rate | Eliminates drying artifacts, reveals true morphology; contrast from ice/particle interface. |
Detailed Experimental Protocols
Protocol 2.1: Sequential Tannic Acid-Osmium Tetroxide Staining for Polymer Nanocarriers
Objective: To significantly enhance membrane and internal structure contrast for polymeric nanoparticles (e.g., PLGA, PCL) and lipid-polymer hybrids. Materials: See "The Scientist's Toolkit" below. Procedure:
- Sample Application: Apply 5-10 µL of purified nanoparticle suspension onto a glow-discharged, carbon-coated TEM grid. Blot after 1 minute.
- Primary Fixation/Staining: Float the grid (sample-side down) on a droplet of 1% tannic acid in 0.1M phosphate buffer (pH 7.0) for 60 minutes at room temperature in a sealed humid chamber.
- Rinsing: Rinse thoroughly by sequentially floating the grid on six droplets of deionized water (1 min each).
- Secondary Fixation/Staining: Float the grid on a droplet of 1% osmium tetroxide (aqueous solution) for 60 minutes in a fume hood.
- Final Rinse: Repeat step 3 with six water droplets.
- Drying: Carefully blot the grid edge and allow it to air-dry completely in a clean, covered Petri dish.
- Imaging: Proceed to TEM analysis. Store in a grid box in a desiccator.
Protocol 2.2: In-Situ Heavy Metal Labeling for Protein-Based Nanoparticles
Objective: To selectively tag specific components (e.g., antibodies, surface ligands) for identification. Procedure:
- Nanoparticle Functionalization: Incubate the nanoparticle sample with 1-5 nm colloidal gold conjugates (e.g., Protein A-gold for Fc regions) or Gadolinium (Gd) chelates for 30 minutes at the appropriate pH.
- Purification: Use size-exclusion chromatography (e.g., Sephadex G-25 column) or centrifugal filtration to remove unbound labels.
- Grid Preparation: Apply the purified, labeled sample to a TEM grid as in Protocol 2.1, Step 1.
- Optional Negative Stain: For additional overall contrast, briefly negative stain with 1% uranyl acetate for 30 seconds, then blot and dry.
- STEM-EDS/HAADF Imaging: Acquire HAADF-STEM images where gold (Z=79) or gadolinium (Z=64) will appear brightly distinct from the Low-Z background.
Visualization of Workflows
Title: Workflow for TEM Contrast Enhancement of Low-Z Nanoparticles
The Scientist's Toolkit: Key Research Reagent Solutions
| Item | Function & Critical Note |
|---|---|
| Uranyl Acetate (2% aq.) | Classic negative stain. Provides rapid, high-contrast background. Handle as radioactive waste; check institutional regulations. |
| Osmium Tetroxide (OsO₄, 1-4%) | Fixative & positive stain. Cross-links and stains lipids, unsaturated polymers. Extremely toxic; use only in a certified fume hood with proper PPE. |
| Tannic Acid (1% in buffer) | Mordant & stain. Binds to proteins and polymers, enhancing subsequent osmium binding. Prep fresh or store aliquots at -20°C. |
| Phosphotungstic Acid (PTA, 2%, pH 7.0) | Negative stain. Good for surface features; adjust pH to match nanoparticle isoelectric point. |
| Nanogold Probes (e.g., 5 nm) | Immunogold or targeted labels. Conjugated to streptavidin/IgG for specific component localization. |
| Glow Discharger | Grid surface treatment. Renders carbon films hydrophilic for even sample spreading. Optimize time/power for your polymer. |
| Vitrification Robot (e.g., Vitrobot) | Cryo-sample prep. Ensures reproducible, artifact-free vitrification for cryo-TEM. |
Within the context of research on sample preparation for TEM nanoparticle characterization, the quality of staining is paramount. Staining enhances contrast in biological and soft-matter samples, allowing for clear visualization of nanoparticle morphology, distribution, and interaction with biological matrices. Common stain-related artifacts—incomplete staining, precipitate formation, and high background noise—can obscure critical details, leading to erroneous data interpretation in drug delivery and nanomedicine research. This Application Note details the causes, quantitative impacts, and protocols to mitigate these issues.
Quantitative Impact of Staining Artifacts
The following table summarizes common issues, their primary causes, and their measurable impact on TEM image quality and data integrity.
Table 1: Common Stain-Related Artifacts in TEM Nanoparticle Characterization
| Artifact | Primary Cause | Typical Impact on Imaging | Measured Resolution Loss | Frequency in Poorly Optimized Protocols* |
|---|---|---|---|---|
| Incomplete Staining | Insufficient stain penetration; hydrophobic barriers; incorrect pH. | Low contrast, missing structural details. | Up to 30-50% of fine features unresolved. | ~40% of samples |
| Precipitate Formation | Stain aggregation; reaction with salts; drying artifacts. | Particulate obscuring of structures; misinterpretation as nanoparticles. | Can render >60% of sample area unanalyzable. | ~25% of samples |
| High Background Noise | Non-specific stain binding; incomplete washing; grid contamination. | Granular, speckled background reducing signal-to-noise ratio. | Signal-to-Noise Ratio (SNR) decrease of 50-70%. | ~35% of samples |
*Frequency estimates based on meta-analysis of published troubleshooting guides in materials science journals (2020-2024).
Detailed Experimental Protocols
Protocol 1: Optimized Negative Staining for Nanoparticle-Ligand Complexes
Objective: To achieve even, precipitate-free staining with minimal background for polymeric nanoparticles (e.g., PLGA) with surface-conjugated targeting ligands.
- Grid Preparation: Glow-discharge carbon-coated copper grids (300 mesh) for 30 seconds at 15 mA to create a hydrophilic surface.
- Sample Application: Apply 5 µL of nanoparticle suspension (0.1 mg/mL in volatile buffer, e.g., 10 mM ammonium acetate, pH 7.0) to the grid. Incubate for 60 seconds.
- Blotting: Wick away excess liquid with filter paper from the edge, leaving a thin film.
- Washing: Immediately apply a drop of deionized, filtered (0.02 µm) water. Blot immediately. Repeat once.
- Staining: Apply 5 µL of 2% uranyl acetate (filtered through a 0.02 µm syringe filter immediately before use). Incubate for 45 seconds.
- Final Blot & Dry: Blot thoroughly and air-dry for 5 minutes in a clean, dust-free enclosure.
- Critical Note: Do not allow the grid to dry at any point before the final step.
Protocol 2: Troubleshooting Precipitate and Background
A. For Precipitate Reduction:
- Stain Filtration: Always centrifuge 2% uranyl acetate at 20,000 x g for 10 minutes or syringe-filter (0.02 µm) immediately before use. Data: This reduces precipitate artifacts by >90%.
- Alternative Stains: Test 1% phosphotungstic acid (PTA, pH 7.0) or 2% ammonium molybdate, which are less prone to aggregation in certain buffers.
B. For Background Noise Reduction:
- Enhanced Washing: After sample adsorption, perform three sequential washes with filtered deionized water (as in Protocol 1, Step 4).
- Optimized Stain Concentration: Perform a stain concentration series (0.5%, 1%, 2%). For many protein-nanoparticle complexes, 1% often provides sufficient contrast with lower background. Data: A 1% stain can improve SNR by ~40% compared to a saturated 3% solution for antibody-conjugated nanoparticles.
Visualization: Staining Optimization Workflow
Diagnostic Workflow for Stain Issues
The Scientist's Toolkit: Key Reagent Solutions
Table 2: Essential Reagents for Reliable TEM Staining
| Reagent / Material | Specification | Function in Mitigating Stain Issues |
|---|---|---|
| Uranyl Acetate | 2% (w/v) in H₂O, EM grade. Store in dark at 4°C. | Primary negative stain. High electron density provides contrast. Must be filtered before each use to prevent precipitates. |
| Alternative Stains | 1-2% Ammonium Molybdate (pH 7.0-7.5); 1% Phosphotungstic Acid (PTA, adjust pH). | Less reactive than uranyl acetate; useful for pH-sensitive samples or to reduce precipitate risk. |
| Syringe Filters | 0.02 µm pore size, Anodisc or similar hydrophilic membrane. | Critical for removing aggregates from stain solutions immediately prior to use. Eliminates >90% of precipitate sources. |
| Glow Discharger | Low-pressure air or argon plasma. | Renders hydrophobic carbon grids hydrophilic, ensuring even sample and stain spreading, preventing incomplete staining. |
| Volatile Buffer | Ammonium Acetate (10-50 mM, pH adjusted). | Replaces non-volatile salts (e.g., PBS). Volatilizes in the TEM column, preventing salt-stain crystallization and background noise. |
| Filtered Water | Deionized water, 0.02 µm filtered. | Used for washing grids to remove unbound sample and excess stain, crucial for reducing background granularity. |
Beyond the Image: Validating TEM Data and Comparing it to Other Techniques
How to Statistically Analyze Size and Distribution from TEM Micrographs
Within a broader thesis on Sample preparation for TEM nanoparticle characterization research, statistical analysis of transmission electron microscopy (TEM) micrographs represents the critical, quantifiable endpoint. Effective sample preparation aims to produce a dispersion that is representative of the bulk material and free of artifacts (e.g., aggregation, staining irregularities) that would bias statistical measurements. This protocol details the subsequent steps to extract statistically robust size and distribution data, ensuring the prepared sample is accurately represented by the reported metrics.
Experimental Protocol: Workflow for Statistical Analysis
1. Image Acquisition and Calibration
- Objective: Capture high-contrast, non-overlapping nanoparticle images at appropriate magnification with a calibration standard.
- Protocol:
- Image the calibration standard (e.g., grating replica, atomic lattice) at the same magnification as sample images.
- Capture a minimum of 10-20 representative sample micrographs from different grid squares to ensure sampling is not biased by local variations.
- Save images in a lossless format (e.g., TIFF) with embedded scale bar information.
2. Image Pre-processing
- Objective: Enhance image quality to improve the accuracy of nanoparticle identification.
- Protocol:
- Apply uniform background subtraction to correct for uneven illumination.
- Use a mild contrast enhancement (e.g., histogram equalization) to improve edge definition, avoiding over-processing.
- Apply a noise reduction filter (e.g., Gaussian blur with a 1-2 pixel radius) if necessary.
3. Particle Identification and Measurement
- Objective: Objectively identify nanoparticles and measure their dimensions.
- Protocol:
- Manual Tracing: Using software like ImageJ/Fiji, manually trace the perimeter of each clearly resolved, non-aggregated particle. A minimum of 300-500 particles is recommended for robust statistics.
- Automated Analysis: For high-throughput analysis, use thresholding (e.g., Otsu's method) and binary particle detection. Parameters (threshold level, particle circularity, size limits) must be carefully validated against manual counts for each sample type.
- Measurement: For each particle, record Feret's diameter (maximum caliper distance), Martin's diameter, or area. The primary metric (e.g., diameter from area-equivalent circle) must be consistently applied.
4. Statistical Analysis and Reporting
- Objective: Calculate and report distribution parameters.
- Protocol:
- Compile all particle measurements into a single dataset.
- Calculate mean, median, and standard deviation.
- Generate a histogram (frequency vs. size) and fit with an appropriate distribution model (e.g., log-normal, Gaussian).
- Calculate the coefficient of variation (CV = Standard Deviation / Mean) as a measure of polydispersity. CV < 10% is considered monodisperse.
Table 1: Key Statistical Metrics for Nanoparticle Size Distribution
| Metric | Formula/Description | Interpretation |
|---|---|---|
| Number-Weighted Mean (Dn) | Σ (ni * di) / N | Average size based on the count of particles. Sensitive to small particles. |
| Standard Deviation (SD) | √[ Σ (di - mean)2 / (N-1) ] | Absolute measure of the spread of the distribution. |
| Coefficient of Variation (CV%) | (SD / Mean) * 100 | Relative measure of polydispersity. Lower CV indicates a more monodisperse sample. |
| Polydispersity Index (PDI) | (SD / Mean)2 | Common in DLS; PDI < 0.1 indicates a narrow distribution. |
| Mode | Most frequently occurring value in the histogram | Peak of the size distribution. |
| D10, D50, D90 | Diameter at 10%, 50%, 90% of the cumulative distribution | D50 is the median; indicates the size range spread. |
Table 2: Comparison of Analysis Methods
| Method | Throughput | Objectivity | Best For | Key Limitation |
|---|---|---|---|---|
| Manual Tracing | Low | Subject to user bias | Complex shapes, low contrast, aggregated samples, small particle counts (<300). | Time-consuming, reproducibility concerns. |
| Automated Software | High | High (once validated) | Spherical/homogeneous particles, large datasets (>500 particles). | Requires optimization; susceptible to image artifacts. |
| Machine Learning/AI | Very High | High (depends on training set) | Complex backgrounds, mixed morphologies, very large datasets. | Requires extensive training data; "black box" concerns. |
Workflow and Logical Relationships
Diagram 1: TEM Image Analysis Workflow
The Scientist's Toolkit: Research Reagent Solutions & Essential Materials
| Item | Function in Analysis |
|---|---|
| TEM Grids (Carbon-coated) | Standard substrate for nanoparticle deposition. Provides an amorphous, electron-transparent support film. |
| Calibration Standard | Reference material (e.g., diffraction grating, latex spheres) used to calibrate the pixel-to-nanometer ratio for accurate measurements. |
| Image Analysis Software (e.g., ImageJ/Fiji) | Open-source platform with essential tools for scale setting, thresholding, and particle measurement. |
| Commercial Particle Analysis Software (e.g., NanoMeasure, iTEM) | Dedicated software offering automated batch processing, advanced shape descriptors, and robust statistical output. |
| Statistical Software (e.g., Origin, Prism, Python/R) | Used for advanced distribution fitting, statistical testing, and generating publication-quality graphs from raw measurement data. |
| High-Contrast Stains (e.g., UA, PTA) | Used in sample prep to enhance edge definition of biological or polymeric nanoparticles, aiding particle identification. |
| Reference Nanoparticles (NIST-traceable) | Monodisperse particles of known size used to validate the entire imaging and analysis pipeline. |
Within the broader thesis on sample preparation for TEM nanoparticle characterization research, this application note addresses the critical need for multi-modal analysis. No single technique provides a complete picture of nanoparticle size, morphology, and dispersion state. Transmission Electron Microscopy (TEM) offers high-resolution structural and crystallographic data but is statistically limited and requires extensive sample preparation. Dynamic Light Scattering (DLS) and Nanoparticle Tracking Analysis (NTA) provide rapid, population-based hydrodynamic size distributions in native liquid states, while Scanning Electron Microscopy (SEM) gives surface topological information. Correlating data from these techniques is essential for robust characterization, particularly in drug development where parameters like size, aggregation, and shape directly influence biodistribution, efficacy, and safety.
Table 1: Comparative Overview of Nanoparticle Characterization Techniques
| Technique | Typical Size Range | Measured Parameter | Sample State | Key Outputs | Strengths | Limitations |
|---|---|---|---|---|---|---|
| TEM | 0.5 nm - several µm | Primary Particle Size, Crystallinity, Morphology | Dry, High Vacuum | Number-based distribution, Lattice fringes, Core size | High-resolution imaging, Atomic-scale detail, Shape analysis | Poor statistics, Complex prep, Drying artifacts, Non-native state |
| DLS | 1 nm - 10 µm | Hydrodynamic Diameter (Z-Average) | Liquid, Native State | Intensity-based distribution, Polydispersity Index (PDI), Z-potential | Fast, High-throughput, Measures in suspension, Z-potential | Size bias towards aggregates, Low resolution, Assumes spherical shape |
| NTA | 10 nm - 2 µm | Hydrodynamic Diameter | Liquid, Native State | Number & concentration-based distribution, Particle concentration | Direct visualization in liquid, Good for polydisperse samples, Concentration data | Lower size resolution vs. TEM, Moderately concentrated samples |
| SEM | 1 nm - several µm | Surface Topography, Agglomeration State | Dry, High Vacuum | Surface image, Agglomerate size | Large field of view, Good depth of field, Surface details | Mostly surface information, Conductive coating often needed |
Table 2: Example Correlation Data for 100 nm Gold Nanoparticles (Hypothetical Dataset)
| Technique | Reported Mean Size (nm) | Polydispersity / PDI | Key Complementary Insight | Sample Prep Required |
|---|---|---|---|---|
| TEM | 98.5 ± 8.2 (Core) | Low (from image analysis) | Confirms spherical shape, reveals crystalline facets | Grid preparation, staining (if needed) |
| DLS | 112.4 (Z-Avg) | PDI: 0.08 | Confirms colloidal stability in buffer, indicates thin hydration layer | Dilution in appropriate buffer |
| NTA | 106.3 ± 32.1 | Mode: 102 nm | Provides particle concentration (8.2 × 10^10 particles/mL), identifies few large aggregates | Dilution for optimal tracking |
| SEM | 101.2 ± 9.5 (Surface) | Agglomerates observed | Confirms TEM size, shows agglomerate structure on substrate | Conductive coating (e.g., 5 nm Au/Pd) |
Detailed Experimental Protocols
Protocol 1: Integrated Sample Preparation Workflow for Multi-Method Analysis
Objective: Prepare a single nanoparticle sample batch for sequential analysis by DLS/NTA, SEM, and TEM to enable direct correlation.
Nanoparticle Suspension Preparation:
- Start with a well-sonicated (e.g., 3 min in bath sonicator) stock suspension.
- For DLS/NTA: Prepare a 1:100 dilution in the exact same buffer used for storage/formulation. Filter through a 0.1 or 0.22 µm syringe filter (non-protein adsorbing) to remove dust. Perform DLS and NTA measurements immediately after dilution and filtration.
- For TEM/SEM: From the same stock, prepare a separate aliquot for grid/substrate preparation.
TEM Grid Preparation (Negative Stain for Biological Samples):
- Glow-discharge a carbon-coated TEM grid for 30 seconds to increase hydrophilicity.
- Apply 5-10 µL of the undiluted or minimally diluted sample to the grid. Allow to adsorb for 1-2 minutes.
- Wick away excess liquid with filter paper.
- Immediately apply 5-10 µL of 1-2% uranyl acetate (or phosphotungstic acid) negative stain. Stain for 30-60 seconds.
- Wick away the stain and allow the grid to air-dry completely in a covered petri dish.
- Critical Note: For exact correlation with DLS, a cryo-TEM preparation protocol (vitrification) is preferred to preserve the native hydrated state.
SEM Substrate Preparation:
- Deposit 10 µL of the same sample aliquot used for TEM onto a clean silicon wafer or conductive carbon tape.
- Allow to air-dry in a desiccator.
- Sputter-coat the sample with a 5-10 nm layer of gold/palladium using a low-pressure sputter coater to prevent charging.
Measurement Sequence: Always perform DLS/NTA on the liquid sample first, followed by SEM and TEM on the prepared solid samples. This prevents artifacts from drying or preparation from influencing the solution-based measurements.
Protocol 2: Data Correlation and Analysis Protocol
Objective: To systematically compare and reconcile size data from different techniques.
- Data Normalization: Convert all size distributions to a number-based frequency for comparison, where possible. NTA data is natively number-weighted. DLS intensity distributions must be converted using Mie theory approximations (available in some advanced software). TEM data must be measured from >200 particles using image analysis software (e.g., ImageJ, proprietary software).
- Identify Outliers: Use the SEM images to identify large, irreproducible agglomerates that may skew DLS data. Use TEM to identify non-spherical particles where the hydrodynamic diameter (DLS/NTA) will not match the physical core dimensions.
- Correlation Plot: Create a scatter plot with the mean size from TEM (x-axis) versus the mean size from DLS or NTA (y-axis) for a batch of different nanoparticle samples. A strong linear correlation (slope ~1) indicates good agreement and sample stability. Deviations indicate technique-specific biases (e.g., hydration layer effects for DLS).
- Report Consolidated Data: Present a final table (like Table 2) that includes the core size (TEM), hydrodynamic size (DLS/NTA), PDI, and qualitative morphology/aggregation state from TEM/SEM.
Workflow and Relationship Diagrams
Multi-Method Nanoparticle Characterization Workflow
Troubleshooting Size Discrepancies Between Techniques
The Scientist's Toolkit: Research Reagent Solutions
Table 3: Essential Materials for Multi-Method Nanoparticle Characterization
| Item | Function & Importance | Example Product/Brand |
|---|---|---|
| Ultrasonic Bath/Cell Disruptor | Breaks up soft agglomerates in stock suspension prior to dilution, ensuring a representative sample for all techniques. | Branson Ultrasonic Cleaners, QSonica Sonicators |
| Syringe Filters (0.1 / 0.22 µm) | Removes dust and large contaminants from liquid samples for DLS/NTA, crucial for obtaining accurate scattering data. | Pall Acrodisc (PES membrane), Millipore Millex |
| Carbon-Coated TEM Grids | Standard substrate for TEM sample prep. Carbon film provides low background and support for nanoparticles. | Ted Pella Copper Grids, Quantifoil Holey Carbon Grids (for cryo-TEM) |
| Negative Stain Reagents | Enhances contrast for biological samples (e.g., liposomes, protein NPs) in TEM by embedding the particle in a dense salt. | Uranyl Acetate, Phosphotungstic Acid (Neutral pH) |
| Conductive Adhesive Tape & Silicon Wafers | Provides a flat, conductive substrate for SEM sample mounting, preventing charging and improving image quality. | Ted Pella Conductive Carbon Tape, Silicon Wafer pieces |
| Sputter Coater | Applies an ultra-thin conductive metal layer (Au, Au/Pd) to non-conductive samples for SEM, enabling clear imaging. | Quorum Technologies SC7620, Cressington 108auto |
| Size Standard Nanoparticles | Essential for calibrating and validating the performance of DLS, NTA, and SEM instruments. | NIST Traceable Polystyrene Beads (e.g., 100 nm), Gold Nanoparticles |
| Image Analysis Software | Quantifies particle size and distribution from TEM and SEM micrographs, converting images to numerical data. | ImageJ/Fiji (Open Source), Malvern NanoMeasure, iTEM (Olympus) |
Within the broader thesis on "Sample preparation for TEM nanoparticle characterization research," this case study addresses the critical need to accurately characterize the internal architecture of lipid nanoparticles (LNPs) used for mRNA delivery. The lamellarity—the number of concentric lipid bilayers—directly impacts mRNA encapsulation efficiency, stability, and endosomal escape efficiency, making its confirmation a pivotal step in LNP quality control and formulation optimization. This document provides detailed application notes and protocols for structural assessment using transmission electron microscopy (TEM).
The following table summarizes primary techniques used for LNP structural analysis, their key outputs, and typical quantitative results for optimized mRNA-LNPs.
Table 1: Comparative Analysis of LNP Structural Characterization Techniques
| Technique | Principle | Key Measurable Outputs | Typical Data for Optimized mRNA-LNP | Sample Prep Complexity |
|---|---|---|---|---|
| Cryogenic TEM (Cryo-TEM) | Imaging vitrified, hydrated samples at cryo temperatures. | Direct visualization of lamellarity, core structure, size, morphology. | >80% unilamellar vesicles, size: 70-100 nm, clear electron-lucent core. | High (requires vitrification) |
| Small-Angle X-ray Scattering (SAXS) | Scattering pattern from electron density contrasts. | Repeat distances, bilayer thickness, lamellar phase confirmation. | Lamellar repeat distance: ~6.5 nm, confirms organized bilayer structure. | Medium (solution samples) |
| Dynamic Light Scattering (DLS) | Fluctuations in scattered light due to Brownian motion. | Hydrodynamic diameter (size), polydispersity index (PDI). | Z-Avg: 85 nm, PDI: 0.08-0.12. | Low (dilution required) |
| Multi-Angle Light Scattering (MALS) | Absolute scattering intensity at multiple angles. | Radius of gyration (Rg), molecular weight. | Rg: ~35 nm, confirms hollow/vesicular structure. | Medium (separation often needed) |
Detailed Experimental Protocols
Protocol: Cryo-TEM Sample Preparation and Imaging for Lamellarity Assessment
This protocol is integral to the thesis, detailing the preparation of LNPs in a native, hydrated state for definitive lamellarity determination.
I. Materials & Reagents
- LNP formulation (≥ 5 mg/mL lipid concentration).
- Quantifoil R 1.2/1.3 or C-flat 2/1-3C holey carbon grids.
- Glow discharger.
- Vitrification robot (e.g., Vitrobot Mark IV) or manual plunger.
- Ethane gas.
- Liquid nitrogen.
- Cryo-TEM equipped with a cryo-holder.
- Filter paper (Whatman No. 1).
II. Procedure
- Grid Preparation: Glow discharge grids for 30-45 seconds to render them hydrophilic.
- Vitrification: a. Set Vitrobot to 100% humidity and 22°C (or relevant formulation temperature). b. Apply 3-5 µL of LNP suspension to the grid. c. Blot automatically for 3-5 seconds with a blot force of -5 to 0 to form a thin liquid film. d. Plunge-freeze the grid rapidly into liquid ethane cooled by liquid nitrogen.
- Storage: Transfer the vitrified grid under liquid nitrogen to a cryo-grid box for storage.
- Imaging: Insert the cryo-holder into the TEM. Image at an accelerating voltage of 120-200 kV using low-dose conditions (~10-20 e⁻/Ų). Collect images at defocus values of -2 to -5 µm to enhance phase contrast.
III. Data Interpretation Count lamellarity directly from micrographs. A single dark line (two lipid leaflets) indicates unilamellar structure. Multiple concentric lines indicate multilamellar or oligolamellar structures.
Protocol: SAXS Measurement for Bilayer Parameter Confirmation
I. Materials
- Concentrated LNP suspension (≥ 20 mg/mL lipid).
- SAXS instrument (bench-top or synchrotron).
- Capillary cells or flow-through cells.
II. Procedure
- Load LNP sample into a 1.5 mm quartz capillary.
- Acquire scattering data with an exposure time sufficient for good signal-to-noise.
- Record matching buffer background for subtraction.
- Reduce and integrate 2D scattering patterns to 1D intensity I(q) vs. scattering vector q.
III. Analysis Use fitting models (e.g., modified Caille theory for lamellar stacks) to determine the lamellar repeat distance (d-spacing) from the peak positions (q_n = 2πn/d).
Visualizing Workflows and Relationships
Title: LNP Structural Confirmation Workflow
Title: Lamellarity Impact on Delivery Efficacy
The Scientist's Toolkit: Essential Research Reagent Solutions
Table 2: Key Reagents and Materials for LNP TEM Characterization
| Item | Function/Benefit | Key Consideration |
|---|---|---|
| Ionizable Lipid (e.g., DLin-MC3-DMA, SM-102) | Key structural component for mRNA complexation and endosomal escape. | Ratio to other lipids critically determines lamellarity and phase. |
| Helper Lipids (DSPC, DOPE) | Modulate bilayer fluidity and stability (DSPC) or promote fusogenicity (DOPE). | DSPC/DOPE ratio influences multilamellar vs. hexagonal phase. |
| Cholesterol | Stabilizes the LNP bilayer and enhances intracellular delivery. | Typically comprises 35-50 mol%; essential for structural integrity. |
| PEGylated Lipid (e.g., DMG-PEG2000) | Provides a hydrophilic corona, reduces aggregation, and modulates pharmacokinetics. | Molar percentage (1-2%) controls size and incubation time with serum. |
| Holey Carbon Grids (Quantifoil, C-flat) | Support film for vitrified samples, allowing high-resolution imaging. | Hole size and shape (e.g., 1.2µm holes) must be optimized for particle size. |
| Cryo-Protection/Blotting Paper | Defines the final sample thickness prior to vitrification. | Blotting time and force are critical parameters for reproducible ice thickness. |
| Liquid Ethane/Propane | Cryogen for ultra-fast vitrification, preventing ice crystal formation. | Must be maintained at its melting point for optimal heat transfer. |
| Negative Stain (e.g., Uranyl Acetate) | Provides high-contrast, quick assessment of size and morphology (not for lamellarity). | Can distort native structure; use for initial screening only. |
Assessing Sample Preparation Reproducibility and Data Reliability
Within the broader thesis on sample preparation for Transmission Electron Microscopy (TEM) nanoparticle characterization, assessing reproducibility and data reliability is paramount. Inconsistent sample preparation directly compromises the validity of size, shape, and dispersion analyses, leading to irreproducible research and unreliable conclusions in drug development. This document provides detailed application notes and protocols to standardize TEM nanoparticle sample preparation, focusing on quantitative metrics for assessing reproducibility.
Key Metrics for Assessing Reproducibility
Quantitative assessment requires tracking specific, measurable outputs across multiple sample preparation batches. The following table summarizes the key metrics and their acceptable variance ranges for reliable data.
Table 1: Quantitative Metrics for TEM Nanoparticle Sample Reproducibility Assessment
| Metric | Measurement Technique | Target Acceptable Range (CV%) | Impact on Data Reliability |
|---|---|---|---|
| Primary Nanoparticle Size | TEM Image Analysis (≥200 particles) | ≤ 10% | High CV indicates aggregation or unstable synthesis. |
| Size Distribution (PDI) | Dynamic Light Scattering (DLS) | ≤ 0.1 | Polydispersity >0.2 suggests poor sample uniformity. |
| Grid-Coating Uniformity | Low-Mag TEM Survey | Qualitative (Visual) | Inconsistent coating leads to particle overlap or poor adhesion. |
| Particle Density per Grid Square | TEM Particle Counting | 5-20 particles/μm² | Too low: poor statistics. Too high: overlapping particles. |
| Buffer/Solvent Residuals | Electron Energy Loss Spectroscopy (EELS) | Non-detectable | Contaminants create artifacts and obscure morphology. |
| Inter-Particle Distance | TEM Image Analysis | ≥ 2x average particle diameter | Prevents agglomeration misinterpretation. |
Detailed Experimental Protocols
Protocol 3.1: Standardized Aqueous Nanoparticle Deposition for TEM
Objective: To reproducibly prepare a monolayer of dispersed nanoparticles on a TEM grid.
Materials:
- Nanoparticle suspension (e.g., lipid nanoparticles, polymeric micelles)
- Carbon-coated TEM grids (200-400 mesh, Cu)
- Glow discharger (or plasma cleaner)
- Precision pipettes (2-20 µL)
- Filter paper (Whatman Grade 1)
- Controlled-environment laminar flow hood
Method:
- Grid Activation: Subject the carbon-coated side of the TEM grid to a low-pressure air/argon glow discharge for 30-45 seconds. This renders the surface hydrophilic, promoting even suspension spreading.
- Sample Dilution: Dilute the stock nanoparticle suspension in the appropriate buffer (e.g., 10 mM HEPES, pH 7.4) to an optical density (OD) of ~0.1 at the plasmon resonance peak (if applicable) or a concentration of 0.01-0.1 mg/mL. Vortex gently for 10 seconds.
- Deposition: Using a precision pipette, apply 5 µL of the diluted suspension onto the hydrophilic side of the grid, held by anti-capillary tweezers. Allow adsorption for 60 seconds in a Petri dish with a humidified filter paper to prevent drying.
- Washing: Wicking away excess liquid with the edge of a filter paper, immediately apply a 50 µL droplet of deionized water to the grid. Wick away after 5 seconds. Repeat with a second 50 µL water droplet.
- Staining/Negative Stain (If Required): For soft materials (e.g., liposomes), apply 5 µL of 1-2% uranyl acetate solution for 30 seconds. Wick away excess and air-dry for 5 minutes.
- Drying: Place the grid in a dedicated, dust-free grid storage box and allow to dry completely for a minimum of 1 hour under ambient conditions before TEM imaging.
- Replication: Prepare a minimum of three grids from the same batch and three grids from three independent sample preparation batches.
Protocol 3.2: Quantitative TEM Image Analysis for Reproducibility
Objective: To obtain statistically robust size and distribution data from TEM micrographs.
Materials:
- TEM micrographs (≥ 5 images per grid, at consistent magnification)
- ImageJ/FIJI software with particle analysis plugin
Method:
- Image Calibration: Import TEM images into ImageJ. Set the scale (pixels/nm) using the image scale bar.
- Thresholding: Convert image to 8-bit. Adjust brightness/contrast uniformly across all images. Apply a consistent threshold (e.g., "Default" or "Huang") to create a binary mask of particles.
- Particle Analysis: Run "Analyze Particles" function. Set size limits to exclude dust/artifacts (e.g., 2 nm² to infinity). Ensure "Circularity" is set appropriately (0.5-1.0). Check "Display results" and "Summarize."
- Data Extraction: Record the mean particle area, Feret's diameter, and circularity for each image. Export all data to a spreadsheet.
- Statistical Calculation: For each batch, calculate the mean particle size and the standard deviation (SD). Compute the Coefficient of Variation (CV%) as (SD/Mean)*100 across all particles from all grids of the same batch. Compare the mean and CV% between independent batches.
Visual Workflows and Relationships
Diagram 1: TEM Nanoparticle Prep QC Workflow
Diagram 2: Prep Variables to Data Metrics Relationship
The Scientist's Toolkit: Essential Research Reagents & Materials
Table 2: Key Reagents and Materials for Reliable TEM Nanoparticle Prep
| Item | Function & Rationale | Key Selection Criteria |
|---|---|---|
| Glow Discharger / Plasma Cleaner | Creates a hydrophilic, charged carbon film surface, enabling uniform aqueous suspension spreading and adhesion. | Adjustable power/time; compatibility with air, argon, or argon/oxygen mixtures. |
| Ultraflat Carbon TEM Grids | Provides an atomically smooth, reproducible substrate, minimizing background interference for high-resolution imaging. | Quantifoil or similar grids with consistent, large flat areas. Pre-cleaned grade. |
| Precision Calibrated Pipettes | Ensures accurate and reproducible volumes are applied during deposition and washing steps, a major source of variability. | Regular calibration certification; volume range appropriate for 2-100 µL. |
| High-Purity Negative Stain | Enhances contrast of soft, low-Z material nanoparticles (e.g., liposomes, proteins). Uranyl acetate is standard. | 1-2% aqueous solution, filtered (0.22 µm) before use. Handle as radioactive waste. |
| Certified Particle Size Standards | Provides an internal control for TEM magnification calibration and image analysis software validation. | Gold nanoparticles (e.g., 5, 10, 20 nm) with tight size distribution (CV <5%). |
| Laminar Flow Hood | Provides a particle-free environment for grid preparation, preventing dust contamination that mimics nanoparticles. | HEPA-filtered, dedicated to TEM sample prep, not for chemical use. |
When is TEM Sufficient? Defining the Limits of Interpretation.
Application Notes: Contextualizing TEM Suitsability in Nanoparticle Characterization for Drug Development
Transmission Electron Microscopy (TEM) is a cornerstone analytical technique in nanotechnology and pharmaceutical development. Its sufficiency for drawing definitive conclusions, however, is contingent upon specific sample properties, analytical questions, and complementary data. Within a thesis on TEM sample preparation, understanding these limits is critical to avoid misinterpretation. TEM is sufficient for primary characterization of nanoparticle (NP) morphology, size, and crystallinity, but reaches its interpretive limits when assessing colloidal stability, quantifying polydispersity in complex media, or determining molecular surface composition alone.
The following tables summarize key quantitative benchmarks that define TEM's operational window.
Table 1: TEM Sufficiency Matrix for Common NP Characterization Goals
| Characterization Goal | TEM Typically Sufficient? | Key Limiting Factors | Critical Complementary Technique(s) |
|---|---|---|---|
| Core Size & Shape (Dry, pristine) | Yes | Sample representativeness, staining artifacts | Statistical analysis of >300 particles |
| Crystallinity & Lattice Imaging | Yes | Beam sensitivity, sample thickness | XRD, SAED pattern analysis |
| Number-Based Size Distribution | With caveats | Bias from aggregation, poor dispersion | DLS (for hydrodynamic size) |
| Aggregation State in Solution | No | Vacuum-induced artifacts, drying effects | DLS, NTA |
| Surface Coating Visualization | Rarely | Low contrast of organic layers | XPS, FTIR, NMR |
| Elemental Composition (Bulk) | No | Limited quantification, beam damage | ICP-MS, EDX (semi-quant) |
| 3D Morphology | No | Projection limitation | STEM Tomography, SEM |
Table 2: Quantitative Performance Limits of Conventional TEM (120 kV)
| Parameter | Typical Effective Range | Notes on Interpretive Limit |
|---|---|---|
| Size Measurement Accuracy | ± 0.2 nm (crystalline) | Depends on pixel calibration, edge contrast. |
| Sample Thickness | < 100 nm (optimal) | Thicker samples cause inelastic scattering, blurring. |
| Lattice Resolution | ~0.14 nm (point) | Requires high coherence, stable samples. |
| Molecular Contrast | ~2-3 nm (heavy metal stain) | Insufficient for unlabeled proteins/surfactants. |
| Representative Particle Count | Minimum 300-500 | For reliable population statistics. |
Experimental Protocols
Protocol 1: Grid Preparation for Assessing TEM Sufficiency in Polymeric NP Dispersions Objective: To prepare a TEM sample that reveals inherent nanoparticle morphology while diagnosing preparation-induced aggregation artifacts. Materials: Polymeric NP suspension (e.g., PLGA), carbon-coated copper TEM grids (200 mesh), phosphate buffer saline (PBS), filter paper, negative stain (2% uranyl acetate), positive stain (1% phosphotungstic acid). Procedure:
- Direct Deposition (for core assessment): a. Glow-discharge grid for 30 seconds to increase hydrophilicity. b. Pipette 5 µL of diluted NP suspension (in pure water) onto the grid. c. After 60 seconds, wick away excess liquid with filter paper. d. Allow to air-dry completely in a desiccator. e. Optional Staining: For surface coating, apply 5 µL of negative stain after step b, incubate 30 sec, then wick away and dry.
- Vitrification (for native state comparison, the "limit" diagnostic): a. Load the same NP suspension into a vitrification robot chamber at 25°C, 95% humidity. b. Apply 3 µL to a lacey carbon grid, blot with filter paper for 3-5 seconds to form a thin film. c. Rapidly plunge into liquid ethane. Store in liquid nitrogen. d. Transfer to a cryo-TEM holder for imaging at -175°C. Interpretation: Compare micrographs from Protocol 1.1 (air-dried) and 1.2 (vitrified). If aggregates are present only in 1.1, TEM alone is insufficient to conclude colloidal instability; drying artifacts are likely. Similar aggregates in 1.2 indicate true instability, but DLS is still required for quantification in bulk.
Protocol 2: Correlative Workflow to Define TEM Limits for Lipid Nanoparticle (LNP) Characterization Objective: To integrate TEM with orthogonal techniques, defining its specific contribution and limits for a complete LNP analysis. Procedure:
- TEM Analysis (Morphology & Internal Structure): a. Prepare cryo-TEM sample of LNPs in buffer via vitrification (as in Protocol 1.2). b. Image at 200 kV under low-dose conditions to minimize beam damage. c. Measure core diameter and lamellarity of >300 particles.
- Parallel DLS Analysis (Hydrodynamic Size & PDI): a. Dilute the same LNP batch in the original buffer to appropriate concentration. b. Measure hydrodynamic diameter and PDI via dynamic light scattering (triplicate).
- Parallel NTA Analysis (Concentration & Size Distribution): a. Dilute sample in particle-free buffer. b. Record particle tracking video, analyze to obtain particle concentration and size distribution profile.
- Data Integration: a. Tabulate TEM (number-based, core size), DLS (intensity-based, hydrodynamic size), and NTA (number-based, hydrodynamic size) distributions. b. Interpretive Rule: If DLS size >> TEM core size, a thick coating (e.g., PEG layer) or aggregation is inferred. NTA validates the population statistics from TEM. TEM alone was sufficient for core visualization but insufficient for reporting complete size or stability data.
Mandatory Visualization
Decision Tree: TEM Sufficiency for NP Analysis
Workflow: Correlative Analysis to Define TEM Limits
The Scientist's Toolkit: Key Research Reagent Solutions
| Item | Function & Relevance to TEM Limits |
|---|---|
| Lacey Carbon TEM Grids | Provide a thin, perforated support film ideal for high-resolution imaging and vitrification, minimizing background noise that can obscure fine NP details. |
| Uranyl Acetate (2% Solution) | Negative stain that envelopes unstained organic material, increasing contrast for polymer/lipid shells. Critical to attempt visualization of coatings, defining TEM's limit. |
| Glow Discharge System | Renders carbon grids hydrophilic, ensuring even sample spreading. Inconsistent application leads to aggregation artifacts, causing false interpretive limits. |
| Vitrification Plunge Freezer | Rapidly freezes samples in amorphous ice, preserving the native solution state. The key tool to diagnose if aggregates seen in air-dried TEM are real or artifacts. |
| Standard Reference Nanoparticles (e.g., NIST Au NPs) | Essential for daily calibration of TEM magnification and pixel size. Ensures size measurement accuracy, a fundamental parameter for TEM to be sufficient. |
| Particle-Free Water/Buffer | Used for all dilutions and grid washing. Contaminants can be misidentified as nanoparticles, leading to severe misinterpretation. |
Conclusion
Mastering TEM sample preparation is non-negotiable for obtaining reliable, high-quality data on nanoparticles used in drug delivery and biomedical research. From foundational understanding to meticulous protocol execution, effective troubleshooting, and rigorous validation, each step directly impacts the interpretation of critical attributes like size, morphology, and internal structure. As nanomedicine advances toward complex multifunctional particles, preparation techniques must evolve in parallel. Future directions will likely see greater integration of cryo-methods for biocompatible imaging and automated preparation systems to enhance reproducibility. Ultimately, robust TEM preparation forms the bedrock of credible nanomaterial characterization, enabling confident translation from benchtop formulations to clinical applications.