The Ultimate Guide to Zeta Potential Measurement: Techniques for Accurate Nanoparticle Surface Charge Analysis
This comprehensive guide provides researchers, scientists, and drug development professionals with a complete framework for measuring zeta potential to characterize nanoparticle surface charge.
The Ultimate Guide to Zeta Potential Measurement: Techniques for Accurate Nanoparticle Surface Charge Analysis
Abstract
This comprehensive guide provides researchers, scientists, and drug development professionals with a complete framework for measuring zeta potential to characterize nanoparticle surface charge. It covers fundamental principles, modern electrokinetic techniques (including ELS and PALS), step-by-step protocols for various nanoparticle systems, advanced troubleshooting for common artifacts, and validation strategies for regulatory compliance. The article addresses critical needs for formulation stability assessment, surface modification verification, and predicting nanoparticle behavior in biological environments, serving as both a practical handbook and a reference for optimizing nanomedicine development.
Zeta Potential Fundamentals: Why Surface Charge Dictates Nanoparticle Behavior
Zeta potential (ζ) is the electrokinetic potential at the slipping plane of a particle in suspension. It is the key quantitative indicator of the electrostatic repulsion between adjacent, similarly charged particles in a dispersion. For nanoparticle systems, a high absolute zeta potential (typically > |±30| mV) signifies strong electrostatic stabilization, preventing aggregation. Within the broader thesis on measuring nanoparticle surface charge, understanding and accurately determining zeta potential is the critical step for predicting and controlling colloidal stability, which is fundamental for drug delivery, formulation, and material synthesis.
Application Notes
Note 1: Stability Prediction for Nano-formulations The magnitude of zeta potential directly correlates with the stability of injectable or inhalable nanomedicines (e.g., lipid nanoparticles, polymeric micelles). Monitoring ζ over time or under stress (pH, temperature) is a standard stability-indicating test.
Note 2: Surface Modification Verification Successful surface coating (PEGylation) or conjugation of targeting ligands alters the nanoparticle's surface charge. A confirmed shift in zeta potential is primary evidence of successful modification.
Note 3: Buffer and Environment Optimization The ionic strength and pH of the dispersant dramatically affect ζ. Measurements across a pH range identify the isoelectric point (IEP), crucial for formulating stable products in physiological buffers.
Experimental Protocols
Protocol A: Sample Preparation for Zeta Potential Measurement
Objective: To prepare a nanoparticle suspension suitable for electrophoretic light scattering (ELS) analysis.
Materials:
- Nanoparticle suspension
- Appropriate electrolyte (e.g., 1 mM KCl) or target buffer
- pH meter and standard solutions
- Sonicator bath
- Syringe filters (0.45 µm or 0.2 µm, compatible with sample)
- Disposable folded capillary cells (or appropriate cell for instrument)
Methodology:
- Dilution: Dilute the nanoparticle stock suspension in a low-conductivity electrolyte (e.g., 1 mM KCl) or the desired buffer to achieve a final concentration optimized for instrument sensitivity (typically 0.1-1 mg/mL). Note: Excess concentration causes multiple scattering; too little yields poor signal.
- pH Adjustment: Adjust the pH of the diluted suspension to the target value using dilute HCl or KOH. Record the final pH.
- Clarification: Filter the diluent/buffer through a 0.2 µm filter prior to dilution to remove dust.
- Degassing & Homogenization: Briefly sonicate the final sample in a bath sonicator (2-3 minutes) to degas and ensure homogeneous dispersion.
- Cell Loading: Using a syringe, carefully load the sample into a clean, dry disposable capillary cell, avoiding introduction of air bubbles.
- Equilibration: Allow the loaded cell to thermally equilibrate in the instrument compartment for 2 minutes before measurement.
Protocol B: Standard Operating Procedure for ELS Measurement
Objective: To perform a zeta potential measurement using phase analysis light scattering (PALS).
Materials:
- Zeta potential analyzer (e.g., Malvern Zetasizer Nano series, Brookhaven BI-90Plus)
- Prepared sample in folded capillary cell
- Instrument software
Methodology:
- Instrument Setup: Turn on the instrument and laser. Allow 15-30 minutes for warm-up and stabilization.
- Experimental Parameters: In the software, define the following:
- Dispersant: Set refractive index and viscosity for the buffer/electrolyte used (e.g., water at 25°C).
- Temperature: Set to 25.0°C (or desired temperature).
- Equilibration Time: 120 seconds.
- Number of Runs: Minimum of 3 runs per measurement, with 10-15 sub-runs automatically determined.
- Applied Voltage: Set to instrument-recommended automatic mode.
- Cell Insertion: Insert the capillary cell into the instrument holder, ensuring correct orientation (electrodes aligned).
- Measurement Initiation: Start the measurement sequence. The system will automatically perform:
- Laser Alignment
- Measurement of Electrophoretic Mobility: Particles move in applied electric field; velocity is measured via Doppler shift.
- Data Processing: The software converts the mean electrophoretic mobility (µe) to zeta potential (ζ) using the Henry equation: ζ = (µe * η) / (ε * f(κa)), where η is viscosity, ε is dielectric constant, and f(κa) is Henry's function (Smoluchowski approximation, f(κa)=1.5, is typical for aqueous systems).
- Quality Control: Accept results only if the phase plot is linear and the derived count rate is stable. The standard deviation between runs should be < 5% of the mean zeta value. Report the Z-Average Zeta Potential (mV) and the mean ± standard deviation from at least three independent sample preparations.
Table 1: Zeta Potential Ranges and Colloidal Stability Interpretation
| Zeta Potential (mV) | Stability Interpretation | Predicted Dispersibility |
|---|---|---|
| 0 to ±5 | Highly unstable, rapid aggregation/flocculation | Very Poor |
| ±10 to ±20 | Incipient instability, slow aggregation possible | Short-term |
| ±20 to ±30 | Moderately stable | Moderate |
| > ±30 | Excellent electrostatic stability | Good, Long-term |
| > ±40 | Extremely stable | Excellent, Long-term |
Table 2: Effect of pH and Ionic Strength on Model Nanoparticles (Hypothetical Data)
| Nanoparticle Type | Buffer/Condition | Measured ζ (mV) | PdI (Stability Index) |
|---|---|---|---|
| Plain PLGA NPs | 1 mM KCl, pH 5.5 | -2.1 ± 0.8 | 0.35 |
| Plain PLGA NPs | 1 mM KCl, pH 7.4 | -34.5 ± 2.1 | 0.12 |
| Chitosan-coated PLGA NPs | 1 mM KCl, pH 5.5 | +28.7 ± 1.5 | 0.15 |
| 50 nm Au Citrate | 1 mM KCl, pH 7.0 | -38.2 ± 3.0 | 0.08 |
| 50 nm Au Citrate | 150 mM NaCl, pH 7.0 | -15.6 ± 2.5 | 0.25 |
Visualization: Experimental Workflow and Data Interpretation
Title: Zeta Potential Measurement Workflow
Title: Stability Outcome Based on Zeta Potential
The Scientist's Toolkit: Essential Research Reagents & Materials
| Item | Function / Rationale |
|---|---|
| Potassium Chloride (KCl), 1 mM Solution | Standard low-ionic-strength dispersant to minimize compression of the electrical double layer, allowing true surface charge measurement. |
| Disposable Folded Capillary Cells | Sample cells with integrated electrodes. Disposable to prevent cross-contamination and ensure consistent cell surface properties. |
| NIST-Traceable Zeta Potential Transfer Standard (e.g., -50 ± 5 mV) | For instrument validation and performance verification prior to sample analysis. |
| 0.2 µm Syringe Filters (PES or PVDF membrane) | For filtration of buffers and samples to remove dust and particulates that interfere with light scattering. |
| pH Standard Buffers (pH 4, 7, 10) | For accurate calibration of the pH meter used to adjust sample pH. |
| High-Purity Deionized Water (18.2 MΩ·cm resistivity) | For preparing all solutions and dilutions to avoid contaminant ions. |
| Disposable Plastic Cuvettes/Syringes | For sample handling; plastic is preferred over glass to minimize adhesion of nanoparticles and avoid leaching of ions. |
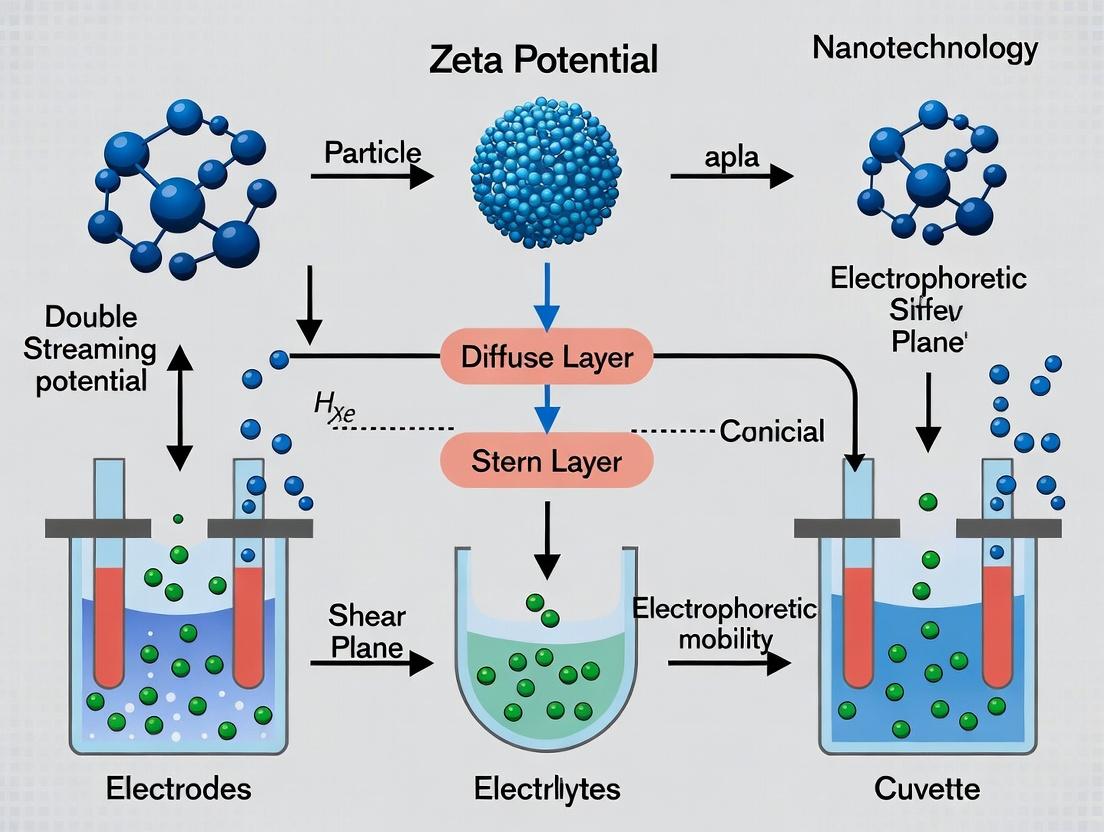
The Electrical Double Layer (EDL) is the fundamental model describing the distribution of ions around a charged nanoparticle in suspension. It is the critical theoretical bridge between intrinsic surface charge, determined by material composition and functionalization, and the measurable zeta potential, a key parameter for assessing colloidal stability, biodistribution, and targeting in nanomedicine. In the context of nanoparticle surface charge research, understanding the EDL is essential for interpreting zeta potential measurements, which inform decisions on formulation, purification, and functionalization during drug delivery system development.
The EDL consists of two main regions: (1) the Stern layer, where counterions are strongly adsorbed, and (2) the diffuse layer, where ions are distributed according to a balance between electrostatic forces and thermal diffusion. The zeta potential is defined as the electrokinetic potential at the shear plane, which lies within the diffuse layer. This plane separates the fluid moving with the particle from the bulk fluid during electrophoresis or other electrokinetic phenomena.
Key Parameters and Governing Equations
The Poisson-Boltzmann equation describes the potential decay within the diffuse layer. Key quantitative relationships are summarized below.
Table 1: Key Parameters of the Electrical Double Layer and Zeta Potential
| Parameter | Symbol | Typical Range (Nanoparticles) | Description & Relevance to Measurement |
|---|---|---|---|
| Surface Potential | Ψ₀ | Variable, determined by surface groups | The potential at the particle surface. Not directly measurable. |
| Stern Potential | Ψ_d | Close to, but less than, Ψ₀ | Potential at the Stern plane. Approximated by zeta potential under certain conditions. |
| Zeta Potential | ζ | ±5 to ±60 mV for stable colloids | Measured potential at the shear plane. Primary indicator of colloidal stability. |
| Debye Length (1/κ) | κ⁻¹ | 0.3 nm (1M NaCl) to 100 nm (DI water) | The characteristic thickness of the diffuse layer. Depends on ionic strength. |
| Isoelectric Point | IEP | pH value (e.g., pH 3 for alumina) | The pH at which ζ = 0 mV. Critical for understanding pH-dependent charge. |
Table 2: Effect of Experimental Conditions on EDL and Measured Zeta Potential
| Condition | Effect on Diffuse Layer (Debye Length) | Effect on Measurable Zeta Potential | ||
|---|---|---|---|---|
| Increased Ionic Strength | Compresses the EDL (κ⁻¹ decreases). | Reduces magnitude | ζ | due to screening; can shift shear plane. |
| Increased Valency of Counter-ion | Stronger compression of EDL (e.g., Al³⁺ vs. Na⁺). | Drastically reduces | ζ | ; can lead to charge reversal. |
| Change in pH | Alters surface dissociation (e.g., -COOH, -NH₂). | Changes sign and magnitude; used to find IEP. | ||
| Adsorption of Polymers/Surfactants | Can shift shear plane outward (steric effects). | Can modify ζ; non-ionic surfactants may not change ζ directly. |
Experimental Protocols for Zeta Potential Measurement
Protocol 3.1: Sample Preparation for Reliable Zeta Potential Analysis
Objective: To prepare a nanoparticle suspension suitable for electrophoretic light scattering measurement.
- Purification: Dialyze or ultrafilter the nanoparticle suspension against a low-ionic-strength buffer (e.g., 1 mM KCl or NaCl) or deionized water to remove excess ions and unbound molecules. This ensures the measured EDL is representative of the particle surface.
- Concentration Adjustment: Dilute the sample to an optimal concentration for the instrument (typically 0.1-1 mg/mL for 50-200 nm particles). The solution must be transparent enough for the laser to pass through.
- pH Adjustment & Equilibration: If studying pH dependence, adjust pH using dilute HCl or KOH. Allow the sample to equilibrate for 15 minutes after each adjustment. Measure pH directly in the sample cuvette if possible.
- Filtration: Filter the final suspension through a 0.22 µm or 0.45 µm syringe filter (PVDF or nylon) into a clean, dust-free vial to remove large aggregates and dust.
- Temperature Equilibration: Allow the loaded sample cuvette to equilibrate in the instrument to the set temperature (typically 25°C) for 2 minutes before measurement.
Protocol 3.2: Standard Operating Procedure for Measurement via Electrophoretic Light Scattering
Objective: To measure the electrophoretic mobility and calculate the zeta potential of nanoparticles.
- Instrument Calibration: Perform a system check using a standard zeta potential reference material (e.g., -50 ± 5 mV polystyrene latex) in the specified dispersant.
- Cuvette Selection & Loading: Use a clean, dedicated folded capillary cell (or appropriate flow cell). Rinse with filtered dispersant, then load ~1 mL of prepared sample via syringe, avoiding air bubbles.
- Parameter Input: Enter the dispersant viscosity, refractive index, and dielectric constant (values for water at 25°C are typically pre-set). Enter the instrument’s electrode spacing and field strength parameters, or select the material (e.g., "polystyrene") for automatic calculation.
- Measurement Run: Apply a voltage (typically 50-150 V). The instrument uses Laser Doppler Velocimetry to measure particle velocity. Perform a minimum of 10-30 sub-runs. The software calculates the electrophoretic mobility (µE).
- Data Analysis: The zeta potential (ζ) is calculated from µE using the Henry equation: ζ = (3ηµE)/(2εƒ(κa)), where η is viscosity, ε is permittivity, and ƒ(κa) is Henry’s function (Smoluchowski approximation, ƒ(κa)=1.5, is used for aqueous buffers and particles >0.2 µm). Report the zeta potential as the mean ± standard deviation from at least three independent measurements.
Visualizing Key Concepts and Workflows
Title: EDL Structure and Zeta Potential Location
Title: Zeta Potential Measurement Workflow
The Scientist's Toolkit: Essential Research Reagents & Materials
Table 3: Key Reagents and Materials for Zeta Potential Research
| Item | Function & Importance in EDL/Zeta Context |
|---|---|
| Potassium Chloride (KCl), 1-10 mM Solution | Standard, low-ionic-strength electrolyte for sample preparation and dilution. Minimizes EDL compression, providing a clear signal. |
| pH Standard Buffers (pH 4, 7, 10) | For calibrating the pH meter. Accurate pH measurement is critical as surface charge is highly pH-dependent. |
| Zeta Potential Transfer Standard (e.g., -50 mV Latrex) | Used for instrument calibration and validation. Verifies the entire measurement system (optics, electronics, cell) is performing correctly. |
| Disposable Syringe Filters (0.22 µm, PVDF) | For final sample filtration to remove dust and aggregates, which can cause spurious scattering and data artifacts. |
| Disposable Folded Capillary Cells (Zeta Cells) | Sample cuvettes with embedded electrodes. Disposable cells prevent cross-contamination between samples. |
| High-Purity Deionized Water (≥18.2 MΩ·cm) | Primary dispersant for preparing all solutions. Low ionic strength and contaminant-free water is essential for reproducible EDL formation. |
| Dilute HCl and KOH Solutions (0.1 M) | For precise pH adjustment of nanoparticle suspensions to study charge versus pH profiles and determine the Isoelectric Point (IEP). |
| Non-ionic Surfactant (e.g., Polysorbate 20) | Used in some protocols to wet surfaces and prevent nanoparticle adhesion to vials and cuvettes, without directly interfering with surface charge. |
Zeta potential (ζ) is the electrokinetic potential at the slipping plane of a nanoparticle in suspension. It is a key indicator of the surface charge and colloidal stability, directly influencing a nanoparticle's propensity to aggregate, its behavior in biological systems (biodistribution), and its ultimate therapeutic or diagnostic efficacy. This application note details its critical role and provides protocols for its measurement within nanoparticle surface charge research.
Table 1: Zeta Potential Ranges and Colloidal Stability
| Zeta Potential (mV) | Stability Interpretation | Likelihood of Aggregation |
|---|---|---|
| 0 to ±5 | Highly Unstable | Rapid, irreversible |
| ±10 to ±20 | Relatively Stable | Slow aggregation |
| ±20 to ±30 | Moderately Stable | Minimal aggregation |
| Beyond ±30 | Highly Stable | Very low |
Table 2: Impact of Zeta Potential on Nanomedicine Performance
| Parameter | Negative ζ (e.g., -25 mV) | Positive ζ (e.g., +25 mV) | Near-Neutral ζ (e.g., ±5 mV) |
|---|---|---|---|
| Protein Corona | Preferential IgM adsorption, complement activation | High albumin & apolipoprotein adsorption | Minimal, variable composition |
| Cell Uptake | Lower non-specific uptake, enhanced EPR effect | High non-specific cellular internalization | Low non-specific uptake |
| Blood Circulation | Moderate to long half-life (stealth effect) | Often short half-life (opsonization) | Variable, can be long with PEGylation |
| Primary Clearance | Hepatic (Kupffer cells) | Often rapid RES clearance | Can evade RES |
Experimental Protocols
Protocol 1: Measuring Zeta Potential via Electrophoretic Light Scattering (ELS)
Objective: To determine the zeta potential of a nanoparticle suspension using phase analysis light scattering (PALS).
Materials & Reagents:
- Nanoparticle suspension (1 mL, 0.1-1 mg/mL in appropriate buffer).
- Disposable zeta potential folded capillary cell (e.g., DTS1070).
- Zeta potential standard (e.g., -50 mV ± 5 mV).
- Appropriate low-conductivity buffer (e.g., 1 mM KCl, 10 mM NaCl, or 1 mM PBS) for dilution if needed.
- Syringe for cell loading.
Procedure:
- Sample Preparation: Dilute the nanoparticle sample in a low ionic strength buffer (conductivity < 5 mS/cm) to achieve optimal light scattering intensity. Avoid filtration that may remove particles.
- Cell Loading: Using a syringe, carefully load the sample into a clean, dry folded capillary cell, ensuring no air bubbles are introduced.
- Instrument Setup: Place the cell in the thermostatted chamber (typically 25°C) of the zeta potential analyzer. Allow 2 minutes for temperature equilibration.
- Measurement Parameters: Set the instrument parameters: dispersant viscosity and refractive index, dispersant dielectric constant, measurement angle (typically 13° or 17°), applied voltage (automatic).
- Calibration: Run a standard zeta potential material to verify instrument performance.
- Data Acquisition: Perform at least 3 runs of 10-100 sub-runs per measurement. The instrument applies an electric field and measures particle velocity via Doppler shift.
- Data Analysis: The software uses the Smoluchowski or Hückel model to convert electrophoretic mobility to zeta potential. Report the average ζ and the polydispersity index (PDI) of the zeta potential distribution.
Protocol 2: Assessing pH-Dependent Zeta Potential (Isoelectric Point Determination)
Objective: To identify the pH at which the nanoparticle surface charge is neutral (isoelectric point, pI).
Procedure:
- Prepare 10 aliquots (1 mL each) of your nanoparticle suspension in deionized water or very low ionic strength medium.
- Adjust the pH of each aliquot across a wide range (e.g., pH 2 to 11) using 0.1M HCl or NaOH.
- Allow samples to equilibrate for 15 minutes post-adjustment.
- Measure the zeta potential for each pH aliquot immediately using Protocol 1.
- Plot zeta potential (mV) versus pH. The pH at which ζ = 0 mV is the isoelectric point (pI). This point indicates maximum aggregation propensity.
The Scientist's Toolkit: Research Reagent Solutions
Table 3: Essential Materials for Zeta Potential Research
| Item | Function/Benefit |
|---|---|
| Folded Capillary Zeta Cell (DTS1070) | Standard cell for electrophoresis measurements, eliminates electrode polarization. |
| Zeta Potential Transfer Standard (±50 mV) | For instrument calibration and performance verification. |
| Low-Volume Disposable Zeta Cells | For precious or scarce samples, minimizes sample requirement to < 50 µL. |
| Phosphate Buffered Saline (PBS), 1-10 mM | Common physiological buffer for simulating biological conditions. Note: High salt reduces double layer, use diluted versions. |
| Polyethylene Glycol (PEG) Thiol/Amine/Carboxyl | For surface functionalization to modulate charge and confer stealth properties. |
| Poly-L-Lysine or Polyethylenimine (PEI) | Common cationic polymers for inducing positive surface charge. |
| Citrate or Tannic Acid | Common agents for stabilizing and imparting negative charge to metallic nanoparticles. |
| 0.1 µm Filtered, Deionized Water | Essential for preparing low-conductivity dispersants to avoid masking surface charge. |
Visualizations
Zeta Potential Influences on Nanomedicine
Zeta Potential Measurement Protocol
Thesis Context: This document details the experimental considerations for accurate zeta potential (ζ) measurement, a critical technique in nanoparticle surface charge research for characterizing stability, surface chemistry, and interactions in drug delivery system development.
Influence of Key Parameters on Zeta Potential
Zeta potential is not an intrinsic material property but is highly dependent on the dispersant environment. The following table summarizes the primary effects.
Table 1: Quantitative Influence of Key Parameters on Zeta Potential Measurement
| Parameter | Primary Influence | Typical Target Range for Nanoparticles | Effect on Measured ζ-Potential | Rationale & Consequence |
|---|---|---|---|---|
| pH | Alters surface protonation/deprotonation; determines isoelectric point (IEP). | ±2 pH units from physiological or formulation pH. | Can change magnitude and sign. IEP is where ζ = 0 mV. | Shifts the equilibrium of surface functional groups (e.g., -COOH, -NH₂). Critical for assessing colloidal stability across pH gradients (e.g., GI tract). |
| Ionic Strength | Compresses the electrostatic double layer (EDL). | 1-10 mM for screening studies; often <50 mM for clear EDL. | Decreases absolute magnitude; can induce aggregation near IEP. | Increased counter-ion concentration screens surface charge, reducing effective ζ and decreasing repulsive forces, potentially leading to instability. |
| Conductivity | Indicator of total ion concentration; affects measurement fidelity. | Ideally <5 mS/cm for electrophoretic light scattering. | High conductivity can obscure signal, cause electrode polarization, and Joule heating. | High ion content reduces the voltage gradient for particle motion, complicating electrophoretic mobility calculation. Requires specialized high-conductivity cells. |
Core Experimental Protocols
Protocol 1: Systematic pH Titration for IEP Determination
- Objective: To map zeta potential as a function of pH and identify the isoelectric point.
- Materials: Nanoparticle dispersion, pH meter, titrants (e.g., 0.1M HCl, 0.1M NaOH), zeta potential analyzer with titration capability.
- Procedure:
- Prepare a standardized stock dispersion of nanoparticles (e.g., 0.1 mg/mL) in a low-ionic-strength buffer (e.g., 1 mM NaCl) or deionized water.
- Calibrate pH meter with standard buffers (pH 4, 7, 10).
- Load sample into electrophoretic cell. Measure initial ζ and pH.
- For automated titration: Set parameters (e.g., pH range 3-11, 0.5 pH unit increments). The instrument will add titrant, equilibrate, and measure ζ at each step.
- For manual titration: Aliquot separate samples. Adjust each to target pH with microliter volumes of titrant. Allow 2-minute equilibrium post-adjustment before measuring ζ and pH.
- Plot ζ-potential vs. pH. The IEP is the pH where the curve crosses 0 mV.
Protocol 2: Assessing Ionic Strength Stability
- Objective: To evaluate colloidal stability and ζ-potential response to increasing salt concentration.
- Materials: Nanoparticle stock, concentrated salt solution (e.g., 1M NaCl), deionized water.
- Procedure:
- Prepare a concentrated, well-characterized nanoparticle stock in deionized water.
- Create a series of 2 mL samples with identical nanoparticle concentration but increasing ionic strength (e.g., 0, 1, 5, 10, 50, 100 mM NaCl) via dilution with NaCl solution.
- Vortex each sample for 10 seconds. Allow to equilibrate for 5 minutes.
- Measure ζ-potential and particle size (via Dynamic Light Scattering) for each sample in sequence.
- Plot ζ-potential and mean particle size versus ionic strength. A sharp increase in size indicates aggregation onset due to charge screening.
Visualization of Parameter Interactions
Title: Parameter Interplay in Zeta Potential Analysis
The Scientist's Toolkit: Essential Reagents & Materials
Table 2: Key Research Reagent Solutions for Zeta Potential Studies
| Item | Function & Rationale |
|---|---|
| Potassium Chloride (KCl), 1-10 mM | Standard dilute electrolyte for baseline measurements. Provides consistent, low ionic strength. Often used in instrument calibration (e.g., -50 mV standard). |
| Phosphate Buffered Saline (PBS), 10X | Common physiological simulant. Must be diluted (e.g., 1X) to reduce conductivity for accurate measurement. Tests formulation relevance. |
| Sodium Hydroxide (NaOH) & Hydrochloric Acid (HCl), 0.1-0.5M | Standard titrants for pH adjustment during IEP studies. Low concentration minimizes dilution effects. |
| TRIS or MES Buffer, 10 mM | Weak buffers for maintaining specific pH ranges with minimal interference from buffer ions during measurements. |
| Polystyrene Latex Standards (e.g., -50 mV) | Certified reference materials for validating instrument performance and software calculations. |
| Disposable Zeta Cells (Capillary or Folded) | Cellulose or quartz cuvettes with embedded electrodes. Disposable cells prevent cross-contamination between samples. |
| Temperature-Controlled Sample Chamber | Critical accessory. Zeta potential and mobility are temperature-dependent (affects solvent viscosity). Ensures measurements are isothermal (typically 25°C). |
Within nanoparticle surface charge research, zeta potential is a critical indicator of colloidal stability, a prerequisite for successful formulation. The primary objective is not merely to obtain a zeta value but to link this data to tangible formulation goals: preventing aggregation, ensuring shelf-life, controlling interactions with biological systems (e.g., protein corona formation, cellular uptake), and achieving targeted drug delivery. This Application Note provides a structured framework for setting these measurement objectives and protocols for deriving actionable insights.
Quantitative Benchmarks and Formulation Goals
Zeta potential data must be interpreted against established physicochemical benchmarks. The following table summarizes key quantitative relationships between zeta potential ranges and formulation outcomes.
Table 1: Zeta Potential Ranges and Corresponding Formulation Implications
| Zeta Potential Range (mV) | Colloidal Stability Prognosis | Primary Formulation Goal Link | Key Risk |
|---|---|---|---|
| +30 to +60 or -30 to -60 | Excellent stability (strong electrostatic repulsion) | Long-term shelf-life; Sterile filtration compatibility | Potential for non-specific binding in biological fluids. |
| +20 to +30 or -20 to -30 | Moderate stability (good electrostatic repulsion) | Short-to-medium term storage; Pilot-scale manufacturing. | Sensitive to ionic strength changes. |
| +5 to +20 or -5 to -20 | Incipient instability (weak repulsion) | Targeted flocculation for purification; Responsive delivery systems. | High risk of aggregation over time or with minor process changes. |
| -5 to +5 | Highly unstable (dominant van der Waals attraction) | Rapid binding or adhesion desired; Diagnostic aggregation assays. | Immediate aggregation and sedimentation. |
Table 2: Linking Zeta Shifts to Specific Formulation Challenges
| Observed Zeta Shift | Probable Cause | Formulation Goal Impact | Corrective Action Objective |
|---|---|---|---|
| Decrease in magnitude (e.g., -40 mV to -20 mV) | Salt-induced compression of double layer; Adsorption of oppositely charged species. | Compromised long-term stability. | Optimize buffer ionic strength; Modify surfactant/polymer coating. |
| Charge reversal (e.g., negative to positive) | Specific adsorption of cationic polymers, proteins, or targeting ligands. | Altered biodistribution & protein corona. | Characterize adsorption kinetics; Re-optimize ligand density. |
| Batch-to-batch variability | Inconsistent purification, washing, or surface modification. | Failed reproducibility & scale-up. | Standardize surface coating and dialysis/ultrafiltration protocol. |
Experimental Protocols
Protocol: Establishing a Stability Baseline via pH-Zeta Titration
Objective: To determine the isoelectric point (IEP) and pH range of maximum stability for a novel nanoparticle formulation.
Materials: See Scientist's Toolkit (Section 5.0).
Methodology:
- Prepare a concentrated stock dispersion of nanoparticles in 1 mM KCl (low ionic strength background electrolyte).
- Using a pH meter, titrate aliquots of the dispersion across a pH range (e.g., pH 3 to 11) using 0.1M HCl and 0.1M KOH.
- After each pH adjustment, allow the sample to equilibrate for 2 minutes.
- Load the equilibrated sample into a folded capillary cell.
- Measure the zeta potential via electrophoretic light scattering (ELS). Record the mean zeta from at least 3 runs per pH.
- Measure the hydrodynamic size (via DLS) at each pH point.
- Data Analysis: Plot zeta potential and hydrodynamic diameter versus pH. The IEP is where zeta = 0 mV. The region where |zeta| > 20 mV and size is constant is the optimal pH for electrostatic stability.
Protocol: Assessing Serum Protein Interaction (Protein Corona)
Objective: To evaluate the colloidal stability and surface charge evolution of nanoparticles in biologically relevant media.
Methodology:
- Dilute the nanoparticle formulation in 1X phosphate-buffered saline (PBS) to a standard concentration (e.g., 1 mg/mL).
- Mix the nanoparticle suspension with an equal volume of fetal bovine serum (FBS) or desired plasma simulant to achieve a final serum concentration (e.g., 50% v/v).
- Incubate the mixture at 37°C with gentle agitation.
- At predetermined time points (e.g., 0, 30, 60, 120 min), withdraw aliquots.
- Dilute aliquots 1:10 in the original buffer (PBS) to attenuate conductivity.
- Immediately measure zeta potential and size.
- Data Analysis: Plot zeta and size over time. A rapid shift towards -10 to -15 mV typically indicates formation of a protein corona. A concurrent size increase > 20 nm suggests aggregation.
Visualizing the Objective-Setting Workflow
Title: Workflow for Linking Zeta Data to Formulation Goals
Title: Zeta Potential Measurement via Electrophoretic Light Scattering (ELS)
The Scientist's Toolkit
Table 3: Essential Research Reagent Solutions for Zeta Potential Studies
| Item | Function & Relevance to Formulation Goals |
|---|---|
| Fold Capillary Cells (Disposable) | Standard cell for zeta potential measurement. Minimizes cross-contamination and electrode degradation, crucial for reproducible screening of formulation variants. |
| Low Ionic Strength Buffers (e.g., 1mM KCl, 1mM NaCl) | Provide a controlled background electrolyte for accurate measurement. High salt compresses the double layer, masking true surface charge. |
| pH Titrants (0.1-1.0 M HCl/KOH) | For determining the IEP and mapping stability as a function of pH, essential for defining formulation buffer conditions. |
| Sterile Phosphate-Buffered Saline (PBS) | Biological relevant diluent for simulating in vitro and in vivo conditions and assessing stability in physiological ionic strength. |
| Model Serum (e.g., Fetal Bovine Serum) | Used in protein corona studies to evaluate how biological fluids alter nanoparticle surface charge and colloidal stability. |
| Polyelectrolyte Standards (e.g., ζ -50 mV latex) | Certified reference materials for validating instrument performance and ensuring data reliability across experiments. |
| Sterile Syringe Filters (0.22 µm) | For clarifying buffers and sample preparation. Prevents dust/aggregate interference, a common source of measurement artifact. |
| Temperature-Controlled Sample Chamber | Maintains constant temperature (e.g., 25°C) during measurement, as zeta potential and mobility are temperature-dependent parameters. |
Step-by-Step Measurement Protocols: From Sample Prep to Data Acquisition
Zeta potential is a critical parameter in nanoparticle research, indicating the surface charge and colloidal stability. It predicts interactions in biological systems, crucial for drug delivery, diagnostic imaging, and vaccine development. Laser Doppler Velocimetry (LDV) is a standard electrokinetic technique for measuring particle mobility in an applied electric field, which is converted to zeta potential using established models. Phase Analysis Light Scattering (PALS) is a related, advanced technique that significantly enhances the sensitivity and speed of LDV measurements by analyzing the phase shift of scattered light rather than frequency shifts. This combination (LDV-PALS) is particularly vital for measuring samples in high-conductivity media (e.g., physiological buffers) or those with low electrophoretic mobility, common in pharmaceutical nanocarriers.
Key Principles and Technical Advancements
Laser Doppler Velocimetry (LDV): A laser beam is split into incident and reference beams. The incident beam illuminates charged particles moving under an applied electric field (electrophoresis). The scattered light from these moving particles undergoes a frequency shift (Doppler shift). Mixing this scattered light with the reference beam on a detector creates a beat frequency proportional to particle velocity.
Phase Analysis Light Scattering (PALS): PALS improves upon traditional frequency analysis. It measures the phase shift of the scattered light relative to a reference signal, which changes linearly with particle displacement. This method is more sensitive, allowing for the use of lower applied voltages, which minimizes sample heating and electrode polarization—key limitations in classic LDV. PALS enables accurate measurements in high-conductivity solutions where traditional LDV fails.
The Smoluchowski Equation: The core calculation for converting measured electrophoretic mobility (µ) to zeta potential (ζ).
ζ = (µη) / (ε_rε_0)
Where: η = viscosity, εr = dielectric constant, ε0 = permittivity of free space.
Applications in Nanoparticle Drug Development
| Application Area | Specific Use Case | Benefit of LDV-PALS |
|---|---|---|
| Formulation Stability | Screening lipid nanoparticle (LNP) formulations for mRNA vaccines. | Assesses colloidal stability in storage buffers; predicts aggregation risk. |
| Surface Modification | Optimizing PEGylation density on polymeric nanoparticles. | Quantifies changes in surface charge with polymer grafting; finds optimal stealth properties. |
| Protein Corona Study | Measuring zeta potential of nanoparticles before and after incubation in plasma. | Detects charge inversion/screening due to protein adsorption, predicting in vivo behavior. |
| Biosensing | Characterizing charge-based binding events on functionalized nano-sensors. | Monitors zeta potential changes upon target analyte binding. |
| Gene Delivery | Evaluating cationic liposome/DNA complex (lipoplex) formation. | Identifies charge-neutralization point, indicating complete complexation. |
Experimental Protocol: Measuring Zeta Potential of LNPs in Phosphate-Buffered Saline (PBS)
Objective: To determine the zeta potential of an mRNA-LNP formulation in physiologically relevant PBS buffer using LDV-PALS.
Materials & Reagents (The Scientist's Toolkit):
| Item | Function |
|---|---|
| Zeta Potential Analyzer | Instrument with PALS capability (e.g., Malvern Zetasizer Nano ZSP). Measures electrophoretic mobility. |
| Disposable Capillary Cells | Folded capillary zeta cells (e.g., DTS1070). Electrodes are integrated; sample volume required is ~750 µL. |
| PBS Buffer (1x, pH 7.4) | High-conductivity (~15 mS/cm) physiological medium. Simulates in vivo conditions. |
| mRNA-LNP Sample | Purified nanoparticle suspension at a recommended concentration of 0.1-1 mg/mL lipid. |
| Deionized Water | For rinsing cells. Resistivity > 18.2 MΩ·cm. |
| Syringe & 0.22 µm Filter | For degassing and filtering buffer to remove dust. |
Procedure:
- Sample Preparation: Dilute the stock LNP suspension in filtered PBS to achieve a final lipid concentration of ~0.2 mg/mL. Ensure sample is free of bubbles or large aggregates. Note: Do not use ultrasonic baths for mixing.
- Instrument Setup: Power on the instrument and software. Set temperature to 25°C. Allow laser to warm up for 15-30 minutes.
- Cell Loading: Using a pipette, rinse the folded capillary cell twice with ~1 mL of deionized water. Then, rinse once with ~1 mL of filtered PBS. Load the LNP sample into the cell via the ports using a pipette, avoiding air bubbles. Insert the cell into the instrument holder.
- Measurement Parameters: In software, set: Technique: Zeta potential. Material: Lipid (refractive index 1.45, absorption 0.01). Dispersant: Water (or PBS; dielectric constant 80.4, viscosity 0.8872 cP). Measurement Model: General Purpose (PALS). Apply voltage automatically determined by software (typically 40-150 V). Number of runs: 3-12. Measurement duration: automatic.
- Data Acquisition: Initiate measurement. The instrument applies an alternating field, and the PALS detector analyzes phase shifts to calculate electrophoretic mobility.
- Data Analysis: Software uses the Henry equation (Smoluchowski approximation, f(Ka)=1.5) to convert mobility to zeta potential. Report the average and standard deviation of the zeta potential (in mV) from at least three independent measurements.
Representative Data Table
Table 1: Zeta Potential Measurements of Different Nanoparticle Formulations in Various Media Using LDV-PALS.
| Nanoparticle Type | Surface Coating | Dispersion Medium | Conductivity (mS/cm) | Mean Zeta Potential (mV) ± SD | Key Interpretation |
|---|---|---|---|---|---|
| Lipid Nanoparticle | Ionizable lipid, PEG | 1x PBS, pH 7.4 | 15.6 | -2.1 ± 0.8 | Near-neutral charge in PBS, typical for in vivo systemic delivery to reduce clearance. |
| Poly(lactic-co-glycolic acid) | None (plain) | 1 mM KCl | 0.15 | -34.5 ± 1.2 | High negative charge in low salt, indicating good electrostatic stability. |
| Poly(lactic-co-glycolic acid) | Chitosan | 1 mM KCl | 0.15 | +42.3 ± 2.1 | Successful cationic coating confirmed by charge reversal. |
| Gold Nanoparticle | Citrate | 10 mM NaCl | 1.2 | -38.1 ± 0.9 | Stable due to high surface charge. |
| Gold Nanoparticle | Citrate + 10% FBS | 10 mM NaCl | ~12.0 | -15.7 ± 1.5 | Charge reduction indicates formation of a protein corona. |
Diagrams
Within the broader thesis research on measuring zeta potential for nanoparticle surface charge characterization, sample preparation is the most critical determinant of data accuracy and reproducibility. Inadequate preparation leads to aggregation, contamination, and multiple scattering events, rendering zeta potential measurements meaningless. This protocol details the standardized steps for dilution, dispersion, and filtration required to produce a stable, monodisperse, and contaminant-free colloidal suspension suitable for dynamic light scattering (DLS) and electrophoretic light scattering (ELS) analysis.
Application Notes
- Dilution: The primary diluent must match the ionic strength and pH of the intended application or storage buffer. Deionized water is often inappropriate as it can disrupt nanoparticle stability via the "charge shock" effect. The target concentration for zeta potential analysis is typically 0.1-1 mg/mL, depending on material, to achieve an optimal scattering intensity without signal saturation (attenuation factor < 10).
- Dispersion: The goal is to break apart soft aggregates without damaging primary particles. Sonication energy must be calibrated; excessive energy can fragment particles or denature surface ligands, altering the very surface charge under investigation.
- Filtration: This step removes dust and large aggregates that contribute to spurious scattering. Membrane compatibility is essential; cellulose acetate or polyethersulfone (PES) membranes are preferred for aqueous samples to minimize analyte adsorption.
Table 1: Key Quantitative Parameters for Sample Preparation
| Parameter | Optimal Range | Rationale & Notes |
|---|---|---|
| Final Concentration | 0.1 - 1 mg/mL | Ensures sufficient scattered light intensity while minimizing multiple scattering and inter-particle interactions. |
| Conductivity | < 3 mS/cm | High conductivity generates excessive heat during electrophoresis measurement. Use dilution or dialysis if necessary. |
| Attenuator Index | 7 - 9 (on standard instruments) | Indicates ideal scattering intensity for measurement. Adjust via dilution. |
| Sonication Time (Bath) | 1-5 minutes | For gentle de-agglomeration. Must be empirically determined for each sample. |
| Sonication Time (Probe) | 10-30 seconds (pulsed) | High risk of sample degradation. Use low energy and pulse cycles (e.g., 5s on, 10s off). |
| Filtration Pore Size | 0.1 µm or 0.22 µm | Removes particulates >100nm that interfere with DLS. For sub-100nm nanoparticles, 0.1 µm is mandatory. |
| Sample Volume Required | ≥ 1 mL | Minimum volume for proper circulation in standard cuvette-based systems. |
Experimental Protocols
Protocol 1: Dilution for Isoelectric Point (pI) Determination
Objective: To prepare a series of samples at constant nanoparticle concentration across a broad pH range for zeta potential vs. pH titration. Materials: Stock nanoparticle suspension, 1 mM KCl or NaCl solution (low ionic strength), 0.1M HCl, 0.1M NaOH, pH meter. Procedure:
- Prepare a 500 mL volume of 1 mM KCl solution as the universal diluent.
- Dilute the stock nanoparticle suspension with the 1 mM KCl to a standard concentration (e.g., 0.5 mg/mL). This is the "master dilution."
- Aliquot 10 mL of the master dilution into each of ten 15 mL tubes.
- Using 0.1M HCl or 0.1M NaOH, adjust the pH of each aliquot incrementally across the desired range (e.g., pH 3 to 12). Record final pH precisely.
- Allow samples to equilibrate for 5 minutes after pH adjustment before measurement.
- Measure zeta potential immediately after pH equilibration.
Protocol 2: Ultrasonic Dispersion of Nanoparticle Aggregates
Objective: To achieve a monodisperse suspension without altering primary particle properties. Materials: Bath or probe sonicator, sample vial, water (for bath), ice bath. Procedure for Bath Sonication (Preferred for fragile samples):
- Place the diluted sample in a sealed vial.
- Partially submerge the vial in the bath sonicator, ensuring the water level is near the sample level.
- Sonicate at a controlled temperature (25°C) for 2 minutes.
- Invert the vial gently and sonicate for an additional 2 minutes.
- Proceed immediately to measurement or filtration. Procedure for Probe Sonication (For strongly aggregated samples):
- Place the sample vial in an ice bath.
- Insert the probe, ensuring it is centered and ~1 cm from the bottom of the vial.
- Sonicate using a pulsed protocol: 10 seconds of sonication at 30% amplitude, followed by 20 seconds of rest. Repeat for 3-5 cycles.
- Allow the sample to cool to room temperature before measurement.
Protocol 3: Syringe Filtration for Clarification
Objective: To remove dust and aggregates prior to analysis. Materials: Disposable syringe (1-5 mL), low-protein binding syringe filter (0.22 µm or 0.1 µm pore size, PES membrane). Procedure:
- Gently invert the diluted and dispersed sample to mix.
- Draw the sample into the syringe. Do not force air through the filter.
- Attach the syringe filter and gently depress the plunger to discard the first 0.2 mL of filtrate (saturates membrane binding sites).
- Continue to depress the plunger and collect the clarified filtrate in a clean, particle-free vial.
- Cap the vial and perform zeta potential measurement promptly.
Visualizations
Workflow for Zeta Potential Sample Prep
Prep Quality Determines Data Validity
The Scientist's Toolkit: Essential Reagents & Materials
Table 2: Key Research Reagent Solutions for Sample Preparation
| Item | Function & Rationale |
|---|---|
| Low Ionic Strength Buffer (e.g., 1 mM KCl) | Provides controlled ionic environment for electrophoresis without masking surface charge or generating excessive heat. |
| pH Adjusters (HCl/NaOH, dilute) | For precise titration in pI determination studies. Must be prepared in same low-ionic-strength diluent. |
| Disposable Syringe Filters (0.22 µm PES) | Removes dust and aggregates. PES membrane minimizes nanoparticle adsorption vs. nylon or cellulose. |
| Ultrasonic Bath (with temp control) | For gentle, uniform energy input to break apart soft aggregates without damaging primary particles. |
| Particle-Free Cuvettes & Vials | Pre-cleaned, disposable plastic or quartz cuvettes prevent cross-contamination and spurious scattering. |
| Zeta Potential Transfer Standard (e.g., -50 mV latex) | Validates instrument performance and sample handling technique prior to running experimental samples. |
| Disposable Syringes (1-5 mL) | For sample handling and filtration. Prevents cross-contamination between samples. |
Within the broader thesis on measuring zeta potential for nanoparticle surface charge research, precise instrument calibration is paramount. Accurate zeta potential values are critical for understanding colloidal stability, surface functionalization, and biodistribution in drug development. This application note details the optimization of three key electrophoretic light scattering (ELS) parameters: applied voltage, attenuator setting, and measurement position, to ensure reproducible and reliable data for nanoparticle characterization.
Optimization balances signal quality with measurement integrity. Excessive voltage can cause particle polarization, Joule heating, and bubble formation, while insufficient voltage yields a poor signal-to-noise ratio. The attenuator controls incident laser intensity to prevent detector saturation. Measurement position (within the capillary cell) must avoid electroosmotic flow zones.
Table 1: Optimization Guidelines for Common Nanoparticle Types
| Nanoparticle Type | Typical Size Range | Recommended Voltage Range (V) | Attenuator Setting (Recommended) | Optimal Measurement Position |
|---|---|---|---|---|
| Polymeric NPs (PLGA, PLA) | 50-200 nm | 100-150 V | Medium-High (7-9) | Stationary level 2 (Near cell wall) |
| Lipid NPs (LNPs, Liposomes) | 70-150 nm | 120-180 V | Medium (5-7) | Stationary level 1 (Middle of cell) |
| Metallic NPs (Au, Ag) | 10-100 nm | 80-120 V | Low-Medium (3-6) | Stationary level 2 (Near cell wall) |
| Silica NPs | 20-300 nm | 100-150 V | Medium (5-8) | Stationary level 1 or 2 |
| Protein/Protein Aggregates | 5-50 nm | 150-200 V | High (8-10) | Stationary level 1 (Middle of cell) |
Note: Settings are instrument-dependent (e.g., Malvern Zetasizer Nano series). Voltages are for standard dip cells. Always perform initial diagnostics.
Experimental Protocols
Protocol 1: Systematic Optimization of Voltage and Attenuator
Objective: To determine the ideal voltage and attenuator combination for a stable, high-quality zeta potential measurement.
Materials:
- Zeta potential analyzer (e.g., Malvern Zetasizer Nano ZSP)
- Clear disposable zeta cell (DTS1070)
- Nanoparticle sample in appropriate buffer (≥ 1 mL)
- Syringes (1 mL) and 0.2 μm filters (aqueous) or 0.02 μm filters (organic)
Method:
- Sample Preparation: Filter nanoparticle dispersion into a clean vial using a syringe filter appropriate for the dispersant. Load sample into zeta cell via syringe, ensuring no bubbles.
- Instrument Setup: Equilibrate cell in instrument to 25°C for 120 seconds. Set measurement position to the default "stationary level 1".
- Initial Diagnostic: Run a "Zeta Potential Measurement Diagnostic" to obtain a recommended voltage and attenuator range. Note the initial count rate (kilo counts per second, kcps).
- Attenuator Sweep: Fix the voltage at the manufacturer's recommended value (e.g., 150 V). Perform a series of measurements, incrementally increasing the attenuator from its lowest to highest setting. Record the measured count rate and quality factor (or peak width) for each run.
- Voltage Sweep: Set the attenuator to the value that yields a count rate between 200-600 kcps (ideal range for most detectors). Perform a series of measurements, varying the applied voltage in 20 V steps from 80 V to 200 V. Record zeta potential, conductivity, and quality factor.
- Optimal Point Selection: The optimal settings are where the zeta potential value plateaus (becomes independent of small changes in voltage/attenuator), the count rate is stable and within the ideal range, and the measured peak width is narrow.
Protocol 2: Determination of Optimal Measurement Position
Objective: To identify the measurement position within the cell that minimizes interference from electroosmotic flow (EOF).
Materials: As per Protocol 1.
Method:
- Sample Preparation: Prepare a standard nanoparticle dispersion (e.g., 50 nm polystyrene latex in 1 mM NaCl). This provides a known zeta potential (~ -50 mV).
- Baseline Measurement: Using settings optimized from Protocol 1, measure the zeta potential at the default position (e.g., stationary level 1). Record the value.
- Positional Scan: Manually change the measurement position (e.g., to stationary level 2, then level 3, or use the "Zeta Potential Positioning" function). At each new position, allow 60 seconds for temperature re-equilibration before measurement.
- Data Analysis: Plot measured zeta potential vs. measurement position. The optimal position is where the measured zeta potential of the standard matches its certified value and shows minimal variation (± 2 mV) across consecutive positions. This position should then be used for all subsequent measurements of unknown samples in that specific cell/buffer system.
Visualization of Workflow and Relationships
Diagram Title: Zeta Potential Instrument Optimization Workflow
Diagram Title: Interaction of Key Optimization Parameters
The Scientist's Toolkit: Research Reagent Solutions
Table 2: Essential Materials for Zeta Potential Optimization Experiments
| Item | Function & Importance in Optimization |
|---|---|
| Standard Zeta Potential Transfer Standard (e.g., -50 mV ± 5 mV polystyrene latex) | Validates instrument performance and measurement position. Provides a known reference to confirm optimized settings. |
| Disposable Capillary Zeta Cells (e.g., DTS1070) | Eliminates cross-contamination. Consistent cell geometry is crucial for reproducible voltage gradients and measurement positions. |
| Syringe Filters (0.2 µm PES for aqueous, 0.02 µm Anodisc for organic) | Critical for removing dust and aggregates that cause spurious scattering and affect attenuator/voltage settings. |
| Low-Volume Cuvettes (for sizing correlation) | Accurate particle size (from DLS) is required for Henry's function calculation in zeta potential determination. |
| High-Purity Salts & Buffers (e.g., NaCl, PBS, Tris, HEPES) | Control ionic strength and pH. Conductivity must be monitored during voltage optimization to ensure stability. |
| Non-Invasive Back-Scatter (NIBS) Optics Module | Standard in modern instruments. Allows measurement at the optimal position inside the cell without optical distortion. |
| Temperature-Controlled Sample Chamber | Essential for stable viscosity and dielectric constant calculations. Temperature fluctuations alter mobility and measured zeta potential. |
Standard Operating Procedure for Liposomes, Polymeric NPs, and Inorganic NPs
This document details standard operating procedures (SOPs) for the preparation and characterization of three major nanoparticle (NP) classes—liposomes, polymeric NPs, and inorganic NPs—within the context of a thesis investigating zeta potential measurement for nanoparticle surface charge research. Accurate surface charge characterization is critical for predicting NP stability, biodistribution, cellular uptake, and efficacy in drug delivery applications. These protocols are designed to yield NPs with consistent properties suitable for comparative zeta potential analysis.
Liposome Preparation and Characterization
Key Research Reagent Solutions
| Reagent/Material | Function in Liposome Formation |
|---|---|
| Phosphatidylcholine (e.g., DOPC) | Primary phospholipid forming the bilayer structure. |
| Cholesterol | Modulates membrane fluidity and stability. |
| Stearylamine or Dicetyl phosphate | Positively or negatively charged lipid for surface charge modification. |
| Chloroform/Methanol (2:1 v/v) | Organic solvent for lipid dissolution. |
| Phosphate Buffered Saline (PBS), pH 7.4 | Aqueous hydration medium. |
| Polycarbonate membranes (100 nm, 50 nm) | For extrusion to control liposome size. |
Detailed Protocol: Thin-Film Hydration & Extrusion
Objective: Prepare unilamellar liposomes of ~100 nm for zeta potential comparison.
- Lipid Film Formation: Dissolve phosphatidylcholine, cholesterol, and stearylamine (for positive charge) in a 2:1 chloroform:methanol mixture in a round-bottom flask. Evaporate solvent using a rotary evaporator (40°C) to form a thin, dry lipid film.
- Hydration: Hydrate the dried lipid film with PBS (pH 7.4) at a temperature above the lipid's phase transition temperature (e.g., 50°C for DOPC) for 1 hour with gentle agitation.
- Size Reduction: Subject the multilamellar vesicle suspension to 5 freeze-thaw cycles (liquid nitrogen/50°C water bath). Subsequently, extrude the suspension 21 times through a series of polycarbonate membranes (e.g., 400 nm, then 100 nm) using a hand-held extruder.
- Purification: Purify the resulting unilamellar liposomes via dialysis (12-14 kDa MWCO) against PBS for 2 hours to remove unencapsulated materials.
Characterization Data (Typical Results)
| Parameter | Method | Target/Expected Outcome |
|---|---|---|
| Size (PDI) | Dynamic Light Scattering (DLS) | 100 ± 20 nm (PDI < 0.15) |
| Zeta Potential | Electrophoretic Light Scattering (ELS) | +35 mV to +45 mV (with stearylamine) |
| Morphology | Transmission Electron Microscopy (TEM) | Spherical, unilamellar vesicles |
Polymeric Nanoparticle Preparation and Characterization
Key Research Reagent Solutions
| Reagent/Material | Function in Polymeric NP Formation |
|---|---|
| Poly(lactic-co-glycolic acid) (PLGA) | Biodegradable copolymer forming the NP matrix. |
| Polyvinyl alcohol (PVA) | Stabilizer and emulsifying agent. |
| Dichloromethane (DCM) or Ethyl Acetate | Organic solvent for polymer dissolution. |
| Acetone | Water-miscible solvent for nanoprecipitation. |
| Pluronic F-68 | Non-ionic surfactant for stabilization. |
Detailed Protocol: Single Emulsion-Solvent Evaporation
Objective: Prepare negatively charged PLGA NPs of ~150 nm.
- Organic Phase: Dissolve 50 mg PLGA in 2 mL of dichloromethane (DCM).
- Aqueous Phase: Prepare 4 mL of a 2% (w/v) PVA solution in ultrapure water.
- Emulsification: Add the organic phase to the aqueous phase and emulsify using a probe sonicator (70% amplitude, 60 seconds on ice) to form an oil-in-water (o/w) emulsion.
- Solvent Evaporation: Stir the emulsion overnight at room temperature to evaporate DCM and harden the NPs.
- Washing & Collection: Centrifuge the NP suspension at 20,000 x g for 20 minutes. Wash the pellet three times with ultrapure water to remove excess PVA. Resuspend in water or buffer for characterization.
Characterization Data (Typical Results)
| Parameter | Method | Target/Expected Outcome |
|---|---|---|
| Size (PDI) | DLS | 150 ± 30 nm (PDI < 0.2) |
| Zeta Potential | ELS | -20 mV to -30 mV (due to PLGA carboxyl termini) |
| Morphology | TEM | Spherical, solid particles |
Inorganic Nanoparticle Preparation and Characterization
Key Research Reagent Solutions
| Reagent/Material | Function in Inorganic NP Formation |
|---|---|
| Gold(III) chloride trihydrate (HAuCl₄·3H₂O) | Gold precursor for synthesis. |
| Trisodium citrate dihydrate | Reducing and stabilizing agent for AuNPs. |
| Tetraethyl orthosilicate (TEOS) | Silica precursor for coating. |
| (3-Aminopropyl)triethoxysilane (APTES) | Amine-functionalizing agent for surface charge modification. |
| Ammonium hydroxide (NH₄OH) | Catalyst for silica formation. |
Detailed Protocol: Citrate-Reduced Gold NPs (AuNPs) & Silica Coating
Objective: Prepare amine-functionalized silica-coated AuNPs of ~80 nm core-shell.
- AuNP Synthesis (Turkevich Method): Bring 100 mL of 1 mM HAuCl₄ to a rolling boil under reflux. Rapidly add 10 mL of 38.8 mM trisodium citrate with vigorous stirring. Continue heating and stirring until the solution turns deep red (~10 mins). Cool to room temperature.
- Silica Coating (Stöber Method): Transfer 10 mL of AuNPs to ethanol. Add 0.5 mL of NH₄OH (28%) and 50 µL of APTES under stirring. After 15 minutes, add 100 µL of TEOS dropwise. Stir for 2 hours. Centrifuge (10,000 x g, 15 min) and wash with ethanol.
- Surface Functionalization: The APTES co-condensation introduces surface amine groups, conferring a positive charge.
Characterization Data (Typical Results)
| Parameter | Method | Target/Expected Outcome |
|---|---|---|
| Core Size | TEM | 15-20 nm Au core |
| Hydrodynamic Size (PDI) | DLS | 80 ± 10 nm (PDI < 0.1) |
| Zeta Potential | ELS | +25 mV to +35 mV (amine-functionalized) |
Universal Protocol: Zeta Potential Measurement via Electrophoretic Light Scattering (ELS)
SOP for Measurement
- Sample Preparation: Dilute NP suspension in the same buffer used for purification/storage (e.g., 1 mM KCl, PBS) to achieve a concentration suitable for light scattering (typically 0.1-1 mg/mL). Avoid high salt concentrations (>50 mM).
- Instrument Calibration: Use a standard zeta potential reference material (e.g., -50 mV ± 5 mV) to calibrate the instrument (Zetasizer Nano series, Malvern Panalytical).
- Measurement Settings: Load sample into a clear disposable zeta cell. Set temperature to 25°C, equilibration time 120 seconds. Perform at least 3 consecutive measurements with >10 sub-runs each.
- Data Analysis: Report the mean zeta potential and standard deviation from triplicate samples. Use Smoluchowski or Hückel approximation (as per instrument software recommendation based on particle size and conductivity).
Critical Factors for Thesis Research
- Buffer Choice: Use low ionic strength buffers (e.g., 1 mM KCl) to prevent compression of the electrical double layer.
- pH Control: Measure zeta potential across a pH range (e.g., 3-10) to determine the isoelectric point (IEP), a key thesis variable.
- Contamination: Ensure cells are meticulously cleaned to avoid particulate contamination affecting results.
Diagrams for Experimental Workflows
Title: Liposome Preparation and Analysis Workflow
Title: Polymeric Nanoparticle Synthesis Workflow
Title: Zeta Potential Measurement Decision Logic
Within the broader thesis on measuring zeta potential for nanoparticle surface charge research, a critical challenge is performing accurate measurements in biologically relevant, complex media such as serum and phosphate-buffered saline (PBS). These media present high ionic strength, viscosity, and interfering proteins/particles, complicating electrophoretic mobility analysis. These application notes detail protocols and considerations for overcoming these obstacles to obtain reliable zeta potential data.
Key Challenges & Considerations
- High Conductivity: Media like PBS (150 mM NaCl) generate high ionic strength, leading to excessive sample current, joule heating, and data artifacts.
- Protein Adsorption: Serum proteins (e.g., albumin) rapidly adsorb onto nanoparticles, forming a protein corona that masks the original surface charge.
- Multi-Particle Systems: Biological media contain endogenous particles (lipoproteins, exosomes) that can be erroneously detected alongside the target nanoparticles.
- Optical Interference: Complex media can scatter light intensely, making laser-based detection difficult.
Experimental Protocols
Protocol 3.1: Sample Preparation for Serum-Based Measurements
Objective: To prepare nanoparticle dispersions in serum for zeta potential measurement while minimizing artifacts. Materials: Target nanoparticles, fetal bovine serum (FBS), compatible dispersion buffer, syringe filters (0.45 µm, 0.1 µm), disposable zeta cells. Procedure:
- Pre-dilution of Serum: Dilute the stock serum to 10% v/v in an isotonic, low-conductivity buffer (e.g., 1 mM NaCl or 1 mM HEPES, pH 7.4). This reduces conductivity and viscosity.
- Nanoparticle Introduction: Add a concentrated stock of nanoparticles to the 10% serum medium under gentle vortexing. Final nanoparticle concentration should be optimized for the instrument's detection range (typically 0.1-1 mg/mL for many inorganic nanoparticles).
- Incubation: Incubate the mixture at 37°C for 15-60 minutes to allow for protein corona formation, if studying this state.
- Clarification: Centrifuge the sample at 2,000 x g for 5 minutes to pellet large aggregates. Carefully collect the supernatant.
- Final Preparation: Load the supernatant directly into a pre-rinsed (with sample) disposable capillary flow cell. Avoid filtration post-corona formation unless using large pore size (e.g., 0.45 µm) to avoid stripping corona.
Protocol 3.2: Measurement in High Ionic Strength Media (e.g., PBS)
Objective: To measure zeta potential in conductive buffers like PBS using specialized techniques. Materials: Nanoparticles in PBS, diluent (deionized water or 1 mM KCl), laser Doppler electrophoresis instrument with current-monitoring capability. Procedure:
- Dilution Method (Preferred):
- Perform a serial dilution of the nanoparticle-PBS dispersion with deionized water (e.g., 1:2, 1:5, 1:10).
- Measure the zeta potential at each dilution.
- Plot zeta potential vs. conductivity (or inverse dilution factor). Extrapolate the measured values back to the conductivity of pure PBS to estimate the in-situ zeta potential.
- Direct Measurement with Attenuated Field:
- Use instrument settings that apply a lower voltage or utilize a "high-conductivity zeta cell" to keep measured current below the manufacturer's maximum safe limit (typically 20-30 mA).
- Increase the number of measurement runs/shorten the run duration to mitigate heat buildup.
- Always monitor the current trace for spikes or instability indicating electrode polarization or bubble formation.
Data Presentation
Table 1: Comparative Zeta Potential of Polystyrene Nanospheres in Different Media
| Media Composition | Measured Zeta Potential (mV) | Apparent Size (DLS, nm) | Conductivity (mS/cm) | Key Observation |
|---|---|---|---|---|
| 1 mM KCl (reference) | -45.2 ± 1.5 | 102 ± 3 | 0.15 | Stable, monomodal peak |
| 1X PBS (direct) | -5.1 ± 3.2 | 115 ± 25 | 16.5 | High noise, poor fit quality |
| 1X PBS (10-fold diluted) | -8.5 ± 1.8 | 105 ± 5 | 1.8 | Improved quality, extrapolates to ~-4.5 mV |
| 10% FBS in 1 mM HEPES | -12.8 ± 0.9 | 125 ± 8 | 1.2 | Negative shift due to protein adsorption |
| 100% FBS (filtered) | -10.5 ± 2.1 | Not measurable | 12.8 | Very high background scattering |
Table 2: Essential Research Reagent Solutions & Materials
| Item | Function/Explanation |
|---|---|
| Disposable Capillary Zeta Cells | Prevents cross-contamination and protein carryover between samples. Essential for serum work. |
| Syringe Filters (0.1 µm PES) | For pre-filtration of buffers and media to remove dust particles prior to nanoparticle addition. |
| 0.45 µm Pore Filters | For clarifying serum or protein-containing samples without removing large protein-nanoparticle complexes. |
| Standardized Zeta Reference | (e.g., -50 mV polystyrene nanospheres). Validates instrument performance in simple buffers before complex media runs. |
| Low-Conductivity Diluent | (e.g., 1 mM KCl, 1 mM NaCl, 1 mM HEPES). Reduces sample conductivity for improved measurement fidelity. |
| Diluted Serum Protocols | (e.g., 10% FBS). Reduces viscosity and optical density while maintaining key protein corona components. |
Visualization of Workflows
Title: Nanoparticle Zeta Potential Measurement Workflow in Serum
Title: Extrapolation Method for Zeta Potential in High-Conductivity PBS
Within the framework of a thesis on measuring zeta potential for nanoparticle surface charge research, robust data collection is paramount. The accuracy and reliability of zeta potential values—critical for understanding colloidal stability, surface functionalization, and in-vivo behavior in drug delivery—depend heavily on experimental design. This protocol details best practices for determining optimal run counts, measurement durations, and biological/technical replicates to produce statistically defensible data.
Core Quantitative Guidelines for Dynamic Light Scattering (DLS) & Electrophoretic Light Scattering (ELS)
The following table summarizes evidence-based recommendations for data collection parameters in zeta potential analysis of nanoparticles.
Table 1: Recommended Data Collection Parameters for Zeta Potential Measurement
| Parameter | Recommended Value | Rationale & Key Considerations |
|---|---|---|
| Run Count (per measurement) | 10 - 15 runs | Balances signal averaging (reduces noise) with minimizing sample degradation from prolonged laser exposure. For polydisperse samples, increase to 20-30 runs. |
| Duration per Run | 10 - 15 seconds | Sufficient for obtaining a stable phase plot. Auto-attenuation of laser power should be enabled to prevent photobleaching or heating. |
| Measurement Repeats (Technical Replicates) | Minimum 3 independent measurements (with cell rinsing/reloading) | Accounts for instrument variability and positioning artifacts within the capillary cell. |
| Sample Replicates (Biological/Process Replicates) | Minimum N=3 independently prepared samples | Essential for capturing variability in nanoparticle synthesis, coating, or biofluid incubation. Required for any statistical comparison. |
| Total Minimum Observations | ≥ 9 data points (3 samples x 3 measurements) | Provides baseline for calculating mean, standard deviation (SD), and standard error of the mean (SEM). For publication, N≥5 samples is advised. |
| Acceptable Zeta Potential Deviation (SD) | < 5 mV for monodisperse, stable systems | High SD (> 10 mV) indicates instability, aggregation, poor cleanliness, or insufficient equilibration. |
Detailed Experimental Protocols
Protocol 1: Standard Operating Procedure for Zeta Potential Measurement
Objective: To determine the surface charge (zeta potential) of a nanoparticle suspension with statistical rigor.
Materials & Reagents:
- Nanoparticle suspension (≥ 1 mL at appropriate concentration for DLS)
- Appropriate electrolyte (e.g., 1 mM KCl) or relevant biological buffer (e.g., PBS, HEPES)
- Disposable zeta potential capillary cells (clear, folded)
- Syringes and 0.22 µm or 0.02 µm filters (aqueous/organic compatible)
- pH meter and standards
- Zeta potential analyzer (e.g., Malvern Zetasizer Nano, Beckman Coulter DelsaMax, Horiba SZ-100)
Procedure:
- Sample Preparation:
- Dialyze or dilute the nanoparticle sample into a low-conductivity electrolyte (1 mM KCl, pH adjusted) if possible, to minimize thermal effects during measurement. For biologically relevant conditions, use the desired buffer but note higher conductivity will reduce measurement precision.
- Filter all buffers through a 0.22 µm filter.
- Adjust and record the sample pH precisely. Allow the sample to equilibrate at the measurement temperature (typically 25°C) for 2 minutes in the instrument.
Cell Loading & Instrument Setup:
- Rinse the capillary cell thoroughly with filtered deionized water, then with filtered measurement buffer.
- Load the sample into the cell using a syringe, avoiding introduction of air bubbles.
- Insert the cell into the instrument thermostat chamber and allow temperature equilibration (2 min).
- Set the instrument software to "Zeta Potential" mode.
Software Parameter Configuration:
- Material: Set correct dispersant refractive index and viscosity.
- Temperature: 25.0 °C (or as required).
- Equilibration Time: 120 seconds.
- Run Count: Set to 12 runs as a starting point.
- Automatic Attenuation Selection: Enable.
- Number of Measurements: Set to "3" for technical replicates. The software will perform three sequential measurement cycles.
Data Collection & Replication:
- Initiate the measurement series.
- Upon completion, rinse the cell thoroughly and reload a fresh aliquot of the same sample. Repeat the 3-measurement cycle twice more. This yields 3 technical replicates (9 total measurement cycles).
- Repeat the entire process for two additional, independently prepared batches of the same nanoparticle formulation. This yields N=3 biological/process replicates.
Data Analysis:
- The instrument software will report the zeta potential (mean and SD) for each measurement cycle.
- Calculate the mean and SD of all technical replicates for one sample batch.
- Finally, calculate the grand mean, SD, and SEM from the averaged values of the N=3 independent sample batches. Report as Mean ζ ± SEM.
Protocol 2: Protocol for Determining Optimal Run Count & Duration
Objective: To empirically determine the ideal number of runs and duration per run for a new nanoparticle system.
Procedure:
- Prepare a stable, monodisperse nanoparticle sample (e.g., 100 nm polystyrene standard).
- Set the run duration to 10 seconds. Perform a measurement series incrementing the run count from 3 to 30.
- Record the reported zeta potential and derived "Quality" or "Peak Width" parameter from the phase plot for each run count.
- Plot Zeta Potential vs. Run Count and Peak Width vs. Run Count.
- Identify the run count where zeta potential plateaus and peak width is minimized. This is the optimal run count for this sample type.
- Repeat with varying run durations (5, 10, 15, 20 sec) at the optimal run count to find the combination that yields the lowest standard deviation.
The Scientist's Toolkit: Research Reagent Solutions
Table 2: Essential Materials for Robust Zeta Potential Research
| Item | Function & Importance |
|---|---|
| Disposable Zeta Cells (Folded Capillary) | Ensure consistent cell geometry and surface properties, eliminate cross-contamination, and simplify cleaning. |
| Certified Zeta Potential Transfer Standard (e.g., -50 mV ± 5 mV) | Validates instrument performance and measurement protocol accuracy on a regular basis. |
| Low-Volume Filter Syringes (0.22 µm, 0.02 µm) | Critical for removing dust and particulates from buffers and samples, which are a primary source of spurious results. |
| Precision pH Meter & Standard Buffers | Zeta potential is exquisitely sensitive to pH. Accurate measurement and adjustment of sample pH is non-negotiable. |
| High-Purity Salts (KCl, NaCl) & Buffers | Use analytical grade or better to minimize ionic contaminants that can adsorb onto nanoparticle surfaces. |
| Temperature-Controlled Sample Chamber | Maintains sample at a constant temperature (± 0.1°C), as electrophoretic mobility is temperature-dependent. |
Workflow and Relationship Diagrams
Title: Zeta Potential Data Collection Workflow
Title: Zeta Potential Role in Nanoparticle Research Thesis
Solving Common Zeta Potential Problems: Artifacts, Errors, and How to Fix Them
In the measurement of zeta potential for nanoparticle surface charge research, the quality of the autocorrelation function (ACF) fit is paramount. An improper fit directly leads to inaccurate size and zeta potential distributions, compromising data integrity for drug development and material science. This note details the diagnosis of poor fits and protocols for obtaining reliable data.
Quantitative Data on Correlation Function Quality Indicators
The following table summarizes key quantitative parameters that distinguish a good fit from a poor one.
| Parameter | Good Fit Indicator | Poor Fit Indicator | Impact on Zeta Potential Result |
|---|---|---|---|
| Baseline Deviation | < ±0.1% | > ±1% | Significant baseline error introduces bias in decay rate, affecting calculated mobility. |
| Residuals (RMS) | Random scatter, RMS < 0.001 | Structured pattern (e.g., sinusoidal), RMS > 0.01 | Non-random residuals indicate model failure, leading to erroneous distribution modes. |
| Chi-squared (χ²) | 0.8 < χ² < 1.2 | χ² < 0.5 or χ² > 2.0 | Poor goodness-of-fit statistic invalidates the chosen scattering model. |
| Signal-to-Noise Ratio (SNR) | > 50 | < 10 | Low SNR increases fit ambiguity, causing large confidence intervals on reported values. |
| Fit Confidence Interval | Narrow (e.g., ± 2 mV) | Very wide (e.g., ± 15 mV) | Indicates high uncertainty; results are not statistically robust. |
Common Causes & Diagnostic Protocol
Protocol: Diagnosing Poor ACF Fits in Dynamic Light Scattering (DLS) / Electrophoretic Light Scattering (ELS)
- Objective: Systematically identify the root cause of a poor-quality correlation function fit.
- Materials: Zeta potential analyzer (e.g., Malvern Zetasizer, Horiba SZ-100), clean cuvettes/disposable capillary cells, appropriate buffer, sample.
- Procedure: a. Acquire Raw ACF: Perform a standard measurement. Export the raw correlation function data. b. Visual Inspection of ACF Plot: * Check for smooth, mono-exponential decay. A noisy or multi-phasic decay suggests polydisperse or aggregated samples, low concentration, or contaminating dust. c. Analyze Residuals Plot: * Fit the ACF using the instrument software (e.g., Non-Invasive Back-Scatter optics algorithm). * Examine the residuals (difference between data and fit). Randomly scattered residuals indicate a good fit. A systematic pattern (e.g., waves) indicates a poor model fit, often due to sample complexity. d. Review Quality Parameters: * Record the baseline, chi-squared, and SNR values from the software report. Compare to the "Good Fit Indicator" column in Table 1. e. Correlate with Result Spectrum: * A poor fit often manifests as a broad, multimodal, or erratic zeta potential distribution.
- Diagnosis & Action: Based on the diagnostics:
- Structured Residuals & High χ²: Likely sample polydispersity or aggregation. Proceed to Protocol: Sample Preparation for Reliable Zeta Potential.
- Low SNR & Noisy ACF: Likely low particle concentration or weak scattering. Optimize concentration.
- Baseline Error: Instrument misalignment or dirty optics/cuvette. Perform maintenance and alignment checks.
Flowchart for Diagnosing Poor ACF Fits
Protocol: Sample Preparation for Reliable Zeta Potential Measurement
Objective: Prepare a stable, monodisperse nanoparticle suspension to ensure a high-quality ACF fit.
- Purification: Dialyze or ultrafilter the nanoparticle dispersion against a low-ionic-strength buffer (e.g., 1 mM KCl) to remove excess ions and unbound stabilizers. Change buffer 3-5 times over 24 hours.
- Filtration: Filter the final dispersion and the buffer through a 0.1 µm or 0.22 µm syringe filter (non-protein adsorbing, e.g., PVDF) directly into a cleaned measurement cell to remove dust and large aggregates.
- Concentration Optimization: Prepare a dilution series (e.g., 0.1, 0.5, 1.0 mg/mL). Measure each. The ideal concentration yields a photon count rate within the instrument's optimal range (consult manual) and a clean ACF.
- Equilibration: Allow the loaded sample cell to thermally equilibrate in the instrument chamber for at least 2 minutes (or as per manufacturer guidance) before measurement.
- Replication: Perform a minimum of 3-5 sequential measurements to assess reproducibility. Use the average of these runs for reporting.
The Scientist's Toolkit: Key Research Reagent Solutions
| Item | Function & Importance |
|---|---|
| Disposable Zeta Cells (Foldable Capillary) | Ensure consistent path length and electrode positioning; eliminate cross-contamination and cleaning artifacts critical for electrophoretic mobility. |
| Certified Zeta Potential Reference Material (e.g., -50 mV ± 5 mV) | Validates instrument performance and measurement protocol before analyzing unknown samples. |
| Low-Fluorescence, Ultrapure Water (e.g., 18.2 MΩ·cm) | Used for dilution and cleaning to minimize background scatter from impurities. |
| Ionic Strength Adjustors (e.g., KCl, NaCl) | To prepare standard dilute electrolytes (e.g., 1-10 mM) for controlling double layer thickness during measurement. |
| Syringe Filters (0.1 µm PVDF or Nylon) | Critical for final sample and buffer filtration to remove aggregates and dust, the most common cause of poor ACF fits. |
| pH Standard Buffers (pH 4, 7, 10) | For calibrating the pH meter used to adjust and report sample pH, a critical parameter affecting zeta potential. |
Troubleshooting High Polydispersity and Multiple Peaks in the Zeta Distribution
Within the broader thesis on measuring zeta potential for nanoparticle surface charge research, achieving a monomodal, narrow zeta potential distribution is critical for interpreting surface charge homogeneity. High polydispersity and multiple peaks in the zeta distribution complicate analysis, indicating sample heterogeneity, aggregation, or measurement artifacts. This document provides protocols to diagnose and resolve these issues.
Table 1: Diagnostic Signatures of Multiple Peaks in Zeta Distributions
| Peak Profile | Possible Cause | Indicative Size Correlation | Conductivity Clue |
|---|---|---|---|
| Two distinct, sharp peaks | Mixed particle populations (e.g., coated/uncoated, different compositions) | Correlates with distinct size populations in DLS | Often similar between peaks |
| One major, one minor peak (broad) | Presence of aggregates or dimers | Minor peak corresponds to larger hydrodynamic diameter | May show slight variation |
| Single very broad peak | High size polydispersity or unstable particle surface | Continuous spread in size distribution | Often higher or fluctuating |
| Shifting peaks between runs | Electrode polarization or sample sedimentation | Non-reproducible size correlation | May change significantly |
| Peak near 0 mV | Contamination with free polymeric stabilizer or ions | No correlation with particle size | Typically high |
Table 2: Effect of Common Remediation Steps on Distribution Width (Pdi-Z)
| Intervention | Target Issue | Expected Change in Zeta Pdi | Key Parameter to Monitor |
|---|---|---|---|
| Improved Purification (e.g., dialysis) | Excess ions, free polymer | Decrease from >0.3 to <0.2 | Conductivity decrease |
| Filtration (0.22 µm) | Large aggregates | Decrease, removal of minor high-peak | Intensity size distribution |
| Sonication (bath, 5 min) | Soft aggregates | Moderate decrease | Zeta potential mean value stability |
| pH Adjustment (away from IEP) | Aggregation near isoelectric point | Significant decrease | Mean zeta potential magnitude increase |
| Dilution with correct dispersant | Multiple scattering, concentration effects | Decrease | Count rate within instrument's optimal range |
Experimental Protocols
Protocol 1: Systematic Diagnosis of Multiple Peaks
Objective: To identify the root cause of a multimodal zeta distribution. Materials: Zeta potential analyzer with size correlation capability, pH meter, conductivity meter, syringe filters (0.22 µm), ultrasonic bath. Procedure:
- Measure & Correlate: Perform simultaneous DLS and zeta potential measurement. Record intensity-size distribution and zeta potential distribution.
- Check Conductivity: Measure the sample's conductivity. Compare to the dispersant's conductivity. High conductivity (>10 mS/cm) suggests excess ions.
- Visual Inspection: If possible, perform visual inspection for settling or use UV-Vis spectroscopy to check for aggregation shifts.
- Filter & Re-measure: Pass a portion of the sample through a 0.22 µm syringe filter. Repeat measurement (Step 1).
- Sonication: Sonicate another portion in a bath sonicator for 5 minutes. Allow to equilibrate to room temperature. Repeat measurement.
- Dilution Test: Dilute the sample 1:5 and 1:10 with purified water or original buffer. Repeat measurement. Observe if peak positions shift with concentration.
Protocol 2: Sample Preparation Optimization to Minimize Polydispersity
Objective: To prepare a nanoparticle sample yielding a monomodal zeta distribution. Materials: Dialysis tubing (appropriate MWCO), centrifugal filters, or gel filtration columns; appropriate buffer salts; pH adjusters (HCl, NaOH). Procedure:
- Purification: Dialyze the nanoparticle suspension against a low-ionic-strength buffer (e.g., 1 mM KCl) or use centrifugal filtration. Change dialysate 3-4 times over 24-48 hours.
- Buffer Exchange: If using buffers, ensure they are transparent at the measurement wavelength. Prefer volatile buffers (ammonium acetate, ammonium bicarbonate) for later characterization.
- pH Adjustment: Adjust the pH of the purified sample incrementally (e.g., 0.5 pH unit steps) away from the suspected isoelectric point. Measure zeta potential at each step after equilibration.
- Final Filtration: Immediately before measurement, filter the sample using a 0.22 µm syringe filter directly into a clean measurement cell.
- Concentration Optimization: Dilute the sample so the instrument's count rate is within the manufacturer's recommended optimal range (typically 100-500 kcps for many systems).
Diagnostic and Remediation Workflow
Workflow for Diagnosing Zeta Distribution Issues
The Scientist's Toolkit: Research Reagent Solutions
Table 3: Essential Materials for Reliable Zeta Potential Measurement
| Item | Function & Importance |
|---|---|
| 1 mM KCl Solution | Ideal, low-conductivity dispersant for fundamental studies; minimizes ion masking of surface charge. |
| Disposable Zeta Cells (Cuvettes) | Prevents cross-contamination and electrode degradation, crucial for reproducible results. |
| 0.22 µm Syringe Filters (PES or Nylon) | Removes dust and large aggregates that cause spurious scattering and multiple peaks. |
| Dialysis Tubing (Appropriate MWCO) | Removes unreacted precursors, free polymers, and excess salts that contribute to conductivity and artifact peaks. |
| Standard Zeta Potential Reference (e.g., -50 mV ± 5) | Validates instrument performance and electrode function before sample measurement. |
| pH Adjusters (0.1M HCl/NaOH or buffers) | Allows systematic investigation of zeta potential vs. pH, identifying stability regions away from the IEP. |
| Ultrasonic Bath (with degas function) | Gently breaks up soft, reversible aggregates without damaging primary nanoparticles. |
| Conductivity Meter | Diagnoses insufficient purification; high conductivity can distort field and peak shape. |
Measuring zeta potential is a cornerstone technique for characterizing nanoparticle surface charge, a critical parameter influencing stability, biodistribution, and efficacy in drug delivery systems. However, high ionic strength (high conductivity) samples present a significant challenge. Excess ions compress the electrical double layer (EDL), reducing the measurable zeta potential, generating excessive heat during measurement (Joule heating), and increasing the risk of electrode corrosion. This application note, framed within the broader thesis on robust zeta potential measurement, details two primary remediation strategies: dilution and dialysis.
Core Principles: Impact of Conductivity on Zeta Potential Measurement
High conductivity alters the key relationship described by the Henry equation and Smoluchowski approximation. It reduces the Debye length (κ⁻¹), the thickness of the EDL, making accurate measurement difficult. Furthermore, exceeding instrument-specific conductivity limits (typically 50-100 mS/cm for modern phase analysis light scattering (PALS) instruments) can cause measurement failure.
Decision Framework: When to Choose Dilution vs. Dialysis
The choice depends on the sample matrix, the necessity to preserve original conditions, and the experimental goal.
Table 1: Decision Matrix for Managing High Conductivity Samples
| Criterion | Dilution | Dialysis |
|---|---|---|
| Primary Goal | Rapid reduction of ionic strength for measurement feasibility. | Purification and exchange into a defined, low-conductivity buffer while preserving particle concentration. |
| Best For | Simple buffers (e.g., NaCl, PBS); preliminary screening; samples where concentration change is acceptable. | Complex biological matrices (serum, cell lysate); formulated drug products; any scenario where original particle concentration must be maintained. |
| Conductivity Reduction | High, but scales with dilution factor. | High and controllable; can reach very low final conductivity. |
| Particle Concentration | Decreases proportionally to dilution factor. | Remains constant. |
| Buffer/Small Molecule Composition | Diluted uniformly. | Effectively removed (depending on MWCO). |
| Time Requirement | Minutes. | Hours to overnight. |
| Sample Volume Requirement | Small (uses part of original sample). | Larger (requires sufficient sample for dialysis setup and dilution factor). |
Detailed Protocols
Protocol 4.1: Dilution Method for Zeta Potential Measurement
Objective: To reduce sample conductivity to within instrument limits via simple dilution with low-conductivity water or buffer. Materials:
- High-conductivity nanoparticle sample.
- Diluent: Deionized (DI) water or 1 mM KCl (standard zeta potential dispersant). Note: Using DI water can alter pH significantly; 1 mM KCl is preferred for pH stability.
- Vortex mixer.
- Conductivity meter.
- Zeta potential instrument (e.g., Malvern Zetasizer, Beckman Coulter DelsaMax).
Procedure:
- Initial Characterization: Measure the conductivity and pH of the original sample.
- Calculate Dilution Factor: Determine the factor needed to bring conductivity below 10 mS/cm (a common safe threshold). E.g., If sample conductivity is 100 mS/cm, a 1:10 dilution target is ~10 mS/cm.
- Perform Dilution: Prepare the dilution using the calculated factor in a clean vial. Vortex gently but thoroughly for 30 seconds.
- Equilibration: Allow the diluted sample to equilibrate at the measurement temperature (typically 25°C) for 2 minutes.
- Verify & Measure: Measure the conductivity of the diluted sample. If within limit, proceed with zeta potential measurement. Report the dilution factor with all results.
Protocol 4.2: Dialysis Method for Zeta Potential Measurement
Objective: To exhaustively exchange the sample into a low-ionic-strength buffer without reducing nanoparticle concentration. Materials:
- High-conductivity nanoparticle sample.
- Dialysis tubing or cassette with appropriate Molecular Weight Cut-Off (MWCO) (typically 3.5-14 kDa for nanoparticles).
- Large-volume dialysis buffer (e.g., 1 mM KCl, 1 mM NaCl, or 1 mM HEPES, pH-adjusted). Buffer conductivity should be <1 mS/cm.
- Magnetic stirrer and large beaker.
- Conductivity meter.
Procedure:
- Prepare Dialysis Setup: Pre-treat dialysis membrane per manufacturer instructions (soaking, rinsing). Load the nanoparticle sample into the tubing/cassette.
- Initial Dialysis: Immerse the sealed dialysis unit in a large volume (≥500x sample volume) of pre-chilled dialysis buffer. Stir gently at 4°C (to minimize aggregation) for 2-4 hours.
- Buffer Exchange: Replace the entire external dialysis buffer with fresh, clean buffer. Continue dialysis overnight (12-16 hours) with stirring at 4°C.
- Final Dialysis: Replace the buffer a second time and dialyze for an additional 2-4 hours.
- Sample Recovery: Carefully recover the dialyzed sample from the tubing/cassette.
- Characterization: Measure the conductivity and pH of the dialysate. Confirm it is within the target range (<5 mS/cm). Proceed with zeta potential measurement.
The Scientist's Toolkit: Essential Materials
Table 2: Key Research Reagent Solutions & Materials
| Item | Function & Rationale |
|---|---|
| 1 mM Potassium Chloride (KCl) | Standard, low-conductivity dispersant for zeta potential. Provides minimal ionic strength for measurement without compressing the EDL. |
| Dialysis Tubing (MWCO 3.5-14 kDa) | Semi-permeable membrane allowing small ions and molecules to diffuse out while retaining nanoparticles. |
| Low-Conductivity Buffer (e.g., 1 mM HEPES) | Provides pH stabilization during dialysis without introducing high ionic strength. |
| Deionized (DI) Water (≥18.2 MΩ·cm) | Primary diluent. Must be particle-free and used with caution due to potential pH shifts. |
| Bench-top Conductivity Meter | Essential for quantitatively assessing sample ionic strength before and after treatment. |
| Disposable Zeta Potential Cells (Capillary Cells) | For sample loading. Using dedicated cells for high-salt samples prevents cross-contamination and corrosion damage. |
Visualized Workflows & Logical Frameworks
Title: Decision Workflow: Dilution vs Dialysis for High Conductivity
Title: Step-by-Step Dilution Protocol Workflow
Title: Step-by-Step Dialysis Protocol Workflow
Application Notes
Accurate zeta potential measurement is critical for characterizing nanoparticle surface charge, which dictates stability, biodistribution, and efficacy in drug delivery systems. Three predominant artifacts—Electrode Polarization, Joule Heating, and Particle Sedimentation—can significantly distort electrophoretic mobility data, leading to erroneous zeta potential values. This document provides application notes and protocols to mitigate these artifacts within nanoparticle surface charge research.
Electrode Polarization occurs when ions accumulate at electrode surfaces during an applied electric field in conductivity or low-frequency dielectric measurements. This forms an electrical double-layer at the electrode-electrolyte interface, which can dominate the impedance measurement, obscuring the bulk sample response. For zeta potential via electrophoretic light scattering (ELS), polarization in the measurement cell leads to field strength instability and particle migration distortions.
Joule Heating results from current flow through a resistive medium, raising the local temperature of the sample. This alters the solvent viscosity and dielectric constant, directly impacting the calculated electrophoretic mobility. Temperature gradients can also induce convective flows, disturbing particle motion.
Particle Sedimentation is particularly problematic for large or dense nanoparticles during measurement. Settling creates a concentration gradient, leading to a non-homogeneous sample within the measurement zone. This can cause biased sampling, where the measured particles are not representative of the whole population, and can also induce settling potentials.
The following table summarizes the impact of these artifacts on key measurement parameters:
Table 1: Primary Artifacts and Their Impact on Zeta Potential Measurement
| Artifact | Key Affected Parameter | Typical Error Introduced | Common Susceptible Systems |
|---|---|---|---|
| Electrode Polarization | Electric Field Strength & Stability | ± 5 – 30 mV (distorted field) | Low ionic strength buffers (< 1 mM), High conductivity samples |
| Joule Heating | Sample Temperature (∆T) | ∆T of 1–10°C, error up to ± 8 mV/°C* | High field strength, High conductivity buffers, Long measurement times |
| Particle Sedimentation | Particle Concentration in Viewing Zone | Biased size/charge sub-population; ± 10 – 50 mV (heterogeneous sampling) | Large particles (> 200 nm), High density materials (e.g., Au, Fe3O4), Low viscosity dispersants |
*Error estimate based on the temperature dependence of water viscosity (approx. 2-3% per °C) and dielectric constant, affecting the Henry function and Smoluchowski approximation.
Experimental Protocols
Protocol 1: Mitigating Electrode Polarization in ELS Measurements
Objective: To obtain stable electric field strength for accurate electrophoretic mobility measurement.
- Cell Selection: Use a dip cell with platinized black or palladium electrodes. The high surface area coating reduces current density, minimizing polarization.
- Buffer Optimization: Adjust sample electrolyte concentration. For highly deionized samples, add a small amount of inert salt (e.g., 1 mM KCl) to increase ionic strength sufficiently to shield the electrode field, but not so high as to cause excessive heating or particle aggregation.
- Field & Frequency Modulation: Employ a programmable power supply to apply a reversing polarity DC field or a low-frequency AC field (1-10 Hz). This prevents sustained ion buildup at one electrode.
- Validation Measurement: After sample loading, apply a low voltage and monitor the measured current or phase signal over 30 seconds. A stable signal indicates minimal polarization. A drifting signal necessitates further protocol adjustment.
Protocol 2: Minimizing Joule Heating Effects
Objective: To maintain isothermal conditions during electrophoretic mobility measurement.
- Temperature Control: Allow the instrument sample chamber to equilibrate for at least 15 minutes prior to measurement. Use an integrated Peltier temperature controller set to a standard temperature (e.g., 25°C).
- Field Strength & Duration: Use the lowest applied voltage/field strength that yields a satisfactory signal-to-noise ratio for phase analysis. Reduce the number of measurement runs or the duration of each run.
- Buffer Conductivity Management: For high-conductivity formulations (> 10 mS/cm), consider dilution with deionized water if scientifically permissible, as heating is proportional to conductivity and the square of the field strength.
- Thermal Monitoring: For critical measurements, validate temperature stability by measuring a standard latex nanosphere dispersion (e.g., -50 mV ± 5 mV) before and after the sample series. A drift in the standard's value indicates a thermal control issue.
Protocol 3: Preventing Particle Sedimentation Bias
Objective: To ensure the measurement zone contains a representative aliquot of the nanoparticle dispersion.
- Sample Homogenization: Vortex the nanoparticle suspension vigorously for 30-60 seconds immediately before loading into the measurement cell.
- Density Matching: For inorganic nanoparticles (e.g., gold, iron oxide), consider using density-matching solvents (e.g., glycerol-water mixtures, sucrose solutions) to reduce the density difference between particle and dispersant. Note: This changes viscosity and dielectric constant; zeta potential must be calculated using correct solvent properties.
- Viscosity Adjustment: For particles > 500 nm, slightly increasing medium viscosity with a biocompatible polymer like 0.1% w/v methylcellulose can slow sedimentation without inducing aggregation.
- Measurement Timing & Cell Orientation: Use a vertical dip cell orientation and commence measurement within 60 seconds of loading. For horizontal capillary cells, ensure the cell is properly rotated or that the measurement is completed before significant settling occurs.
Diagram Title: Zeta Potential Measurement Anti-Artifact Workflow
Protocol 4: Integrated Validation Experiment for Artifact Assessment
Objective: To systematically test for the presence of artifacts in a new nanoparticle system.
- Prepare a standard nanoparticle dispersion (e.g., 100 nm polystyrene latex, known zeta -50 mV) in your target buffer.
- Measure zeta potential using Protocol 1-3 as a baseline.
- Test for Sedimentation: Measure the sample immediately after loading, then let the cell sit for 5 minutes and re-measure without agitation. A significant shift (> 5 mV) indicates sedimentation bias.
- Test for Heating/Polarization: Perform a voltage series. Measure zeta at low, medium, and high applied voltages (e.g., 50 V, 100 V, 150 V for a capillary cell). A consistent zeta value across voltages indicates well-mitigated artifacts. A trend (e.g., increasing magnitude with voltage) suggests heating or polarization effects.
- Document all parameters (field strength, conductivity, temperature, delay times) for reproducibility.
The Scientist's Toolkit: Research Reagent Solutions
Table 2: Essential Materials for Artifact-Free Zeta Potential Measurement
| Item | Function | Example Product/Chemical |
|---|---|---|
| Platinized/Palladium Electrode Dip Cell | High-surface-area electrodes minimize electrode polarization by reducing current density. | Malvern Zetasizer Dip Cell (platinized), Beckman Coulter Palladium electrode. |
| NIST-Traceable Zeta Potential Standard | Validates instrument performance and temperature control under your specific conditions. | -50 mV ± 5 mV Polystyrene Latex (e.g., from Malvern Panalytical or Thermo Fisher). |
| Temperature-Controlled Sample Chamber | Actively maintains isothermal conditions to prevent Joule heating artifacts. | Integrated Peltier system in modern zeta potential analyzers. |
| Low-Conductivity, Inert Salt | Optimizes ionic strength to shield electrodes without inducing aggregation or heating. | Potassium Chloride (KCl), prepared as a 1-10 mM stock solution. |
| Density-Matching Agent | Reduces sedimentation velocity for dense particles, keeping them suspended. | Glycerol, D2O, Sucrose (for aqueous systems). |
| Viscosity Modifier | Slows particle settling and can dampen convective flows from minor heating. | Methylcellulose, Hydroxyethyl cellulose (low concentration, non-ionic). |
| Disposable Folded Capillary Cells (DTS1070) | Minimizes cross-contamination and provides a standardized, horizontal path length. Useful for moderate conductivity samples. | Malvern Panalytical DTS1070. |
| Precision pH/Conductivity Meter | Essential for characterizing and replicating sample dispersion media. | Meter with micro-sensor for small sample volumes. |
Optimizing for Low Concentration or Weakly Charged Nanoparticles
Within the broader thesis on measuring zeta potential for nanoparticle surface charge research, a significant challenge arises when analyzing nanoparticles that are present at low concentrations or possess inherently weak surface charges. Traditional electrophoretic light scattering (ELS) techniques often fail under these conditions due to insufficient scattering signal or poor electrophoretic mobility. This application note details advanced protocols and methodologies to overcome these limitations, enabling accurate and reliable zeta potential characterization for sensitive nanomaterial systems critical in drug delivery, diagnostics, and biotechnology.
Core Challenges & Solutions
Challenges: For low concentration samples, the scattered light intensity is proportional to the number of particles, leading to a poor signal-to-noise ratio. For weakly charged particles, the electrophoretic mobility is minimal, making it difficult to distinguish from Brownian motion or electroosmotic flow.
Solutions: The following table summarizes the primary technical approaches to mitigate these issues.
Table 1: Strategies for Optimizing Zeta Potential Measurement
| Challenge | Solution | Principle | Key Benefit |
|---|---|---|---|
| Low Concentration | Enhanced Signal Detection | Use of high-sensitivity avalanche photodiodes (APD) or photon-counting PMTs. | Enables detection of very weak scattered light signals. |
| Low Concentration | Resonant Mass Measurement | Trapping particles in a microfluidic resonator; charge affects resonant frequency shift. | Label-free, operates at very low concentrations (e.g., 10^5 particles/mL). |
| Weak Charge | Tunable Resistive Pulse Sensing (TRPS) | Measures particle translocation speed through a pore under an applied field. | Directly measures electrophoretic mobility independent of light scattering. |
| Weak Charge | Laser Doppler Velocimetry with Phase Analysis | Analyzes phase shifts of scattered light, more sensitive than frequency analysis for slow-moving particles. | Improved resolution for low mobility particles. |
| Both | Electroacoustic Techniques (e.g., Colloid Vibration Current) | Applies an acoustic field; charged particles generate an oscillating electric current. | Effective for concentrated but also adaptable to specific low-concentration cells. |
| Both | Microfluidic Capillary Cell Design | Uses narrow capillaries with appropriate coatings to suppress electroosmotic flow (EOF). | Reduces background interference, isolating true particle mobility. |
Detailed Experimental Protocols
Protocol 3.1: Zeta Potential via TRPS for Low Concentration/Weakly Charged Particles
Objective: To determine the electrophoretic mobility and zeta potential of nanoparticles using Tunable Resistive Pulse Sensing (qNano or iZON system). Materials: Tunable Resistive Pulse Sensing instrument, nanopore membrane (NP100, NP200, etc.), appropriate calibration particles, particle-free electrolyte solution (e.g., 10 mM KCl, pH 7.4). Procedure:
- System Setup & Calibration:
- Install a nanopore membrane of appropriate stretch size (typically 40-60 nm for 100-200 nm particles).
- Fill both fluid cells with filtered electrolyte solution.
- Introduce a calibration particle standard (e.g., 200 nm carboxylated PS) of known concentration and zeta potential into the top fluid cell.
- Apply a constant pressure (e.g., 2-4 cm H₂O) to drive particles through the pore. Apply a baseline voltage (e.g., 0.05 V).
- Record the mean translocation rate (particles/minute) and baseline current.
- Calculate the pore size and system calibration factor using the manufacturer's software.
- Sample Measurement:
- Replace the top fluid cell content with the nanoparticle sample, diluted in the same electrolyte to a concentration of ~5x10^8 particles/mL.
- Apply a stepped DC voltage (e.g., from -0.3 V to +0.3 V in 0.05 V increments). At each voltage, record particle translocation events for 2 minutes.
- For each voltage step, calculate the mean translocation time (Δt) for at least 100 individual particle events.
- Data Analysis:
- Plot translocation rate (1/Δt) against the applied voltage. The slope of the linear fit is proportional to electrophoretic mobility (μ).
- Convert electrophoretic mobility to zeta potential (ζ) using the Helmholtz-Smoluchowski equation: ζ = μη/ε, where η is viscosity and ε is dielectric constant of the medium. Account for any pressure-driven flow component.
Protocol 3.2: Enhanced ELS with Capillary Cell Optimization
Objective: To maximize signal quality in traditional ELS for challenging samples using specialized cells and settings. Materials: Zeta potential analyzer with ELS capability (e.g., Malvern Zetasizer Nano), low-volume disposable capillary cells (DTS1070) or cells with palladium electrodes, high-conductivity electrodes (if applicable), buffer-matched dispersant. Procedure:
- Cell Selection & Preparation:
- Use disposable capillary cells (DTS1070) to eliminate cross-contamination and ensure clean, reproducible surfaces.
- For weakly charged particles, select a dip cell that allows for laser alignment through a flat window, minimizing stray light.
- Pre-rinse the cell three times with filtered (0.1 μm) dispersant.
- Sample Preparation:
- Dialyze the nanoparticle suspension extensively against a low-ionic-strength buffer (e.g., 1 mM NaCl) to minimize conductivity and maximize Debye length.
- Filter the final sample using a 0.1 μm syringe filter (PVDF membrane) to remove dust.
- Instrument Configuration:
- Set the measurement position to "near cell wall" (default for DTS1070) to leverage the stationary layer where electroosmotic flow is zero.
- Increase the number of runs per measurement to 50-100.
- Set the voltage selection to "Automatic (High Voltage)" to apply the maximum field strength permissible (up to 150 V) for weak signals.
- Enable the "Fast Field Reversal" or "Fast FFR" mode to improve signal processing for low mobility particles.
- Measurement & Validation:
- Introduce 750 μL of sample into the cell, ensuring no bubbles.
- Equilibrate to 25°C for 120 seconds.
- Perform at least 10 consecutive measurements. The zeta potential distribution should be unimodal.
- Validate instrument performance using a zeta potential transfer standard (e.g., -50 mV ± 5 mV).
Visualized Workflows & Relationships
Title: Decision Pathway for Low Conc/Weak Charge NPs
Title: Optimized ELS Protocol Workflow
The Scientist's Toolkit: Essential Research Reagent Solutions
Table 2: Key Reagents and Materials for Optimized Measurements
| Item | Function & Rationale | Example Product/Chemical |
|---|---|---|
| Disposable Zeta Cells (DTS1070) | Eliminates electroosmotic flow hysteresis and contamination from previous samples. Essential for reproducible baseline. | Malvern Panalytical DTS1070 folded capillary cell. |
| Low-Ionic-Strength Buffer | Maximizes the Debye length (κ⁻¹), enhancing the sensitivity of zeta potential to surface charge. Reduces sample conductivity. | 1 mM Potassium Chloride (KCl), 0.1 mM Sodium Phosphate, pH 7.4. |
| Zeta Potential Transfer Standard | Validates instrument performance and protocol accuracy under challenging measurement conditions. | DSC -50 mV Standard (NIST-traceable polystyrene latex). |
| Nanopore Membranes (for TRPS) | Sizes the resistive pulse sensor; pore diameter must be ~30-60% larger than particle diameter for optimal signal. | Izon NP200 (200 nm pore), NP400. |
| Particle-Free Electrolyte | Used as dispersant and for system calibration in TRPS. Must be rigorously filtered to prevent pore blockage. | 0.1 μm filtered 10 mM KCl with 0.05% w/v NaN₃. |
| High-Purity Calibration Particles | For TRPS and general instrument calibration. Known size and zeta potential are critical for system characterization. | 200 nm Carboxylated Polystyrene Beads (e.g., ThermoFisher). |
| Syringe Filters (PVDF, 0.1 μm) | Removes dust and aggregates that create spurious signals, critical for low-concentration sample clarity. | Millipore Millex-VV (PVDF, 0.1 μm pore). |
Within the broader thesis on measuring zeta potential for nanoparticle surface charge research, calibration and maintenance are critical for generating reliable, reproducible data. Standard Reference Materials (SRMs) provide the benchmark for validating instrument performance, ensuring accuracy in characterizing surface charge—a pivotal parameter in drug delivery system development. This document outlines application notes and protocols for using SRMs in zeta potential analysis.
The Importance of SRMs in Zeta Potential Analysis
Zeta potential values dictate nanoparticle stability, biodistribution, and cellular uptake. Instrumental drift, cell alignment, and electrode degradation can compromise measurements. SRMs, with certified zeta potential values, enable researchers to verify the entire measurement system—including the instrument, cell, and operating protocol—thereby ensuring data integrity for critical decisions in formulation development.
Research Reagent Solutions & Essential Materials
| Item | Function in Zeta Potential Validation |
|---|---|
| Certified Zeta Potential SRM (e.g., NIST RM 8271) | Provides a colloidal suspension with a certified zeta potential value traceable to SI units, used for primary instrument calibration and validation. |
| Polystyrene Latex Dispersions (e.g., -50 mV ± 5 mV) | Secondary standards with well-characterized, stable zeta potential for routine performance checks and inter-laboratory comparison. |
| Buffer Salts (e.g., KCl, NaCl) | Used to prepare standard electrolyte solutions of known conductivity (e.g., 1 mM KCl) for diluting SRMs and controlling ionic strength. |
| pH Buffer Standards (pH 4, 7, 9) | Used to adjust and verify the pH of SRM dispersions, as zeta potential is highly pH-dependent. |
| Deionized/Distilled Water (≥18.2 MΩ·cm) | High-purity water for all dilutions and cleaning to prevent contamination. |
| Disposable Zeta Cells (e.g., folded capillary cells) | Single-use cells to eliminate cross-contamination and cell degradation as a variable. |
| Certified Syringes and Pipettes | For accurate and precise sample handling and introduction. |
Protocol: Validating Zeta Potential Analyzer Performance Using SRMs
Pre-Validation Preparation
Objective: Ensure instrument and environment are ready for validation. Materials: Zeta potential analyzer, certified SRM (e.g., NIST RM 8271), appropriate buffer, D.I. water, clean disposable cells, temperature control unit. Procedure: 1.1 Power on the instrument and laser, allowing a minimum 15-minute warm-up. 1.2 Set the instrument temperature controller to 25.0°C ± 0.2°C. Allow chamber to equilibrate. 1.3 Clean all external surfaces with D.I. water and lint-free wipes. 1.4 Prepare the SRM suspension exactly as per the certificate of analysis. Typically, this involves gentle inversion mixing and dilution with a specified buffer (e.g., 1 mM KCl) to a target conductivity. 1.5 Measure and adjust the diluted SRM's pH to the certified value (e.g., pH 5.5) if necessary. Record final conductivity.
SRM Measurement and Data Acquisition
Objective: Obtain a zeta potential measurement of the SRM. Procedure: 2.1 Using a certified syringe, flush a clean, disposable folded capillary cell with 1 mL of the prepared SRM suspension. 2.2 Load the cell with a fresh 1 mL aliquot, ensuring no air bubbles are present in the electrode region. 2.3 Insert the cell into the instrument, ensuring proper orientation and seating. 2.4 Set the instrument parameters to match the SRM certificate conditions (Temperature: 25°C, Dispersant Viscosity/RI: for water, Dispersant Dielectric Constant: for water). 2.5 Perform a minimum of 3 measurement runs, with each run consisting of at least 12 sub-runs. Allow 2 minutes between runs for temperature re-equilibration. 2.6 Record the zeta potential (mean and standard deviation) and electrophoretic mobility for each run. The instrument should report the mean and standard deviation of all measured particles.
Data Analysis and Acceptance Criteria
Objective: Compare measured results to the certified value to determine system accuracy. Procedure: 3.1 Calculate the overall mean (Ẑ) and standard deviation (SD) of all runs. 3.2 Calculate the 95% confidence interval: CI = Ẑ ± (t * (SD/√N)), where t is the two-tailed t-value for N-1 degrees of freedom. 3.3 Acceptance Criterion: The certified value of the SRM must fall within the calculated 95% confidence interval of your measured mean. 3.4 Precision Criterion: The measured standard deviation between runs should be < 5% of the mean value for a homogeneous SRM.
Table 1: Example Validation Data for NIST RM 8271 (Certified Value: -42 mV ± 4.2 mV)
| Run # | Mean Zeta Potential (mV) | Standard Deviation (mV) | Electrophoretic Mobility (µm·cm/V·s) |
|---|---|---|---|
| 1 | -41.7 | 1.2 | -3.26 |
| 2 | -42.3 | 0.9 | -3.31 |
| 3 | -42.0 | 1.1 | -3.29 |
| Overall (n=3) | -42.0 | 0.3 | -3.29 |
| 95% CI | -42.0 ± 0.6 |
Conclusion: The certified value (-42 mV) lies within the measured CI (-41.4 to -42.6 mV). The system is validated.
Routine Maintenance and Performance Check Protocol
Objective: Establish a weekly or pre-critical measurement check. Materials: Secondary standard polystyrene latex dispersion (-50 mV). Procedure: 4.1 Measure the secondary standard following the same protocol (Sections 1.0-2.0). 4.2 Plot the result on a control chart (e.g., Shewhart chart) with upper and lower control limits (e.g., ± 10% of the historical mean). 4.3 Action: If the measurement falls outside control limits, perform a full SRM validation (Sections 1.0-3.0). If it fails the SRM test, service is required (electrode cleaning, laser alignment check).
Workflow Diagram: SRM Validation Process
Diagram Title: Zeta Potential Analyzer Validation & Maintenance Workflow
Logical Relationship: Role of Validation in Surface Charge Thesis
Diagram Title: Role of SRM Validation in Surface Charge Research
Validating and Interpreting Zeta Data: From Reproducibility to Regulatory Submission
Application Notes: Zeta Potential Analysis for Nanoparticle Surface Charge Research
Reliable zeta potential measurement is critical in pharmaceutical nanotechnology, indicating colloidal stability and predicting nanoparticle behavior in vivo. This document outlines essential method suitability tests—Precision, Accuracy, and Robustness—to validate the electrophoretic light scattering (ELS) measurement protocol.
Data Presentation: Method Suitability Acceptance Criteria
Table 1: Summary of Key Suitability Test Parameters and Acceptance Criteria
| Test Parameter | Experimental Design | Acceptance Criterion | Typical Value (for Polystyrene Nanospheres) | ||
|---|---|---|---|---|---|
| Precision (Repeatability) | 10 consecutive measurements of same sample aliquot. | RSD ≤ 5% for monodisperse systems. | RSD = 2.1% | ||
| Intermediate Precision | Measurements across 3 days, 2 analysts, 1 instrument. | RSD ≤ 8% across all conditions. | RSD = 4.7% | ||
| Accuracy (Bias Assessment) | Analysis of certified reference material (CRM). | Mean zeta potential within ± 2 mV of certified value. | CRM: -42 ± 2 mV; Measured: -43.1 mV | ||
| Robustness - pH | Zeta potential measured at pH 7.4 ± 0.5. | No significant trend or shift (> | 5 mV | ) within range. | Δ = 1.8 mV |
| Robustness - Conductivity | Zeta potential at 0.1 mM NaCl ± 20%. | No significant trend or shift (> | 5 mV | ) within range. | Δ = 2.3 mV |
| Robustness - Concentration | Zeta potential at 0.1 mg/mL ± 30%. | No significant trend or shift (> | 5 mV | ) within range. | Δ = 3.1 mV |
Table 2: Example Results from a Robustness Test (pH Variation)
| Test Condition (pH) | Mean Zeta Potential (mV) | Standard Deviation (mV) | Pass/Fail vs. Criterion |
|---|---|---|---|
| 6.9 | -38.2 | 1.1 | Pass |
| 7.4 (Control) | -39.5 | 0.9 | (Reference) |
| 7.9 | -40.0 | 1.3 | Pass |
Experimental Protocols
Protocol 1: Assessing Precision (Repeatability & Intermediate Precision)
- Sample Prep: Dilute a stabilized nanoparticle suspension (e.g., 100 nm polystyrene nanospheres) in 1 mM KCl to a final concentration of 0.1 mg/mL. Filter using a 0.2 µm syringe filter.
- Instrument Setup: Equilibrate the zeta potential cell and instrument to 25°C. Set the Smoluchowski model as the approximation.
- Repeatability: Load the sample into a clean, dedicated folded capillary cell. Perform 10 consecutive measurement runs. Record the mean zeta potential and polydispersity index for each run.
- Data Analysis: Calculate the mean, standard deviation (SD), and relative standard deviation (RSD%) of the 10 zeta potential values. Confirm RSD% ≤ 5%.
- Intermediate Precision: Repeat steps 1-4 over three non-consecutive days by two qualified analysts using the same instrument. Calculate the overall RSD% across all 30 measurements (3 days x 2 analysts x 5 runs). Confirm RSD% ≤ 8%.
Protocol 2: Verifying Accuracy Using a Certified Reference Material (CRM)
- CRM Preparation: Obtain a NIST-traceable or equivalent zeta potential CRM (e.g., -42 mV ± 2 mV polystyrene particles). Prepare the CRM exactly as per the certificate of analysis (typically dilution in a specified buffer).
- Measurement: Load the prepared CRM into the cell. Perform a minimum of 5 measurement runs.
- Data Analysis: Calculate the mean measured zeta potential. Determine if the mean value lies within the certified uncertainty range (e.g., -44 mV to -40 mV). A bias > |2 mV| indicates a need for instrument service or method re-evaluation.
Protocol 3: Robustness Testing for Key Method Parameters
- Define Variable Ranges: Identify critical sample parameters: pH (± 0.5 units), ionic strength/conductivity (± 20%), and nanoparticle concentration (± 30%).
- Sample Matrix Preparation:
- pH Robustness: Adjust the dilution buffer (e.g., 1 mM KCl) to pH 7.4 (control), pH 6.9, and pH 7.9 using minimal volumes of HCl/KOH. Dilute the same nanoparticle stock in each buffer.
- Conductivity Robustness: Prepare dilution media of 0.08 mM, 0.1 mM (control), and 0.12 mM NaCl. Dilute the nanoparticle stock.
- Concentration Robustness: Dilute the nanoparticle stock to 0.07 mg/mL, 0.1 mg/mL (control), and 0.13 mg/mL using the standard buffer.
- Measurement: For each variable set (including the control), perform 5 measurement runs.
- Data Analysis: Calculate the mean zeta potential for each condition. Compare the mean of each altered condition to the control condition. A shift of > |5 mV| indicates the method is sensitive to that variable, and it must be tightly controlled during routine analysis.
Mandatory Visualization
Diagram 1: The Three Pillars of Method Suitability Testing
Diagram 2: Workflow for Precision and Accuracy Measurement Protocol
The Scientist's Toolkit: Essential Research Reagent Solutions
Table 3: Key Materials for Zeta Potential Method Suitability Testing
| Item Name | Function/Application | Critical Notes |
|---|---|---|
| Zeta Potential Certified Reference Material (CRM) | Verifies instrument performance and method accuracy. Provides a traceable standard. | Must be stored and prepared per certificate. NIST-traceability is preferred. |
| Potassium Chloride (KCl) or Sodium Chloride (NaCl), Analytical Grade | Used to prepare low-conductivity, indifferent electrolyte for sample dilution (e.g., 1 mM). | Minimizes ion-specific effects and ensures reproducible ionic strength. |
| Disposable Folded Capillary Cells (DTS1070) | The standard cuvette for zeta potential measurement via M3-PALS technology. | Must be clean, dry, and dedicated to a single sample type to prevent carryover. |
| Syringe Filters (0.2 µm pore size, non-protein binding) | Removes dust and large aggregates from sample suspensions prior to loading. | Essential for preventing scatterer contamination and obtaining clean correlograms. |
| pH Buffer Standards (pH 4, 7, 10) | For calibrating the pH meter used to adjust sample pH in robustness tests. | Accurate pH measurement is crucial as zeta potential is highly pH-sensitive. |
| Deionized Water (Resistivity ≥ 18.2 MΩ·cm) | Used for preparing all electrolyte solutions and rinsing cells. | Low ionic contamination is vital to avoid altering sample conductivity. |
| Non-ionic Surfactant (e.g., Triton X-100) | Optional for wetting cells and cleaning. May be used in specific dispersion protocols. | Use with caution; even trace residues can adsorb onto particles and alter charge. |
Zeta potential is a critical physicochemical parameter in nanoparticle characterization, indicating the surface charge and predicting the colloidal stability of nanomaterial suspensions. Accurate measurement and rigorous statistical analysis are fundamental for research in drug delivery, material science, and nanotechnology. This document provides detailed protocols and application notes for the statistical reporting of zeta potential data, including the calculation and interpretation of the mean, standard deviation (SD), and the polydispersity index (PDI) derived from electrophoretic mobility distributions. This content is framed within the broader thesis of establishing robust methodologies for measuring zeta potential to advance nanoparticle surface charge research.
Core Statistical Parameters: Definitions and Significance
- Mean Zeta Potential (mV): The average value of the zeta potential distribution. It indicates the net surface charge and is used to predict long-term stability (typically, values > |±30| mV indicate good electrostatic stability).
- Standard Deviation (SD, mV): A measure of the dispersion or variability of individual zeta potential measurements around the mean. A low SD suggests a homogeneous surface charge distribution within the sample population.
- Polydispersity Index (PDI): Often derived from the cumulants analysis of the dynamic light scattering (DLS) correlation function, PDI reflects the breadth of the particle size distribution. While primarily for size, it is intrinsically linked to zeta potential analysis. A sample with high size polydispersity (PDI > 0.7) can lead to complex, multimodal electrophoretic mobility distributions, complicating zeta potential interpretation. The "Zeta Potential PDI" or "Width of Distribution" reported by some instruments is analogous.
Experimental Protocol for Zeta Potential Measurement & Analysis
Protocol Title: Standard Operating Procedure for Zeta Potential Measurement and Statistical Reporting of Nanoparticle Dispersions.
Principle: Laser Doppler Velocimetry (LDV) is used to measure the electrophoretic mobility of particles in a liquid under an applied electric field. This mobility is converted to zeta potential using the Henry equation and the Smoluchowski or Hückel approximations.
Materials & Equipment:
| Item | Function |
|---|---|
| Zeta Potential Analyzer | Instrument equipped with LDV and phase analysis light scattering (PALS) to measure electrophoretic mobility. |
| Disposable Capillary Cells | Folded capillary zeta cells (e.g., DTS1070) for sample containment and electrode contact. Minimizes cross-contamination. |
| Syringe & Filter (0.45 or 0.22 µm) | For precise sample loading and removal of large particulates that could cause scattering artifacts. |
| Pipettes and Tips | For accurate sample handling and dilution. |
| Conductivity Meter | To measure sample ionic strength, a critical parameter affecting the electric double layer. |
| pH Meter | To measure and adjust sample pH, which profoundly influences surface charge. |
| Standard Reference Material | (e.g., -50 mV ± 5 mV latex dispersion) for instrument performance validation. |
Procedure:
Sample Preparation:
- Dilute the nanoparticle suspension in an appropriate aqueous buffer (e.g., 1 mM KCl, 10 mM NaCl, or PBS) to achieve a count rate within the instrument's optimal sensitivity range. Ensure the dispersant conductivity is known.
- Filter the diluted sample if necessary.
- Record the pH and conductivity of the final dispersion.
Instrument Calibration & Validation:
- Power on the instrument and laser, allowing for sufficient warm-up time (>30 min).
- Load the zeta potential standard into a clean cell, ensuring no air bubbles are present.
- Run the standard measurement using the manufacturer's predefined method. The measured mean zeta potential must fall within the certified range of the standard.
Sample Measurement:
- Rinse the capillary cell 2-3 times with a small amount of the prepared sample.
- Load the cell with the sample, ensuring no bubbles are trapped in the measurement zone.
- Insert the cell into the instrument's thermostatted chamber (typically 25°C).
- Select the appropriate measurement method. Key settings include:
- Dispersant Viscosity & Refractive Index.
- Dispersant Dielectric Constant.
- Measurement Voltage (Auto-attenuated or manually set).
- Number of Runs (minimum 3) and Duration per run (≈ 10-100 cycles).
- Initiate the measurement. The instrument will automatically perform repeated runs.
Data Acquisition & Primary Analysis:
- The software calculates the electrophoretic mobility distribution for each run.
- It fits this data to convert mobility to zeta potential (using the Smoluchowski model for aqueous solutions >1 mM salt).
- The software outputs a report containing: Mean Zeta Potential, Standard Deviation (or "Zeta Deviation"), and the PDI/Width of the zeta distribution for the set of runs.
Statistical Reporting & Quality Control:
- Acceptance Criteria: A quality measurement is typically indicated by a monotonic, well-defined phase plot from the PALS analysis and a stable mean value across runs.
- Replicates: Perform at least three independent measurements (n=3) from separately prepared samples (biological replicates) or, at minimum, three sequential measurements of the same sample (technical replicates), clearly stating which in the report.
- Reporting: Summarize the data as Mean ± SD. Always report the number of replicates (n), the temperature, dispersant (pH, conductivity), and the measurement model (e.g., Smoluchowski).
Diagram Title: Zeta Potential Measurement & Analysis Workflow
Data Presentation and Comparative Analysis
Table 1: Statistical Analysis of Zeta Potential for Model Nanoparticles (n=3 independent samples)
| Nanoparticle Formulation | Dispersant (pH, Conductivity) | Mean Zeta Potential (mV) | Standard Deviation (mV) | Zeta Distribution PDI/Width | Inferred Stability |
|---|---|---|---|---|---|
| Plain PLGA NPs | 1 mM KCl (pH 6.5, 0.15 mS/cm) | -2.5 | ± 1.8 | 0.21 | Low (Near zero charge) |
| Chitosan-coated PLGA NPs | 1 mM KCl (pH 5.0, 0.16 mS/cm) | +32.7 | ± 3.1 | 0.15 | High (Positive charge) |
| PEGylated Liposomes | PBS (pH 7.4, 1.6 mS/cm) | -4.2 | ± 0.9 | 0.08 | Moderate (Steric stability) |
| Citrate-capped Gold NPs | DI Water (pH 7.0, <0.01 mS/cm) | -38.9 | ± 2.5 | 0.12 | High (Negative charge) |
Interpretation of Table 1:
- Chitosan-coated and citrate-capped nanoparticles show high mean zeta potential magnitudes and moderate SDs, indicating a stable, homogeneous surface charge.
- The PEGylated liposome has a low mean zeta but an exceptionally low SD and distribution width, suggesting a very uniform population whose stability derives from steric, not electrostatic, effects.
- Plain PLGA NPs have a mean near zero and a relatively high distribution width, indicating an unstable, aggregated-prone system.
Diagram Title: Logic Flow for Interpreting Zeta Statistics
The Scientist's Toolkit: Essential Research Reagent Solutions
| Item/Category | Specific Example(s) | Function in Zeta Potential Analysis |
|---|---|---|
| Dilution Buffers | 1 mM KCl, 10 mM NaCl, 1 mM HEPES | Provides controlled ionic strength and pH for reproducible measurements without destabilizing nanoparticles. |
| Zeta Potential Standards | DTAP005 (-50 mV ± 5), NIST Traceable Latex | Validates instrument performance, ensures accuracy, and is required for quality control protocols. |
| Disposable Cells | DTS1070 Folded Capillary Cell | Standardized path length, eliminates cleaning errors, and ensures consistent electrode geometry. |
| Conductivity Standards | 0.001 M, 0.01 M KCl solutions | Calibrates conductivity meter to accurately measure sample ionic strength, a key input parameter. |
| pH Standards | pH 4.01, 7.00, 10.01 buffers | Calibrates pH meter for accurate measurement/adjustment of sample pH, the primary variable affecting charge. |
| Syringe Filters | PVDF or cellulose acetate, 0.22 µm | Removes dust and large aggregates that can cause spurious scattering and interfere with the phase analysis. |
Advanced Considerations and Troubleshooting
- Choosing the Right Model: The Smoluchowski approximation is valid for particles in aqueous media with >1 mM salt where κa >>1 (thick double layer). Use the Hückel model for non-aqueous solvents or very low conductivity where κa <<1.
- Effect of Conductivity: High ionic strength compresses the double layer, reducing zeta potential magnitude and increasing the significance of the measurement model choice. Always report conductivity.
- Multimodal Distributions: If the electrophoretic mobility distribution is clearly bimodal, report the mean, SD, and PDI for each peak separately, as a single mean value is misleading. This indicates a mixture of populations with different surface chemistries.
- Troubleshooting High SD/PDI: High variability can stem from: (1) Poor sample purity/aggregation (filter or centrifuge), (2) Insufficient equilibration (allow temperature to stabilize), (3) Low particle concentration (optimize dilution), or (4) Electrode degradation (check for bubbles or plating).
Within the critical research objective of measuring zeta potential for nanoparticle surface charge characterization—a parameter fundamental to predicting colloidal stability, biodistribution, and targeting efficiency in drug development—three prominent electrokinetic techniques dominate: Electrophoretic Light Scattering (ELS), Acoustic Sonic Amplification (Acoustic) via Electroacoustics, and Electrokinetic Sonic Amplification (ESA). Selecting the appropriate method is contingent upon sample properties, concentration, and the required information.
Core Principles & Comparison
- Electrophoretic Light Scattering (ELS): Measures the Doppler shift in scattered laser light from nanoparticles moving under an applied electric field. The velocity (electrophoretic mobility) is converted to zeta potential via established models (e.g., Smoluchowski, Hückel).
- Acoustic Sonic Amplification (Acoustic/Electroacoustics): Applies an ultrasonic pulse to a concentrated suspension, generating a particle-dependent pressure wave (Colloid Vibration Current, CVI). The CVI is related to the dynamic electrophoretic mobility and zeta potential.
- Electrokinetic Sonic Amplification (ESA): The inverse of the acoustic method. An alternating electric field is applied, causing particle vibration that generates an acoustic wave, which is measured. The amplitude and phase relate to dynamic electrophoretic mobility.
Quantitative Technique Comparison Table
Table 1: Comparative Analysis of Zeta Potential Measurement Techniques
| Feature | Electrophoretic Light Scattering (ELS) | Acoustic / Electroacoustic Sonic Amplification | Electrokinetic Sonic Amplification (ESA) |
|---|---|---|---|
| Primary Measurement | Doppler shift of laser light (velocity) | Colloid Vibration Current (CVI) | Sound pressure generated |
| Sample Concentration | Low (typically 0.1 – 1 mg/mL) | Very High (up to 40-50% w/v) | High (1 – 40% w/v) |
| Dispersant Requirement | Must be optically transparent | Opaque, turbid, concentrated OK | Opaque, turbid, concentrated OK |
| Key Advantage | High resolution, standard for dilute model systems | In-situ measurement in native, concentrated state | Measures both magnitude and phase of mobility |
| Primary Limitation | Unsuitable for concentrated, opaque samples | Requires significant density difference between particle & medium | Complex analysis, specialized instrumentation |
| Typical Application | Characterization of liposomes, polymeric NPs in buffer. Formulation screening. | Ceramic slurries, mineral processing, final concentrate formulation. | Cement pastes, dense colloidal suspensions, industrial coatings. |
| Reported Zeta Range | ± 200 mV | ± 150 mV | ± 150 mV |
| Size Limitation | > ~1 nm (depends on refractive index) | Typically > 100 nm for effective signal | Typically > 100 nm for effective signal |
Detailed Experimental Protocols
Protocol A: Zeta Potential via ELS (Phase Analysis Light Scattering - PALS)
Objective: Determine zeta potential of dilute, optically clear nanoparticle suspensions. Materials: See "Scientist's Toolkit" below. Procedure:
- Sample Preparation: Dilute nanoparticle stock in appropriate electrolyte (e.g., 1 mM KCl) or target biological buffer (e.g., 10 mM PBS) to achieve a count rate within the instrument's optimal range. Filter all buffers (0.22 µm) and sample cuvettes must be scrupulously clean.
- Instrument Setup: Initialize ELS instrument with integrated laser. Select appropriate measurement cell (folded capillary cell for aqueous dispersions). Set temperature to 25.0 ± 0.1°C. Input dispersant viscosity, refractive index, and dielectric constant.
- Equilibration: Inject sample into cell via syringe, avoiding bubbles. Allow temperature to equilibrate for 120 seconds.
- Field Application & Measurement: Apply a calibrated electric field (typical gradient ~10-20 V/cm). The system uses PALS to measure the phase shift of scattered light, calculating electrophoretic mobility. Perform a minimum of 10 runs per sample, with automatic field reversal.
- Data Analysis: Software converts average electrophoretic mobility (µe) to zeta potential (ζ) using the Smoluchowski approximation (for particles > 100 nm in conductive media) or Hückel model. Report zeta potential as mean ± standard deviation (mV) from at least three independent samples.
Protocol B: Zeta Potential via Electroacoustic Method (Acoustic/ESA)
Objective: Determine zeta potential of concentrated, opaque slurries. Materials: See "Scientist's Toolkit" below. Procedure:
- Sample Preparation: Use the suspension at its native, process-relevant concentration (e.g., 10-40% w/v). Ensure homogeneity by gentle stirring or rolling. Avoid introducing air bubbles.
- Instrument Setup: Initialize electroacoustic spectrometer. Select appropriate probe (e.g., dip-in probe for ESA, ultrasonic transmitter/receiver for acoustic). Input detailed material properties: particle density, volume fraction, dispersant density, viscosity, and sound speed.
- Measurement:
- For Acoustic (CVI): Insert probe. The instrument transmits a high-frequency ultrasound pulse (~1-10 MHz). The resulting CVI from particle vibration is measured across a frequency range.
- For ESA: Apply an alternating electric field (~1 MHz) across the sample via electrodes. The resulting acoustic wave is detected by a piezoelectric transducer.
- Data Analysis: The instrument software uses the O'Brien relationship or similar models to calculate the dynamic electrophoretic mobility from the measured signal (CVI or acoustic pressure) across frequencies. This dynamic mobility is then converted to zeta potential using cell model theories that account for particle-particle interactions at high concentration. Report zeta potential and the associated uncertainty from model fitting.
Visualization: Technique Selection Workflow
- Diagram 1 Title: Decision Workflow for Selecting a Zeta Potential Technique
The Scientist's Toolkit: Essential Research Reagents & Materials
Table 2: Key Reagents and Materials for Zeta Potential Experiments
| Item | Function & Rationale |
|---|---|
| Zeta Potential Reference Standard (e.g., -50 mV ± 5 mV latex) | Validates instrument performance and cell alignment before sample measurement. |
| Disposable Folded Capillary Cells (for ELS) | Standardized, sealed cells for aqueous samples, eliminate cross-contamination. |
| Ultrapure Water (Type I, 18.2 MΩ·cm) | Essential for preparing dilution buffers to minimize ionic contamination. |
| Potassium Chloride (KCl), 1 mM Solution | Low ionic strength standard electrolyte for baseline measurements. |
| Buffer Salts (e.g., PBS, HEPES, Acetate) | For physiologically or formulation-relevant measurements; must be filter-sterilized (0.22 µm). |
| Temperature Controller / Peltier | Maintains precise temperature (±0.1°C), as mobility is highly temperature-dependent. |
| High-Precision Syringes (1 mL) | For bubble-free introduction of sample into ELS measurement cells. |
| Dip-in Probe / Flow Cell (for Acoustic/ESA) | Allows direct measurement of concentrated slurries in situ. |
| Sample Degasser | Critical for acoustic methods to eliminate microbubbles that interfere with sound propagation. |
| Particle Density Standard | Required accurate input for electroacoustic models in Acoustic/ESA techniques. |
Correlating Zeta Potential with Complementary Techniques (DLS, TEM, Titration)
Within the broader thesis on measuring zeta potential for nanoparticle surface charge research, it is crucial to validate and contextualize electrophoretic mobility data. Zeta potential alone provides a critical but singular view of surface charge. Correlating it with data from Dynamic Light Scattering (DLS), Transmission Electron Microscopy (TEM), and Titration offers a robust, multi-parametric characterization of nanoparticle dispersions, essential for applications in drug delivery, diagnostics, and material science.
Core Principles and Correlations
Zeta potential, derived from electrophoretic mobility, indicates colloidal stability. Complementary techniques provide context:
- DLS: Measures hydrodynamic size and size distribution (PDI). Correlates with zeta potential to assess aggregation states; stable systems (high |ζ|) often maintain consistent DLS size.
- TEM: Provides primary particle size, shape, and morphology. Differences between TEM (core) and DLS (hydrodynamic) sizes indicate coating thickness. Direct visualization can confirm aggregation suggested by zeta potential trends.
- Titration: Maps surface charge (zeta potential) as a function of pH, identifying the isoelectric point (IEP). Correlates directly with surface chemistry and functional group dissociation.
Table 1: Expected Correlations Between Techniques
| Zeta Potential Observation | Complementary DLS Data | Complementary TEM Data | Titration Data Inference | ||
|---|---|---|---|---|---|
| High absolute value (> | ±30 | mV) | Stable, monomodal size distribution (PDI < 0.1) | Well-dispersed, individual particles | Surface functional groups are ionized |
| Low absolute value (< | ±10 | mV) | Increased hydrodynamic size, multimodal distribution (PDI > 0.3) | Visual aggregation or flocculation | pH is near the Isoelectric Point (IEP) |
| Shift over time/time-series | Concomitant increase in mean hydrodynamic size | Evidence of Ostwald ripening or fusion | Not applicable (ex situ technique) | ||
| Shift with pH modification | May see size change if aggregation occurs | Morphology typically unchanged | Direct correlation; IEP is point where ζ = 0 |
Experimental Protocols
Protocol 2.1: Integrated Zeta Potential & DLS Measurement
Objective: Simultaneously determine nanoparticle hydrodynamic diameter (DLS) and zeta potential (ZP) in a single measurement cycle. Materials: Nanoparticle dispersion, appropriate electrolyte (e.g., 1 mM KCl), disposable folded capillary cell (or appropriate cuvette), zeta potential/DLS instrument. Procedure:
- Sample Preparation: Dilute nanoparticle sample in low-conductivity buffer (e.g., 1 mM KCl) to achieve optimal scattering intensity. Filter sample (0.2 µm or 0.45 µm syringe filter) to remove dust.
- Instrument Setup: Load cell with sample, ensuring no air bubbles. Set instrument temperature to 25°C (or desired). Allow thermal equilibration (2 min).
- DLS Measurement: Configure measurement with scattering angle (commonly 173° backscatter). Perform 3-12 runs of 10 seconds each. Record intensity-weighted size distribution, PDI, and mean hydrodynamic diameter (Z-avg).
- Zeta Potential Measurement: Using the same cell, switch to zeta potential mode. Set voltage according to manufacturer guidelines (typically ~150 V). Perform >10 sub-runs. Record mean zeta potential and electrophoretic mobility.
- Data Correlation: Compare DLS size distribution with zeta potential value. A stable, monomodal population should correlate with a high |ZP|. Aggregation (multimodal DLS) often correlates with low |ZP|.
Protocol 2.2: TEM Sample Preparation & Correlation with Zeta Potential
Objective: Obtain primary particle size and morphology to deconvolute DLS and zeta potential data. Materials: Nanoparticle dispersion, TEM grids (carbon-coated Cu grids), blotting paper, negative stain (e.g., 2% uranyl acetate) if required, plasma cleaner (optional). Procedure:
- Grid Preparation: Plasma clean TEM grids for 30 seconds to increase hydrophilicity.
- Sample Deposition: Apply 3-5 µL of nanoparticle dispersion (optimally the same batch used for DLS/ZP) onto the grid. Allow adsorption for 1-2 minutes.
- Blotting: Gently blot excess liquid with filter paper from the side.
- Washing & Staining (if needed): For samples in high salt, rinse with 2-3 drops of deionized water. For biological samples, apply 2-3 drops of negative stain, then blot immediately.
- Drying: Air-dry thoroughly before TEM imaging.
- Imaging & Analysis: Acquire images at various magnifications. Measure primary particle diameter (n>100) using image analysis software (e.g., ImageJ).
- Correlation: Compare primary (TEM) diameter to hydrodynamic (DLS) diameter. The difference indicates the hydration layer/coating thickness. Correlate imaged dispersion state with measured zeta potential.
Protocol 2.3: Potentiometric Titration for Isoelectric Point Determination
Objective: Determine the pH-dependent zeta potential profile and identify the Isoelectric Point (IEP). Materials: Nanoparticle dispersion, HCl (0.1M), NaOH (0.1M), background electrolyte (e.g., 10 mM NaCl), pH meter, automated titrator (or magnetic stirrer with burette), zeta potential instrument. Procedure:
- Sample Preparation: Disperse nanoparticles in background electrolyte (10 mM NaCl). Adjust to a starting pH far from expected IEP (e.g., pH 3 for cationic particles) using minimal HCl/NaOH.
- Titration Setup: Place sample under constant stirring. Immerse calibrated pH electrode.
- Titration & Measurement: For automated titrators, program a stepwise addition of titrant (e.g., 0.1M NaOH) with pH equilibration. Manually: Add titrant in small increments (e.g., 0.05 pH units), allow equilibration (1-2 min), record pH.
- Zeta Potential Sampling: At each equilibrium pH point, withdraw a small aliquot (~1 mL). Measure zeta potential immediately using Protocol 2.1.
- Data Plotting & Analysis: Plot zeta potential (y-axis) vs. pH (x-axis). Fit a curve through the data points. The pH where the curve crosses ζ = 0 mV is the IEP.
The Scientist's Toolkit: Essential Research Reagents & Materials
Table 2: Key Research Reagent Solutions & Materials
| Item | Function & Importance |
|---|---|
| Disposable Zeta Cells (Folded Capillary) | Standardized, contaminant-free cuvette for simultaneous DLS and zeta potential measurement. Ensures reproducible electrode geometry. |
| Potassium Chloride (KCl), 1 mM Solution | Low-conductivity electrolyte for diluting samples for DLS/ZP. Minimizes heating during measurement (Joule heating) and maximizes sensitivity. |
| Sodium Chloride (NaCl), 10-100 mM Solution | Background electrolyte for titration studies. Provides constant ionic strength, ensuring zeta potential changes are due to pH, not ionic concentration. |
| Certified pH Buffer Solutions (pH 4, 7, 10) | For precise calibration of the pH meter used in titration protocols. Critical for accurate IEP determination. |
| Carbon-Coated TEM Grids | Standard support film for nanoparticle imaging. Provides a thin, conductive, and relatively inert substrate. |
| Uranyl Acetate (2% w/v aqueous) | Common negative stain for TEM. Enhances contrast of soft materials (e.g., polymer coatings, proteins) around nanoparticles. |
| Syringe Filters (0.2 µm, PES membrane) | For critical sample clarification prior to DLS/ZP. Removes dust and large aggregates that can skew results. |
| Standard Latex/Nanoparticle Reference Material | (e.g., 100 nm polystyrene) Used for routine validation of DLS and zeta potential instrument performance. |
Visualized Workflows and Relationships
Diagram Title: Integrated Workflow for Nanoparticle Characterization
Diagram Title: Interpreting DLS & TEM Data via Zeta Potential
1. Introduction and Thesis Context Within the broader thesis on measuring zeta potential for nanoparticle surface charge research, this case study illustrates a critical industrial application: process and quality control. Zeta potential, derived from electrophoretic mobility, is a key indicator of the electrostatic stability of colloidal nanoparticle dispersions. For coated nanoparticles (e.g., PEGylated liposomes, polymer-coated drug carriers, or functionalized inorganic nanoparticles), tracking zeta potential trends provides a rapid, non-invasive, and quantitative measure of coating completeness, consistency, and batch-to-batch reproducibility. This document details the application notes and protocols for implementing this analytical approach.
2. Application Notes: Key Principles and Data Interpretation The effective surface charge, manifested as zeta potential, shifts predictably upon successful surface modification. A consistent trend toward a target value (e.g., increased negative charge for carboxylate coatings, transition toward neutral for dense PEG layers, or charge reversal for cationic polymer adsorption) confirms coating success. Variability in final zeta potential or inconsistent trends across batches indicates process inconsistencies.
Table 1: Expected Zeta Potential Trends for Common Coating Processes
| Nanoparticle Core | Coating Material | Primary Goal | Expected Zeta Trend (Post-Coating) | Typical Target Range (mV)* |
|---|---|---|---|---|
| Cationic Liposome | PEG-Phospholipid | Stealth, Stability | Shift toward neutral or less positive | -5 to +5 |
| Anionic Gold NP | Poly-L-Lysine | Charge Reversal for Conjugation | Shift from negative to positive | +20 to +40 |
| Iron Oxide (Fe₃O₄) | Carboxymethyl Dextran | Colloidal Stability, Functionalization | Increased negative magnitude | -30 to -50 |
| PLGA | Chitosan | Mucoadhesion | Shift from negative to positive | +20 to +35 |
| Silica | Aminosilane | Amine Functionalization | Shift from negative to positive | +25 to +45 |
Note: Exact target ranges are formulation-specific. The key is batch-to-batch consistency within a narrow window (e.g., ± 3 mV).
Table 2: Diagnostic Interpretation of Zeta Potential Batch Data
| Observed Trend | Possible Interpretation | Recommended Action |
|---|---|---|
| Consistent value across batches (within ± 3 mV) | High coating efficiency and process control. | Continue protocol; document. |
| High variability between batches | Inconsistent coating reaction, raw material variability, or purification. | Review reagent quality, mixing parameters, and purification consistency. |
| Failure to reach target value | Insufficient coating material, incorrect reaction conditions, or core instability. | Optimize coating-to-core ratio, pH, ionic strength. |
| Wide distribution width (PdI of zeta) | Heterogeneous coating or particle aggregation. | Improve mixing, use more homogeneous core particles, check for contamination. |
3. Experimental Protocols
Protocol 1: Standardized Zeta Potential Measurement for Coating Assessment Objective: To obtain reliable and reproducible zeta potential measurements of coated nanoparticles for trend analysis. Materials: Purified nanoparticle dispersion, appropriate dispersant (e.g., 1 mM KCl or specific buffer), pH meter, zeta potential analyzer (equipped with M3-PALS technology), disposable folded capillary cells. Procedure:
- Sample Preparation: Dilute the nanoparticle batch in a low-conductivity electrolyte (e.g., 1 mM KCl) or its formulation buffer to achieve an optimum concentration for the instrument (typically a count rate of 200-500 kcps). Ensure the pH of the diluted sample is recorded and consistent (e.g., pH 7.4 ± 0.1).
- Cell Loading: Rinse the disposable capillary cell with the dispersant, then load the sample using a syringe, avoiding air bubbles.
- Instrument Setup: Insert cell into the instrument. Set temperature to 25.0 °C and allow equilibration for 120 seconds. Enter the dispersant viscosity, refractive index, and dielectric constant parameters.
- Measurement: Perform a minimum of 3 sequential runs (consisting of 10-15 sub-runs each) per sample. Set the instrument to automatically calculate and report the zeta potential (ζ) in millivolts (mV) and the electrophoretic mobility distribution width.
- Data Recording: Record the mean zeta potential and the derived Z-Average (mean electrophoretic mobility) for each batch. The zeta potential distribution (peak width) should be noted as a measure of coating homogeneity.
Protocol 2: Coating Efficiency Workflow for PEGylated Liposomes Objective: To monitor the efficiency of PEG-phospholipid incorporation into a liposomal formulation. Materials: Lipid film (e.g., HSPC, Cholesterol), PEG-DSPE, chloroform, hydration buffer (e.g., 10 mM HEPES, pH 7.4), extruder, Zeta Potential Analyzer, 1 mM KCl solution. Procedure:
- Formulation: Prepare two lipid films: Batch A (without PEG-DSPE) and Batch B (with 5 mol% PEG-DSPE). Hydrate and extrude both to identical sizes (~100 nm).
- Purification: Purify both batches identically via dialysis or size exclusion chromatography to remove unencapsulated materials.
- Dilution: Dilute purified liposomes from both batches into 1 mM KCl to the same final lipid concentration (~0.1 mg/mL).
- Measurement: Apply Protocol 1 to measure zeta potential for Batch A (uncoated control) and Batch B (PEG-coated).
- Analysis: Successful PEG coating is indicated by a significant attenuation (shift toward neutral) of the zeta potential for Batch B compared to Batch A. This trend, repeated across multiple production runs, confirms consistent PEGylation.
4. Mandatory Visualizations
Title: Nanoparticle Coating QC Workflow Using Zeta Potential
Title: Zeta Potential Measurement Protocol Steps
5. The Scientist's Toolkit: Essential Research Reagent Solutions
Table 3: Key Materials for Zeta Potential Analysis of Coated Nanoparticles
| Item | Function & Importance |
|---|---|
| Standard Ionic Strength KCl (1 mM) | Low-conductivity dispersant for accurate measurement; reduces electrode polarization. Provides consistent ionic background for batch comparisons. |
| Disposable Folded Capillary Cells | Ensures no cross-contamination between samples. Standardized cell geometry is critical for reproducible measurements. |
| NIST-Traceable Zeta Potential Reference Material (e.g., -50 mV latex) | Validates instrument performance and measurement protocol before sample analysis. |
| pH Buffer Standards (pH 4, 7, 10) | For calibrating pH meter used to verify sample pH, a critical parameter affecting zeta potential. |
| Ultrapure Water (Type I, 18.2 MΩ·cm) | Required for preparing all dispersants and dilution buffers to avoid contaminant ions. |
| Specific Coating Reagents (e.g., PEG-Lipids, Polymers) | High-purity, well-characterized coating materials are essential for reproducible surface modification and zeta trends. |
| Size Exclusion Chromatography Columns | For precise purification of coated nanoparticles to remove unreacted coating material, which can interfere with zeta readings. |
Within nanoparticle-based drug development, zeta potential is a critical quality attribute (CQA) indicating colloidal stability and predicting in vivo behavior. For regulatory filings, the analytical method used to measure zeta potential must be fully validated per ICH Q2(R1) guidelines. This application note details compliance and best practices, framed within the thesis on measuring zeta potential for nanoparticle surface charge research.
ICH Q2(R1) Validation Parameters for Zeta Potential Analysis
Table 1: ICH Q2(R1) Validation Parameters and Target Criteria for Zeta Potential Methods
| Validation Parameter | Objective in Zeta Potential Context | Typical Target / Acceptance Criterion |
|---|---|---|
| Specificity | Ability to assess surface charge unaffected by medium components. | No significant interference from buffers/biological fluids (< ±2 mV shift). |
| Accuracy | Closeness of mean result to an accepted reference value. | Recovery of 98-102% vs. certified reference material (e.g., -50 ± 5 mV standard). |
| Precision | ||
| Repeatability | Agreement under identical conditions (same instrument, analyst, day). | RSD ≤ 5% for n=10 measurements of same sample. |
| Intermediate Precision | Agreement within-lab (different days, analysts, instruments). | RSD ≤ 10% for n=6 measurements across variables. |
| Detection Limit (DL) | Lowest analyte (charge difference) detectable but not necessarily quantifiable. | Signal-to-Noise ratio ≥ 3:1 for near-zero potential samples. |
| Quantitation Limit (QL) | Lowest amount of charge difference that can be quantified with suitable precision/accuracy. | Signal-to-Noise ratio ≥ 10:1, with RSD ≤ 20% at that level. |
| Linearity | Ability to obtain results proportional to analyte concentration (or charge density). | R² ≥ 0.990 over specified range (e.g., -100 mV to +100 mV). |
| Range | Interval between upper and lower levels of analyte demonstrating suitability. | Confirmed by linearity, precision, and accuracy studies. |
| Robustness | Capacity to remain unaffected by small, deliberate variations in method parameters. | Zeta potential change < ±3 mV for variations in temperature (±2°C), pH (±0.2), dilution factor (±5%). |
Application Notes & Detailed Experimental Protocols
Protocol: Validation of Zeta Potential Method for Lipid Nanoparticles (LNPs)
Objective: To perform an ICH Q2(R1) compliant validation of a zeta potential method for an siRNA-loaded LNP formulation using electrophoretic light scattering (ELS).
Materials & Equipment:
- Zeta potential analyzer with M3-PALS technology.
- Disposable folded capillary cells (or appropriate cuvettes).
- Certified zeta potential transfer standard (-50 mV ± 5 mV).
- siRNA-LNP test formulation (lot X).
- Dilution buffer: 1 mM KCl, pH 7.4, 0.22 µm filtered.
- Temperature-controlled sample chamber.
Procedure:
- System Suitability: Equilibrate instrument to 25°C. Measure the certified standard in triplicate. The mean must be within -50 mV ± 5 mV.
- Sample Preparation: Dilute LNP formulation in dilution buffer to achieve an optimal count rate (typically 50-200 kcps). Ensure dilution does not alter surface properties (confirm via robustness study).
- Specificity: Prepare (a) LNP in buffer, (b) buffer alone, (c) LNP spiked into simulated biological matrix (e.g., 10% serum). Measure each (n=5). The buffer result should be ~0 mV. Compare (a) and (c) for interference.
- Linearity & Range: Create a dilution series of the LNP sample (e.g., 1:10 to 1:1000). Plot measured zeta potential vs. dilution factor (or concentration). Assess linearity across the intended working range.
- Accuracy: Using a standard reference material, perform recovery studies at low, mid, and high points of the charge range if possible. Report % recovery.
- Precision: Repeatability: Measure one prepared LNP sample 10 times consecutively. Calculate mean and RSD. Intermediate Precision: Repeat the repeatability study on three different days, with two analysts, using two instruments (if applicable).
- Robustness: Measure a single LNP batch while varying key parameters: temperature (23°C, 25°C, 27°C), buffer pH (7.2, 7.4, 7.6), and equilibration time (30 sec, 120 sec, 300 sec). Record impact on result.
Protocol: Documentation Best Practices for Regulatory Submission
Objective: To outline the essential documentation required to support zeta potential data in an Investigational New Drug (IND) or Marketing Authorization Application (MAA).
Required Documents:
- Analytical Procedure: A detailed, stepwise Standard Operating Procedure (SOP).
- Validation Report: A comprehensive report summarizing all data from Table 1 studies, with raw data attached in an appendix.
- System Suitability Test (SST) Protocol: Defined criteria to be checked before sample analysis.
- Sample Analysis Report: For each batch, include sample ID, preparation details, SST results, raw measurements, mean zeta potential, and polydispersity index (PdI) of the mobility distribution.
- Change Control Log: Documentation of any modifications to the method or instrument software.
Visualizations
Title: ICH Q2 Method Validation Workflow for Zeta Potential
Title: Electrophoretic Light Scattering (ELS) Principle for Zeta Potential
The Scientist's Toolkit: Research Reagent Solutions
Table 2: Essential Materials for Zeta Potential Analysis in Regulatory Studies
| Item | Function & Importance in Regulatory Context |
|---|---|
| Zeta Potential Transfer Standard | Certified material (e.g., -50 mV ± 5 mV) for daily instrument qualification and validation accuracy studies. Mandatory for proving data integrity. |
| Disposable Folded Capillary Cells | Ensure no cross-contamination between samples. Lot-to-lot consistency is critical for robustness. Prevents electrode degradation issues. |
| Standardized Dilution Buffers | Low ionic strength buffers (e.g., 1 mM KCl) for consistent sample preparation. Must be specified in SOP. pH and conductivity must be controlled and reported. |
| Nanoparticle Stability Reference | Well-characterized control nanoparticle (e.g., polystyrene latex) for long-term method performance monitoring and trend analysis. |
| Quality Control (QC) Sample | In-house, stable formulation aliquot with predefined acceptance range (e.g., -30 ± 3 mV). Run with each analytical batch to demonstrate system control. |
| Electronic Laboratory Notebook (ELN) | For complete, audit-proof data capture, linking raw measurements, sample prep notes, instrument logs, and resulting calculations. |
Conclusion
Mastering zeta potential measurement is essential for rational nanomaterial design, particularly in drug delivery. A robust measurement strategy integrates foundational understanding of electrokinetics, meticulous methodological execution, proactive troubleshooting, and rigorous validation. The obtained value is not merely a number but a critical predictor of nanoparticle stability, cellular interactions, and in vivo fate. As nanomedicine advances toward targeted therapies and personalized medicine, zeta potential analysis will play an increasingly pivotal role in quality-by-design (QbD) frameworks, accelerating the translation of stable, effective nanotherapeutics from lab bench to clinical application. Future directions point toward high-throughput screening, in-situ monitoring in biological fluids, and the development of standardized protocols for regulatory harmonization.