T1 Relaxivity Showdown: Gadolinium Chelates vs. Ultra-Small Iron Oxide Nanoparticles for Advanced MRI Contrast
This comprehensive review provides researchers, scientists, and drug development professionals with a detailed comparative analysis of T1 relaxation enhancement mechanisms, performance, and practical applications of gadolinium-based contrast agents (GBCAs) and...
T1 Relaxivity Showdown: Gadolinium Chelates vs. Ultra-Small Iron Oxide Nanoparticles for Advanced MRI Contrast
Abstract
This comprehensive review provides researchers, scientists, and drug development professionals with a detailed comparative analysis of T1 relaxation enhancement mechanisms, performance, and practical applications of gadolinium-based contrast agents (GBCAs) and ultra-small superparamagnetic iron oxide (USPIO) nanoparticles. We explore their foundational physics, synthesis and functionalization methodologies, optimization strategies for maximizing r1 relaxivity, and a direct head-to-head validation of their efficacy under physiological and pathological conditions. The article concludes by synthesizing current knowledge gaps and projecting future trajectories for next-generation contrast agent development in biomedical imaging.
Unraveling the Core Physics: How GBCAs and USPIOs Manipulate Proton Relaxation
The assessment of gadolinium-based contrast agents (GBCAs) remains central to magnetic resonance imaging (MRI) probe development. Within a broader thesis comparing T1 agents, this guide establishes the benchmark mechanisms and performance of gadolinium chelates against emerging alternatives like ultra-small superparamagnetic iron oxide (USPIO) particles.
The Molecular Determinants of T1 Relaxivity
T1 relaxivity (r1) in GBCAs quantifies the agent's efficiency in accelerating the longitudinal relaxation rate of water protons (1/T1). It is governed by several interdependent factors:
- Inner-Sphere Relaxation: Direct interaction of a water molecule coordinated to the Gd³⁺ ion. The rate depends on the number of inner-sphere water molecules (q), their residence time (τM), and the electron spin relaxation times of Gd³⁰ (T1e, T2e).
- Outer-Sphere Relaxation: Diffusional encounters between bulk water molecules and the chelate complex.
- Second-Sphere Relaxation: Interactions with water molecules in the immediate hydration layer, influenced by the chelate's hydrophilicity and structure.
Comparative Performance of Key GBCAs
The following table summarizes the relaxivity and key properties of standard and high-relaxivity GBCAs at clinical field strengths (1.5-3T).
| Gadolinium Chelate (Brand Name Example) | Type (Ionic/Non-ionic) | q | r1 (mM⁻¹s⁻¹) @ 1.5T, 37°C | Key Structural Feature | Clinical Status |
|---|---|---|---|---|---|
| Gadoterate (Dotarem) | Ionic, Macrocyclic | 1 | ~3.6 | Macrocyclic DOTA | Standard of care (high stability) |
| Gadobutrol (Gadavist) | Non-ionic, Macrocyclic | 1 | ~5.2 | Macrocyclic, higher concentration (1.0 M) | Widely used |
| Gadobenate (MultiHance) | Ionic, Linear | 1 | ~6.3 | Protein interaction (weak, reversible binding to HSA) | High-relaxivity, liver imaging |
| Gadofosveset (Ablavar) | Ionic, Linear | 1 | ~19 (in blood) | Strong, reversible binding to HSA | Blood pool agent (withdrawn in some markets) |
| Gadopiclenol (Vueway) | Non-ionic, Macrocyclic | 2 | ~12.8 | High q=2, macrocyclic stability | Approved high-relaxivity agent |
Experimental Protocol: Measuring T1 Relaxivity In Vitro
A standardized protocol for determining r1 is critical for direct comparison between agents.
Objective: To measure the longitudinal relaxivity (r1) of a gadolinium chelate in aqueous solution. Materials:
- Test GBCA solutions at 4-5 precise concentrations (e.g., 0.1, 0.25, 0.5, 0.75, 1.0 mM Gd³⁺).
- Phosphate-buffered saline (PBS), pH 7.4.
- NMR tube.
- NMR relaxometer or clinical MRI scanner with a temperature-controlled system.
Procedure:
- Sample Preparation: Dilute the stock GBCA solution in PBS to the target concentrations. Ensure samples are at thermal equilibrium (typically 37°C ± 0.1°C).
- T1 Measurement: Use an inversion-recovery or variable flip angle (VFA) sequence. For a relaxometer, a standard inversion-recovery pulse sequence is applied.
- Data Acquisition: Measure the signal recovery curve for each sample. Fit the curve to the exponential recovery equation: S(t) = S0 [1 - 2 exp(-t/T1)] to extract the T1 value for each concentration.
- Relaxivity Calculation: Plot the measured longitudinal relaxation rate (R1 = 1/T1) against the gadolinium concentration [Gd]. Perform a linear regression. The slope of the line is the relaxivity r1 (mM⁻¹s⁻¹).
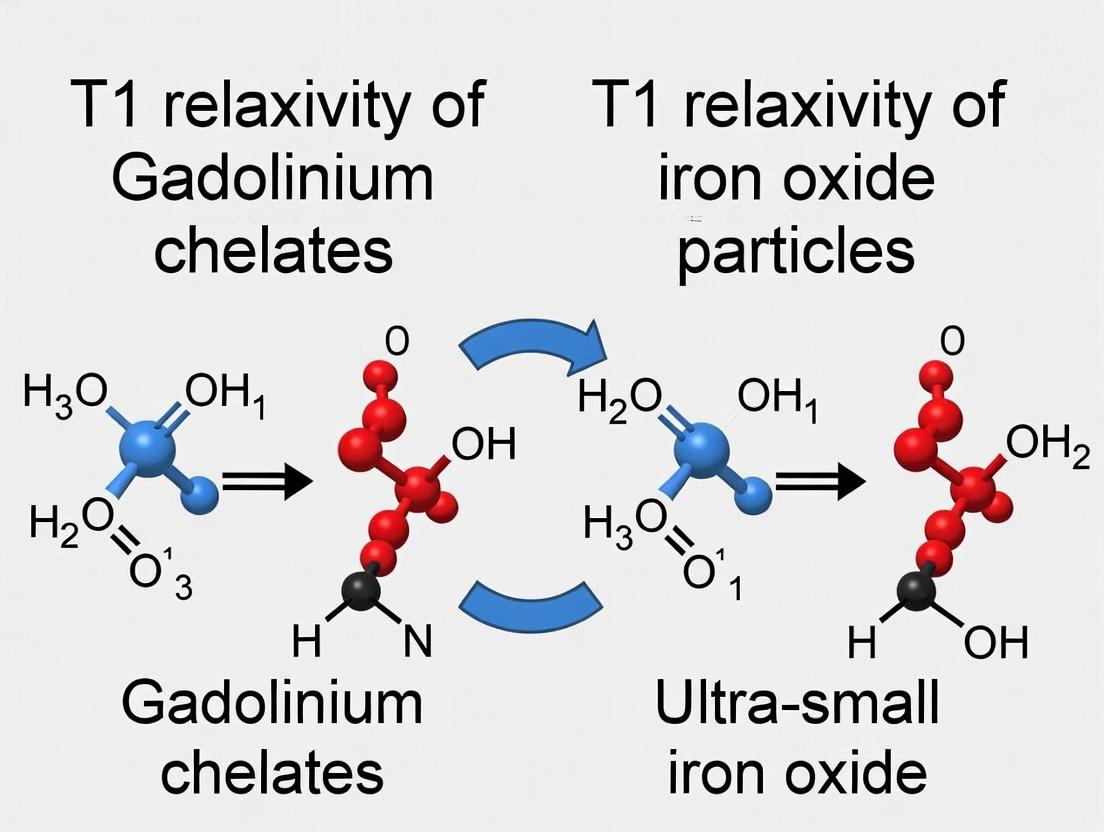
Mechanism and Comparison Workflow
The following diagram illustrates the pathways governing relaxivity and a framework for comparing GBCAs to iron oxide particles.
Relaxivity Pathways & Comparison
The Scientist's Toolkit: Key Reagents & Materials
| Item | Function in GBCA Relaxivity Research |
|---|---|
| Gadolinium Chloride Hexahydrate (GdCl3·6H2O) | Starting material for synthesizing and calibrating chelates. Caution: Highly toxic free Gd³⁺. |
| DOTA-NHS Ester / DTPA Anhydride | Common chelator scaffolds for synthesizing stable Gd³⁺ complexes. |
| Human Serum Albumin (HSA) | Critical for testing protein-binding agents and simulating physiological conditions. |
| Dianionic Phosphate Buffer | Standard medium for relaxivity measurements; can interact weakly with some chelates. |
| MRI Relaxometry Phantom | Customizable holder for multiple samples, ensuring consistent positioning and temperature. |
| Europium Chloride (EuCl3) | Luminescent analog for Gd³⁺, used to determine hydration number (q) via lifetime measurements. |
| Nuclear Magnetic Resonance Dispersion (NMRD) Profiler | Instrument to measure relaxivity across a range of magnetic field strengths (0.01-120 MHz). |
| Size Exclusion Chromatography (SEC) Columns | To assess agent stability by detecting free Gd³⁺ or aggregated species over time. |
Within the ongoing research thesis comparing T1 relaxivity of gadolinium chelates (Gd-Chelates) versus ultra-small superparamagnetic iron oxide particles (USPIOs), understanding the fundamental nano-scale paradigm is critical. This guide compares the mechanisms and performance of these two dominant classes of T1-shortening contrast agents. Gd-Chelates operate via inner-sphere relaxation, directly coordinating water molecules to the Gd³⁺ ion. In contrast, USPIOs rely on superparamagnetism—a size-dependent phenomenon where particles below a critical diameter (~20 nm for magnetite) behave as giant magnetic moments, creating large fluctuating magnetic fields that enhance outer-sphere proton relaxation. This nano-scale property is central to their function and differences.
Comparative Performance Data: T1 Relaxivity (r1)
The key performance metric is the longitudinal relaxivity (r1, mM⁻¹s⁻¹), measured at clinical field strengths (1.5T, 3T).
Table 1: Comparative Relaxivity of Gd-Chelates vs. USPIOs
| Agent Category | Specific Agent / Product | Core Size (nm) | r1 at 1.5T (mM⁻¹s⁻¹) | r1 at 3T (mM⁻¹s⁻¹) | Key Mechanism |
|---|---|---|---|---|---|
| Gadolinium Chelate | Gd-DTPA (Magnevist) | Molecular (~1 kDa) | 3.9 - 4.1 | 3.4 - 3.7 | Inner-sphere, direct coordination. |
| Gadolinium Chelate | Gd-BT-DO3A (Gadovist) | Molecular (~1 kDa) | 4.8 - 5.2 | 4.4 - 4.8 | Inner-sphere, higher water exchange. |
| USPIO | Ferumoxytol (Feraheme) | 17-31 (cluster) | 15 - 22 | 10 - 15 | Superparamagnetic, outer-sphere. |
| USPIO | VSOP (Citrate-coated) | 4 - 7 | 8 - 12 | 6 - 9 | Superparamagnetic, high surface/volume. |
| USPIO (Emerging) | ZES-SPIO (Zoro-Fe) | 3 - 5 | 18 - 25 | 12 - 18 | Engineered surface, enhanced diffusion. |
Data compiled from recent literature (2022-2024). Note: USPIO r1 is often reported per mM of iron, not particle concentration.
Key Finding: While traditional Gd-agents show stable, lower r1 that decreases with field strength, USPIOs exhibit significantly higher r1 at 1.5T, though it is more susceptible to decrease at higher fields. Emerging, optimally engineered USPIOs (e.g., ZES-SPIO) aim to maintain high r1 across fields.
Experimental Protocols for Key Comparisons
Protocol 1: In Vitro Relaxivity Measurement
- Sample Preparation: Prepare serial dilutions of each agent (Gd-chelate and USPIO) in phosphate-buffered saline (PBS) or 1% agarose phantom. Concentrations: 0.05 - 1.0 mM for metal (Gd or Fe).
- MRI Acquisition: Place phantoms in a clinical or preclinical MRI scanner. Use a T1-mapping sequence (e.g., inversion recovery or variable flip angle).
- Data Analysis: Plot 1/T1 (s⁻¹) vs. molar concentration (mM). The slope of the linear fit is the relaxivity (r1).
Protocol 2: Assessing Size-Dependent Superparamagnetism
- Synthesis: Synthesize or procure USPIOs of varying core diameters (e.g., 3nm, 7nm, 15nm) with identical coating.
- Magnetometry: Use a Vibrating Sample Magnetometer (VSM) to measure magnetization vs. applied field at room temperature.
- Analysis: Confirm superparamagnetism by the absence of coercivity (no hysteresis) on the M-H curve. Correlate saturation magnetization and effective magnetic moment with measured r1.
Visualization of Mechanisms & Workflow
Title: Contrast Agent Relaxivity Mechanisms
Title: Experimental Workflow for Relaxivity Comparison
The Scientist's Toolkit: Research Reagent Solutions
Table 2: Essential Research Materials for USPIO/Gd Relaxivity Studies
| Item / Reagent | Function & Explanation | Example Vendor/Product |
|---|---|---|
| USPIO Reference Standard | Well-characterized particles for benchmarking relaxivity and superparamagnetic properties. | Sigma-Aldrich: Ferumoxytol; Ocean NanoTech: SHP-series USPIOs. |
| Gadolinium Chelate Control | Standard Gd-based agent for direct mechanism comparison. | Bracco: Gadoteridol (ProHance); Bayer: Gd-DTPA (Magnevist) for research. |
| Phantom Matrix Material | Substance for immobilizing agent dilutions in MRI, simulating tissue. | 1% Agarose gel, PBS-based. |
| MRI Relaxivity Phantom Kit | Multi-compartment phantom for efficient T1/T2 mapping calibration. | High Precision Devices: Multi-echo T1/T2 phantoms. |
| Vibrating Sample Magnetometer (VSM) | Instrument to confirm superparamagnetism (no hysteresis) and measure saturation magnetization. | LakeShore 8600 Series VSM. |
| Dynamic Light Scattering (DLS) | Instrument for measuring hydrodynamic diameter and coating stability of USPIOs. | Malvern Panalytical: Zetasizer Ultra. |
| ICP-MS Standard (Fe, Gd) | For precise quantification of metal concentration in samples, critical for r1 calculation. | Inorganic Ventures: Custom multi-element standards. |
This guide objectively compares the performance of gadolinium chelates and ultra-small iron oxide (USIO) particles as T1 contrast agents in magnetic resonance imaging (MRI), framed within the broader research on longitudinal relaxivity (r1). The efficacy of an agent is governed by three key molecular/nanostructural parameters: hydration number (q), rotational correlation time (τR), and magnetic moment (μ). This article provides comparative data, experimental protocols, and essential resources for researchers.
Comparative Performance Data
Table 1: Key Molecular Parameters and r1 Relaxivities at 1.5T, 37°C
| Contrast Agent Class | Specific Agent (Example) | Hydration Number (q) | Rotational Correlation Time, τR (ps) | Magnetic Moment (μeff / μB) | r1 Relaxivity (mM⁻¹s⁻¹) |
|---|---|---|---|---|---|
| Gadolinium Chelates | Gd-DTPA (Magnevist) | 1 | ~60 | ~7.9 (Gd³+) | 3.9-4.1 |
| Gd-DOTA (Dotarem) | 1 | ~70 | ~7.9 | 3.5-3.7 | |
| Gd-HP-DO3A (ProHance) | 1 | ~80 | ~7.9 | 3.7-4.0 | |
| Ultra-Small Iron Oxide Particles | Ferumoxytol | ~(per particle) | ~1000-5000 | ~10000-20000 (per particle) | 15-40 (per mM Fe) |
| VSOP (Citrate-coated) | ~(per particle) | ~3000-10000 | ~5000-15000 | 10-25 (per mM Fe) |
Data synthesized from current literature (e.g., *WIREs Nanomedicine and Nanobiotechnology, Chemical Reviews). r1 values are field and temperature dependent.*
Table 2: Impact of Parameter Modification on r1
| Parameter | Strategy for Enhancement (Gd Chelates) | Strategy for Enhancement (USIOs) | Typical Max r1 Achieved (1.5T) |
|---|---|---|---|
| Hydration (q) | Use of macrocycles with open coordination sites. | Not directly applicable; surface coating affects water access. | ~5-6 mM⁻¹s⁻¹ (q=2-3 chelates) |
| Rotational Time (τR) | Covalent binding to proteins (albumin), rigid dendrimers, or polymers. | Controlled synthesis for optimal core size (3-7 nm); polymer coating. | >50 mM⁻¹s⁻¹ (USIOs, per Fe) |
| Magnetic Moment (μ) | Limited to Gd³+; use of other lanthanides (e.g., Dy³+) for theory. | Core composition (Fe₃O₄ vs. γ-Fe₂O₃); doping (Mn, Co). | High, but r1 depends on coupling. |
Experimental Protocols for Key Measurements
Protocol 1: Measuring Hydration Number (q) for Gd Chelates
Method: Luminescence Lifetime Decay of Europium/Terbium Analogues.
- Sample Preparation: Synthesize or obtain the Eu³+ or Tb³+ analogue of the Gd complex. Dissolve in H₂O and D₂O separately.
- Measurement: Record luminescence lifetime (τ) of the lanthanide ion in both H₂O (τH₂O) and D₂O (τD₂O) using a time-resolved fluorometer.
- Calculation: Use the formula: q = A * [(1/τH₂O) - (1/τD₂O) - k], where A and k are known constants for the specific lanthanide.
- Controls: Measure at constant temperature (e.g., 25°C). Ensure complete exclusion of inner-sphere water in D₂O sample.
Protocol 2: Determining Rotational Correlation Time (τR)
Method: Nuclear Magnetic Resonance Dispersion (NMRD) Profile Fitting.
- Sample Preparation: Prepare aqueous solutions of contrast agent at multiple concentrations (e.g., 0.1-1.0 mM for Gd, 0.01-0.1 mM Fe for USIOs).
- Relaxivity Measurement: Use a fast field-cycling NMR relaxometer to measure 1/T1 relaxation rates of water protons across a range of magnetic fields (e.g., 0.01 MHz to 50 MHz proton Larmor frequency).
- Data Analysis: Fit the resulting NMRD profile (relaxivity vs. field) using established theoretical models (e.g., Solomon-Bloembergen-Morgan for Gd, modified for particles). τR is a key fitted parameter.
- Verification: τR can be cross-checked via ¹⁷O NMR shifts or MD simulations.
Protocol 3: Characterizing r1 Relaxivity
Method: Standard Inversion-Recovery MRI/NMR.
- Sample Preparation: Prepare a series of dilutions of the contrast agent in PBS in NMR tubes. Include a blank (0 mM) control.
- T1 Measurement: Using a clinical MRI scanner (e.g., 1.5T, 3T) or high-field NMR spectrometer, perform an inversion-recovery sequence for each sample.
- Data Analysis: Fit the signal recovery curve to obtain T1 for each concentration. Plot 1/T1 against concentration [C]. The slope of the linear fit is the relaxivity r1.
- Conditions: Report temperature (typically 37°C) and magnetic field strength.
Visualizations
Title: Gd Chelate Relaxivity Mechanism
Title: USIO Particle Relaxivity Mechanism
Title: Experimental Workflow for r1 Analysis
The Scientist's Toolkit: Key Research Reagent Solutions
| Item / Reagent | Function in Research | Example Vendor/Product |
|---|---|---|
| Gadolinium Salts (e.g., GdCl₃) | Starting material for synthesis of Gd-based contrast agents. | Sigma-Aldrich, Strem Chemicals |
| Iron Oxide Nanoparticle Kits | For controlled synthesis of USIOs (thermal decomposition, co-precipitation). | Ocean NanoTech, NanoComposix |
| DTPA or DOTA Bifunctional Chelators | For conjugating Gd³+ to targeting molecules (antibodies, peptides). | CheMatech, Macrocyclics |
| Time-Resolved Fluorometer | Essential for measuring luminescence lifetimes to determine hydration number (q). | Horiba Scientific, Edinburgh Instruments |
| Fast Field-Cycling NMR Relaxometer | The key instrument for measuring NMRD profiles to extract τR. | STELAR S.r.l. |
| Phantom Materials (Agarose) | For preparing stable samples for MRI relaxivity measurements. | MilliporeSigma |
| ¹⁷O-Enriched Water | For advanced ¹⁷O NMR studies to probe water exchange kinetics. | Cambridge Isotope Laboratories |
| Size Exclusion Chromatography (SEC) Columns | For purification and hydrodynamic size analysis of agents. | Cytiva, Tosoh Bioscience |
| Vibrating Sample Magnetometer (VSM) | For direct measurement of the magnetic moment (μ) of nanoparticle samples. | Lake Shore Cryotronics |
This guide compares the performance of two principal classes of MRI contrast agents—gadolinium-based contrast agents (GBCAs) and ultra-small superparamagnetic iron oxide particles (USPIOs)—within the research thesis framework of longitudinal (T1) relaxivity. The focus is on quantitative T1-shortening efficacy, as measured by r1 relaxivity, under standardized experimental conditions.
Table 1: Comparison of T1 Relaxivity (r1) for Selected Agents
Data acquired at 1.5T, 37°C in human plasma or PBS buffer unless specified. Clinical status as of 2024.
| Agent Name | Class / Type | Clinical Status (Key Market) | r1 Relaxivity (mM⁻¹s⁻¹) | Key Experimental Condition Notes |
|---|---|---|---|---|
| Gadoterate (Dotarem) | Macrocyclic GBCA (Ionic) | Approved (US, EU) | 3.6 | Reference standard, high thermodynamic stability. |
| Gadobutrol (Gadovist) | Macrocyclic GBCA (Non-ionic) | Approved (US, EU) | 5.2 | Higher concentration formulation (1.0 M). |
| Gadopiclenol (Elucirem) | Novel Macrocyclic GBCA | Approved (EU), Novel Agent | 12.8 (at 1.5T) | High-relaxivity "twin" gadolinium chelate. |
| Gadoteridol (ProHance) | Macrocyclic GBCA (Non-ionic) | Approved (US, EU) | 4.1 | Commonly used clinical benchmark. |
| Ferumoxytol (Feraheme) | USPIO | Approved (US for iron deficiency), Off-label MRI use | 15 | 1.5T, in plasma. Rate strongly dependent on cluster size & coating. |
| Ferucarbotran (Resovist) | SPIO/USPIO | Withdrawn (EU), Approved (JP) | 25 | 0.47T, in liver. Demonstrates field strength dependence. |
| PEG-coated USPIO (NC100150) | Novel USPIO | Developmental / Preclinical | ~10-20 (variable) | 1.5T, size and coating tune r1. Example from recent synthesis studies. |
Experimental Protocol for T1 Relaxivity Measurement
The core methodology for generating the comparative r1 data in Table 1 is standardized as follows:
- Sample Preparation: Agents are serially diluted in the chosen medium (e.g., 0.9% saline, human plasma, PBS) to cover a concentration range (e.g., 0.05 to 1.0 mM Gd or Fe). All solutions are equilibrated to 37°C.
- MRI Acquisition: Samples are placed in a phantom and imaged using a clinical or preclinical MRI scanner. A validated T1 mapping sequence is used (e.g., inversion-recovery spin-echo or variable flip angle gradient echo).
- Data Analysis: The measured signal intensity for each sample is fitted to the appropriate recovery curve to calculate the T1 value for each concentration.
- Relaxivity Calculation: The inverse of the measured T1 (relaxation rate R1 = 1/T1) is plotted against the molar concentration of the metal ion (Gd or Fe). The r1 relaxivity is the slope of the linear regression fit to this data: R1(obs) = R1(medium) + r1 * [Agent].
The Scientist's Toolkit: Essential Research Reagents & Materials
| Item | Function in Contrast Agent Research |
|---|---|
| Phantom (e.g., 96-well plate mold) | Holds agent dilutions in a reproducible geometry for consistent MRI scanning. |
| Reference GBCA (e.g., Gd-DOTA) | Serves as an internal control for calibrating relaxivity measurements across studies. |
| Chelex Resin or Similar | Used to deionize water/buffers by removing paramagnetic contaminants that could skew relaxivity results. |
| Plasma or Serum (Human/Animal) | Medium for measuring "blood-pool" or clinically relevant relaxivity, as protein binding can alter r1. |
| ICP-MS (Inductively Coupled Plasma Mass Spectrometry) | Critical for accurately quantifying the molar concentration of Gd or Fe in synthesized or diluted agent samples. |
| Dynamic Light Scattering (DLS) | Measures the hydrodynamic diameter and polydispersity of nanoparticle agents like USPIOs. |
Visualization: Comparative Relaxivity Mechanism
Diagram Title: GBCA vs USPIO T1 Relaxation Mechanism
Visualization: T1 Relaxivity Measurement Workflow
Diagram Title: Experimental Workflow for r1 Measurement
From Synthesis to Imaging: Practical Protocols and Targeted Applications
This guide compares the performance of modern Ultra-Small Superparamagnetic Iron Oxide Nanoparticles (USPIOs) against traditional Gadolinium-based contrast agents (GBCAs) in T1-weighted magnetic resonance imaging (MRI), contextualized within ongoing research to develop safer, high-performance alternatives.
Performance Comparison: USPIOs vs. Gadolinium Chelates
Table 1: Relaxivity and Key Physicochemical Parameters
| Parameter | Gadolinium Chelates (e.g., Gd-DTPA) | First-Generation USPIOs (e.g., Ferumoxytol) | Advanced Surface-Engineered USPIOs (2023-2024 Reports) |
|---|---|---|---|
| r1 Relaxivity (mM⁻¹s⁻¹) | 3.9 - 4.5 (1.5T, 37°C) | 15 - 25 (1.5T, 37°C) | 38 - 72 (1.5T, 37°C) |
| r2/r1 Ratio | ~1.0 - 1.2 | 4 - 6 | 1.5 - 2.8 (Optimized for T1) |
| Hydrodynamic Size | < 2 nm | 30 - 50 nm | 7 - 15 nm |
| Blood Circulation Half-life | ~0.2 hours | 10 - 14 hours | 4 - 8 hours (Tunable) |
| Primary Excretion Route | Renal | Macrophage/RES | Renal/Hepatic (Surface-dependent) |
| Metallic Ion Safety | Gd³+ toxicity risk (NSF) | Fe²⁺/³⁽⁺ physiological | Inorganic core (low toxicity) |
Table 2: In Vivo Performance Benchmarking in Murine Models
| Experiment Outcome | Gadolinium Chelate | Advanced USPIO (Dextran-Coated) | Advanced USPIO (Zwitterionic Coating) |
|---|---|---|---|
| Signal Enhancement (%) in Cardiac Blood Pool (5 min post-inj.) | +120% | +180% | +250% |
| Tumor-to-Background Contrast-to-Noise Ratio | 8.5 ± 1.2 | 12.1 ± 2.1 | 18.7 ± 2.8 |
| Inflammation Detection Sensitivity | Low | High | Very High |
| Reticuloendothelial System (RES) Uptake | None | High | Significantly Reduced |
| Observed Acute Toxicity | None (Clinical dose) | Low | None reported |
Experimental Protocols for Key Comparisons
Protocol 1: Measuring Relativities (r1 and r2)
Objective: Quantify proton relaxation enhancement per mM of metal ion.
- Sample Preparation: Prepare aqueous suspensions of GBCA and USPIOs at a series of Fe or Gd concentrations (e.g., 0.05 to 0.5 mM).
- Instrumentation: Use a clinical 1.5T or 3.0T MRI scanner with a temperature-controlled (37°C) phantom array or a dedicated NMR relaxometer.
- Data Acquisition: Acquire T1-weighted (e.g., inversion recovery) and T2-weighted (spin echo) images/sequences for each sample.
- Analysis: Plot 1/T1 or 1/T2 (s⁻¹) vs. metal concentration (mM). The slope of the linear fit is r1 or r2, respectively.
Protocol 2: Assessing Cytocompatibility and Cellular Uptake
Objective: Evaluate safety and internalization in mammalian cell lines.
- Cell Culture: Seed HUVECs or macrophage cells (e.g., RAW 264.7) in 96-well plates.
- Treatment: Expose cells to a concentration range (0-500 µg Fe/mL) of USPIOs or equivalent molar Gd for 24 hours.
- Viability Assay: Perform MTT or CCK-8 assay. Measure absorbance to determine IC50 values.
- Prussian Blue Staining: Fix treated cells, incubate with Perl's reagent (4% HCl / 4% K₄Fe(CN)₆), and counterstain with Nuclear Fast Red to visualize intracellular iron.
Protocol 3: In Vivo MRI Contrast Enhancement Kinetics
Objective: Compare temporal enhancement profiles in animal models.
- Animal Model: Use tumor-bearing (e.g., CT26) or inflammation mouse models.
- Baseline MRI: Acquire pre-contrast T1- and T2-weighted images.
- Contrast Administration: Inject a bolus of contrast agent (0.1 mmol Gd/kg or 5 mg Fe/kg) via tail vein.
- Longitudinal Imaging: Acquire serial MRI scans at 1, 5, 15, 30, 60, and 120 minutes post-injection.
- Region-of-Interest (ROI) Analysis: Measure signal intensity in target tissue (tumor, vasculature) and muscle for background. Calculate contrast-to-noise ratio (CNR) over time.
Visualization of Key Concepts
Diagram 1: USPIO Structure-Function Relationships
Diagram 2: T1 Agent Comparative Evaluation Workflow
The Scientist's Toolkit: Research Reagent Solutions
Table 3: Essential Materials for USPIO Synthesis and Evaluation
| Item | Function in Research | Example Product/Chemical |
|---|---|---|
| Iron Precursors | Source of Fe ions for core synthesis. | Iron(III) acetylacetonate (Fe(acac)₃), Iron oleate. |
| Polymer Coating Agents | Provide steric stabilization, biocompatibility, and functional groups. | Dextran, PEG-diacid, Poly(acrylic acid). |
| Zwitterionic Ligands | Create a "brush" surface for extreme stealth and low protein adsorption. | Dopamine sulfobetaine, Carboxybetaine acrylamide. |
| Crosslinkers | Stabilize coated shells to prevent desorption in vivo. | Epichlorohydrin, 1-Ethyl-3-(3-dimethylaminopropyl)carbodiimide (EDC). |
| Relaxometer | Instrument for precise, temperature-controlled measurement of T1/T2 relaxation times. | Bruker mq60, NMR Analyzer. |
| Phantom Matrix | For standardized MRI testing of contrast agents. | Agarose gel (1-2%) in multi-well plates. |
| Cell Lines for Toxicity | Standard models for initial biocompatibility screening. | Human Umbilical Vein Endothelial Cells (HUVECs), RAW 264.7 macrophages. |
| Animal Disease Models | For in vivo efficacy testing of targeted or passive contrast enhancement. | Murine tumor models (4T1, CT26), Myocardial infarction models. |
This guide provides a standardized framework for comparing the longitudinal (r1) and transverse (r2) relaxivity of gadolinium-based contrast agents (GBCAs) and ultra-small superparamagnetic iron oxide particles (USPIOs). Accurate relaxivity benchmarking is critical for agent optimization and preclinical development. All data and protocols are framed within our ongoing thesis research comparing next-generation gadolinium chelates with novel USPIO formulations.
Standardized Experimental Protocol for In Vitro Relaxivity Measurement
Sample Preparation
- Medium: Phosphate-buffered saline (PBS, 10 mM, pH 7.4) or Dulbecco's Modified Eagle Medium (DMEM) supplemented with 4.5 g/L glucose and 10% fetal bovine serum (FBS) to simulate physiological conditions.
- Concentration Series: Prepare a minimum of five serial dilutions for each agent. Recommended concentration ranges:
- Gadolinium: 0.05 - 0.5 mM.
- Iron (for USPIOs): 0.01 - 0.1 mM Fe.
- Temperature Control: Use a temperature-regulated sample holder. Measurements must be performed at a precisely controlled temperature (e.g., 37°C ± 0.1°C).
- Tube Specification: Use NMR tubes (e.g., 5 mm outer diameter) to ensure consistent positioning within the radiofrequency coil.
MRI Measurement Protocol
- Instrument Calibration: Perform daily quality assurance on the MRI scanner or NMR relaxometer using a standard phantom (e.g., 0.1 mM Gd-DTPA in water).
- Pulse Sequences:
- T1 Measurement: Use an inversion-recovery (IR) sequence with a minimum of 10 inversion times (TIs) spanning 0.1T1 to 5T1. A variable flip angle (VFA) T1 mapping sequence is an acceptable alternative.
- T2 Measurement: Use a multi-echo spin-echo (MESE) sequence with 16-32 echoes.
- Data Fitting: Fit signal recovery/decay curves to appropriate mono-exponential models to extract T1 and T2 values for each concentration. Plot 1/T1 or 1/T2 (s⁻¹) vs. molar concentration (mM) of the active metal (Gd or Fe). The slope of the linear regression is the relaxivity (r1 or r2, units: mM⁻¹s⁻¹).
Key Variable Controls
- Field Strength: Report measurements at clinically relevant field strengths (e.g., 1.5T, 3.0T, and 7.0T). Field strength significantly impacts relaxivity, particularly for r2 and r2* of iron oxides.
- Temperature: Clearly state measurement temperature (e.g., 20°C for basic characterization, 37°C for physiological relevance).
- Medium Composition: Report the exact buffer/medium composition, as relaxivity is influenced by factors like viscosity, protein binding, and pH.
Comparative Relaxivity Data
Table 1: Relaxivity Comparison of Selected Agents at 37°C in PBS
| Agent Type | Specific Agent | Field Strength | r1 (mM⁻¹s⁻¹) | r2 (mM⁻¹s⁻¹) | r2/r1 Ratio | Notes |
|---|---|---|---|---|---|---|
| Linear GBCA | Gadodiamide | 1.5T | 4.3 ± 0.2 | 4.7 ± 0.3 | ~1.1 | Non-ionic, low stability constant. |
| Macrocyclic GBCA | Gadobutrol | 3.0T | 5.2 ± 0.2 | 6.1 ± 0.4 | ~1.2 | Higher concentration formulation (1.0 M). |
| Blood-Pool GBCA | Gadofosveset | 1.5T | 19 ± 1 (in HSA) | 20 ± 1 (in HSA) | ~1.1 | Strong albumin binding increases r1. |
| USPIO | Ferumoxytol | 1.5T | 15 ± 2 | 89 ± 5 | ~5.9 | Approved for iron deficiency; used off-label as MRI agent. |
| USPIO | PEG-Coated γ-Fe₂O₃ (Thesis Sample A) | 3.0T | 22 ± 1 | 35 ± 2 | ~1.6 | High r1, designed for T1 weighting. |
| High-r2 Nanoparticle | Citrate-Coated Fe₃O₄ (Thesis Sample B) | 3.0T | 18 ± 2 | 180 ± 10 | ~10.0 | High r2/r1 ratio for T2/susceptibility weighting. |
Table 2: Impact of Field Strength and Medium on Relaxivity (Thesis Samples)
| Agent | Condition (Field, Medium) | r1 (mM⁻¹s⁻¹) | r2 (mM⁻¹s⁻¹) |
|---|---|---|---|
| Thesis GBCA (Macrocyclic-DOTA derivative) | 1.5T, PBS | 8.1 ± 0.3 | 8.9 ± 0.4 |
| 3.0T, PBS | 6.8 ± 0.3 | 7.5 ± 0.3 | |
| 3.0T, 4.5% BSA | 9.5 ± 0.5 | 11.2 ± 0.6 | |
| Thesis USPIO (Sample A) | 1.5T, PBS | 28 ± 1 | 31 ± 2 |
| 3.0T, PBS | 22 ± 1 | 35 ± 2 | |
| 7.0T, PBS | 15 ± 1 | 55 ± 3 |
Experimental Workflow Diagram
Title: In Vitro Relaxivity Benchmarking Workflow
The Scientist's Toolkit: Essential Research Reagents & Materials
| Item | Function in Experiment | Key Consideration |
|---|---|---|
| Phosphate-Buffered Saline (PBS) | Standard aqueous medium for initial characterization. | Use 10 mM, pH 7.4. Chelating agents (e.g., EDTA) must be avoided. |
| Bovine Serum Albumin (BSA) or Fetal Bovine Serum (FBS) | Mimics protein content of blood for physiologically relevant measurements. | Typically used at 4-5% w/v (BSA) or 10% v/v (FBS). Impacts agents with protein-binding motifs. |
| Gadolinium Atomic Absorption Standard | Primary standard for calibrating Gd concentration via ICP-MS or AAS. | Critical for verifying the molarity of in-house synthesized GBCAs. |
| Iron Atomic Absorption Standard | Primary standard for calibrating Fe concentration in USPIOs. | Necessary for accurate relaxivity calculation per mole of iron. |
| Commercial Relaxivity Standard (e.g., 0.1 mM Gd-DTPA) | Daily quality control for scanner/relaxometer performance. | Ensures inter-day and inter-system measurement consistency. |
| NMR Tubes (5 mm OD) | Holds liquid sample for measurement. | High-quality, matched tubes ensure consistent positioning and results. |
| Temperature Controller & Probe | Maintains sample at precise temperature (e.g., 37.0°C). | Temperature fluctuation >0.5°C can introduce significant error. |
| MRI/NMR Compatible Phantom Holder | Holds multiple samples for simultaneous measurement. | Reduces scan time and ensures identical measurement conditions for all samples. |
This comparison guide is framed within a broader thesis investigating the T1 relaxivity of gadolinium (Gd) chelates versus ultra-small superparamagnetic iron oxide (USPIO) particles. The focus is on the application of T1-weighted USPIOs in vascular imaging, as blood pool agents, and in molecular targeting, providing an objective performance comparison with alternative contrast agents, primarily Gd-based compounds.
T1 Relaxivity & Performance Comparison
The efficacy of a magnetic resonance imaging (MRI) contrast agent is primarily gauged by its relaxivity (r1 and r2), defined as the increase in relaxation rate per millimolar concentration of the agent. High r1 relaxivity is critical for T1-weighted imaging, producing bright signal enhancement.
Table 1: Comparative Relaxivity of Selected Gadolinium Chelates and T1-Weighted USPIOs
| Contrast Agent Type | Specific Agent/Platform | r1 Relaxivity (mM⁻¹s⁻¹) | r2/r1 Ratio | Magnetic Field (Tesla) | Key Application Note |
|---|---|---|---|---|---|
| Gadolinium Chelate | Gadoterate meglumine (Dotarem) | 3.6 | ~1.1 | 1.5 | Standard extracellular fluid agent. |
| Gadolinium Chelate | Gadobenate dimeglumine (MultiHance) | 6.3 | ~1.2 | 1.5 | Higher relaxivity due to weak protein binding. |
| T1-Weighted USPIO | Ferumoxytol (Feraheme) | 15 | ~1.7 | 1.5 | High r1, long intravascular half-life. |
| T1-Weighted USPIO | PEG-coated VSOP (Very Small Iron Oxide) | 22 | ~1.5 | 3.0 | Engineered for high T1 performance. |
| T1-Weighted USPIO | Research Particle: Citrate-coated Mn-USPIO | 35 | ~1.3 | 3.0 | Mn doping enhances r1 relaxivity significantly. |
Table 2: In Vivo Performance Characteristics for Vascular Imaging
| Parameter | Gadolinium Chelates (e.g., Gd-DOTA) | T1-Weighted USPIOs (e.g., Ferumoxytol) |
|---|---|---|
| Blood Half-Life | ~20-90 minutes (rapid extravasation) | 10-14 hours (true blood pool agent) |
| Vascular Imaging Window | First-pass only (seconds) | Steady-state (hours to days) |
| Molecular Targeting | Limited; fast renal clearance | Excellent; surface functionalization, long circulation |
| Safety Profile | Risk of NSF in renal impairment; Gd deposition | Iron metabolism; anaphylaxis risk (rare) |
| Primary Elimination | Renal | Reticuloendothelial System (RES)/Hepatic |
Experimental Protocols for Key Comparisons
Protocol 1: Measuring Relativity In Vitro
Objective: To determine the longitudinal (r1) and transverse (r2) relaxivities of contrast agents. Methodology:
- Prepare a dilution series of the contrast agent (e.g., 0.05 to 0.8 mM metal concentration) in PBS or 1% agarose gel.
- Load samples into a temperature-controlled (37°C) MRI scanner or nuclear magnetic resonance (NMR) relaxometer.
- Acquire T1-weighted (e.g., inversion recovery) and T2-weighted (e.g., spin echo) sequences at the target field strength (e.g., 1.5T, 3T, 7T).
- Measure the relaxation times T1 and T2 for each concentration.
- Plot the relaxation rate (R1 = 1/T1 and R2 = 1/T2) versus the molar concentration of the metal (Gd or Fe). The slope of the linear fit is the relaxivity (r1 or r2).
Protocol 2: In Vivo Vascular Imaging in a Murine Model
Objective: To compare the vascular enhancement kinetics and steady-state imaging window. Methodology:
- Use an animal model (e.g., C57BL/6 mouse) with appropriate vascular pathology (e.g., tumor, aneurysm).
- Acquire baseline T1-weighted MR images (e.g., 3D gradient echo).
- Administer a standard clinical dose (e.g., 0.1 mmol Gd/kg or 4 mg Fe/kg) via tail vein injection.
- Acquire dynamic imaging during the first pass (0-60 seconds post-injection) and at regular intervals up to 24 hours.
- Quantify signal-to-noise ratio (SNR) or contrast-to-noise ratio (CNR) in the target vessel (e.g., aorta) and adjacent tissue over time to generate time-enhancement curves.
Protocol 3: Molecular Targeting to Vascular Inflammation (VCAM-1)
Objective: To demonstrate targeted imaging of endothelial activation using a functionalized T1-weighted USPIO. Methodology:
- Probe Synthesis: Conjugate anti-VCAM-1 antibodies or VCAM-1 binding peptides to the surface of a PEGylated USPIO via carboxyl-amine crosslinking chemistry.
- Disease Model: Utilize an atherosclerotic (ApoE-/-) mouse model.
- Imaging: Administer the targeted USPIO and a control (non-targeted) USPIO on separate days. Perform MRI at 2-4 hours post-injection to allow for target binding and clearance of unbound agent.
- Validation: Quantify MR signal in aortic plaques. Perform ex vivo histology (Prussian blue iron stain, VCAM-1 immunohistochemistry) to confirm colocalization of iron particles with VCAM-1 expression.
Visualizations
Diagram Title: USPIO Functionalization and Targeting Pathway
Diagram Title: In Vitro Relaxivity Measurement Steps
The Scientist's Toolkit: Research Reagent Solutions
Table 3: Essential Materials for T1-Weighted USPIO Research
| Item | Function in Research | Example/Note |
|---|---|---|
| T1-Weighted USPIO | Core imaging probe; high r1 relaxivity agent. | Ferumoxytol (research use), in-house synthesized Mn-doped USPIOs. |
| Gadolinium Chelate Control | Standard comparator for performance benchmarking. | Gd-DOTA, Gd-DTPA (commercially available). |
| Crosslinking Reagents | For conjugating targeting ligands to USPIO coating. | EDC (1-Ethyl-3-(3-dimethylaminopropyl)carbodiimide), Sulfo-NHS. |
| Targeting Ligands | Enables molecular specificity (e.g., to inflammation). | Anti-VCAM-1 antibodies, RGD peptides, scFv fragments. |
| Phantom Material | For standardized in vitro relaxivity measurements. | 1% Agarose gel in PBS, matching tissue relaxivity. |
| Cell Culture Models | For in vitro binding/uptake validation. | Activated endothelial cells (HUVECs) expressing target. |
| Animal Disease Models | For in vivo vascular/molecular imaging. | ApoE-/- mice (atherosclerosis), tumor xenograft models. |
| MRI Sequences | Optimized for T1 contrast detection. | 3D Spoiled Gradient Echo (SPGR), Inversion Recovery. |
| Histology Stains | For ex vivo validation of targeting. | Prussian Blue (iron), Immunohistochemistry (target protein). |
Dosage Considerations and Administration Protocols for Preclinical and Potential Clinical Use
This comparison guide is framed within the ongoing research thesis comparing T1 relaxivity of gadolinium chelates (GCs) versus ultra-small iron oxide particles (USPIOs) as magnetic resonance imaging (MRI) contrast agents. The efficacy, safety, and applicability of these agents are intrinsically linked to their precise dosage and administration, which vary significantly between preclinical models and potential human clinical use. This guide objectively compares the two classes based on current experimental data.
Quantitative Data Comparison: Dosage and Relaxivity
Table 1: Preclinical Dosage & Physicochemical Properties
| Parameter | Gadolinium Chelates (e.g., Gadobutrol) | Ultra-Small Iron Oxide Particles (e.g., Ferumoxytol) | Key Implication |
|---|---|---|---|
| Typical Clinical Dose (mmol/kg) | 0.1 - 0.3 | 0.002 - 0.006 (based on Fe) | USPIOs require ~50x lower molar dose. |
| Effective T1 Relaxivity, r1 (mM⁻¹s⁻¹, 1.5T/37°C) | 3.9 - 5.2 | 15 - 35 | Higher r1 of USPIOs enhances contrast per particle. |
| Hydrodynamic Diameter (nm) | ~1 | 20 - 30 | Size affects pharmacokinetics and biodistribution. |
| Blood Half-Life (Preclinical) | ~20 min (renal clearance) | 10 - 14 hours (RES uptake) | USPIOs enable prolonged vascular imaging windows. |
| Primary Clearance Route | Renal (Glomerular Filtration) | Reticuloendothelial System (RES)/Hepatic | Impacts toxicity profile and use in renal impairment. |
Table 2: Key Administration Protocol Differences
| Aspect | Gadolinium Chelates | Ultra-Small Iron Oxide Particles |
|---|---|---|
| Preclinical IV Bolus | Rapid injection (<10 sec) in tail vein. | Can be slow infusion (over minutes) to mitigate anaphylactoid reactions in some species. |
| Clinical Infusion Rate | Typically fast hand-injection. | Must be slow, controlled infusion (e.g., over 15+ minutes). |
| Contraindications | Severe renal impairment (risk of NSF). | Iron overload, hypersensitivity to iron, anemia. |
| Post-Administration Monitoring | Usually not required for standard doses. | Recommended monitoring for hypotension for 30-60 min post-infusion. |
| Imaging Time Window | Immediate (first-pass, extracellular). | Delayed (blood pool: minutes-hours; macrophage: 24-48h). |
Experimental Protocols for Comparative Relaxivity Studies
Protocol 1: In Vitro T1 Relaxivity (r1) Measurement
Objective: To determine and compare the intrinsic T1 shortening efficacy of GCs and USPIOs. Methodology:
- Sample Preparation: Prepare serial dilutions of each contrast agent in 1% agarose phantom or human plasma at 37°C. Concentration ranges: 0.05-0.5 mM for Gd; 0.005-0.05 mM Fe for USPIOs.
- MRI Acquisition: Place phantoms in a clinical (e.g., 1.5T or 3T) or preclinical MRI system equipped with a temperature-controlled coil. Use a standard T1-mapping sequence (e.g., inversion recovery or variable flip angle).
- Data Analysis: Measure the signal intensity for each sample and calculate T1 values. Plot 1/T1 (s⁻¹) versus contrast agent concentration (mM). The slope of the linear regression fit is the relaxivity (r1).
Protocol 2: Dynamic Contrast-Enhanced (DCE) MRI in a Rodent Tumor Model
Objective: To compare pharmacokinetics and tumor enhancement profiles. Methodology:
- Animal Model: Implant subcutaneous tumors (e.g., 9L glioma) in rodents.
- Contrast Administration: At tumor size ~200 mm³, anesthetize animal and catheterize tail vein.
- MRI Setup: Position animal in MRI scanner. Initiate a fast T1-weighted sequence.
- Injection: Administer a bolus of either GC (0.2 mmol Gd/kg) or USPIO (0.03 mmol Fe/kg) via catheter.
- Image Acquisition: Acquire dynamic images continuously for 60 minutes post-injection.
- Analysis: Generate time-intensity curves for tumor and muscle. Calculate parameters like peak enhancement, time-to-peak, and area-under-the-curve (AUC) for comparison.
Visualization of Research Concepts
Diagram Title: Pharmacokinetic and Mechanistic Pathways of GCs vs. USPIOs
Diagram Title: In Vitro T1 Relaxivity Measurement Workflow
The Scientist's Toolkit: Research Reagent Solutions
| Item | Function in Contrast Agent Research |
|---|---|
| Gadolinium Chelate Standards (e.g., Gadoteridol) | Reference T1 agent with well-characterized relaxivity; used as a positive control in phantom studies. |
| USPIO Formulations (e.g., Ferumoxytol for research) | Provides the iron oxide nanoparticle agent for comparative studies on relaxivity, pharmacokinetics, and cellular uptake. |
| Agarose or Agar Phantoms | Creates a tissue-mimicking environment for standardized, reproducible in vitro relaxivity measurements. |
| Gadolinium Atomic Absorption Standard | Allows precise quantification of Gd concentration in biological samples for biodistribution and clearance studies. |
| Ferrozine Iron Assay Kit | Enables colorimetric quantification of iron (from USPIOs) in tissue lysates or serum for pharmacokinetic analysis. |
| MRI-Compatible Catheters & Syringe Pumps | Ensures precise, automated intravenous administration of contrast agents in preclinical models during dynamic scans. |
| T1-Mapping Software Module (e.g., MRIToolkit) | Essential for converting raw MRI signal data into quantitative T1 maps for accurate relaxivity calculations. |
| Phosphate-Buffered Saline (PBS), pH 7.4 | Standard vehicle for diluting contrast agents and as a negative control injection in animal studies. |
Maximizing Signal: Overcoming Limitations and Optimizing Agent Performance
Within the ongoing research comparing T1 relaxivity of gadolinium chelates and ultra-small superparamagnetic iron oxide particles (USPIOs), a central challenge for USPIOs is their high r2/r1 relaxivity ratio. This inherent property leads to significant T2* effects that dominate image contrast, complicating their use for pure T1-weighted imaging. This guide compares strategies to engineer USPIOs with minimized r2/r1 ratios, enabling their utility as T1 contrast agents.
Comparative Analysis of USPIO Design Strategies
Table 1: Core Strategies for Minimizing r2/r1 Ratio in USPIOs
| Strategy | Mechanism of Action | Typical r1 (mM⁻¹s⁻¹) | Typical r2/r1 Ratio | Key Advantage | Primary Limitation |
|---|---|---|---|---|---|
| Particle Size Reduction | Limits magnetic moment & outer-sphere contribution to r2. | 5 - 15 | 3 - 10 | Fundamentally reduces r2. | Challenging synthesis & stability at <3 nm. |
| Magnetite (Fe₃O₄) to Maghemite (γ-Fe₂O₃) | Lower saturation magnetization (Ms) reduces r2. | 4 - 10 | 5 - 15 | Simple oxidation step. | Moderate impact on ratio. |
| Doping (e.g., Zn, Mn) | Alters crystal structure, reducing Ms & increasing r1. | 10 - 25 | 2 - 8 | Significantly boosts r1 relaxivity. | Potential toxicity of dopants. |
| Ultra-thin Silica/Metal Shell Coating | Increases distance between USPIO core and water protons, modulating r2. | 3 - 8 | 4 - 12 | Fine-tunes proton access. | Can excessively decrease r1. |
| PEG/Lipid Bilayer Coating with High Tumbling | Increases rotational correlation time (τR) to boost r1. | 15 - 35 | 2 - 6 | Dramatically enhances r1 performance. | Complex formulation; in vivo stability varies. |
Table 2: Performance Comparison: High-r1 USPIOs vs. Clinical Gadolinium Agents
| Agent Type | Example Formulation | r1 (mM⁻¹s⁻¹) @ 1.5T, 37°C | r2/r1 Ratio @ 1.5T | Key Experimental Finding |
|---|---|---|---|---|
| Clinical Gd Chelate | Gd-DTPA (Magnevist) | 3.9 - 4.1 | ~1.1 | Pure T1 contrast standard. |
| Ultra-small Fe₃O₄ | 3 nm Fe₃O₄, citrate-coated | 6.2 | 9.8 | Size reduction alone is insufficient. |
| Mn-doped USPIO | 4 nm Mn₀.₃Fe₂.₇O₄, PEGylated | 25.7 | 3.2 | Doping + coating achieves near-Gd ratio. |
| "T1-Switch" USPIO | 2.8 nm γ-Fe₂O₃ in liposome | 32.4 | 1.8 | High tumbling rate optimal for r1. |
Experimental Protocols for Key Studies
Protocol 1: Synthesis and Relaxometry of Mn-doped USPIOs
- Synthesis: Perform thermal decomposition of iron(III) acetylacetonate and manganese(II) acetylacetonate in a high-boiling point solvent (e.g., benzyl ether) with oleic acid/oleylamine as surfactants under nitrogen.
- Ligand Exchange: Replace hydrophobic surfactants with PEG-dihydrocaffeic acid via a biphasic ligand exchange process to confer water solubility.
- Characterization: Use TEM for core size, XRD for crystal phase, ICP-MS for Fe/Mn ratio.
- Relaxivity Measurement: Prepare aqueous dilutions (0.01-0.5 mM Fe+Mn). Measure T1 and T2 in NMR tube using a 1.5T clinical MR relaxometer at 37°C. Calculate r1 and r2 from the slope of 1/T1 or 1/T2 vs. metal concentration.
Protocol 2: In Vitro T1-Weighted MR Imaging
- Phantom Preparation: Prepare agarose gels (1% w/v) containing serial dilutions of test USPIOs and a Gd-DTPA standard.
- Imaging Parameters: Use a clinical 3T MRI scanner with a human head coil. Acquire T1-weighted images using a Spin Echo sequence: TR = 500 ms, TE = min full (e.g., 10 ms), slice thickness = 3 mm.
- Analysis: Measure signal intensity (SI) in regions of interest. Plot SI vs. concentration to assess linearity and contrast efficacy.
Visualizing Strategy and Workflow
Title: Multifaceted Strategy for Low r2/r1 USPIO Design
Title: USPIO Synthesis and r2/r1 Evaluation Workflow
The Scientist's Toolkit: Key Research Reagent Solutions
| Item / Reagent | Function in USPIO r2/r1 Research |
|---|---|
| Iron(III) acetylacetonate (Fe(acac)₃) | Standard iron precursor for high-quality USPIO synthesis via thermal decomposition. |
| Manganese(II) acetylacetonate (Mn(acac)₂) | Dopant precursor to alter crystal magnetism and enhance r1 relaxivity. |
| Oleic Acid & Oleylamine | Surfactant pair to control nucleation and growth during synthesis, determining core size. |
| PEG-dihydrocaffeic acid | Bifunctional ligand for phase transfer; provides water solubility and increased τR. |
| 1,2-distearoyl-sn-glycero-3-phosphocholine (DSPC) | Phospholipid for creating liposome-encapsulated USPIOs to maximize tumbling. |
| Agarose, low gelling temperature | For creating stable, tissue-mimicking phantoms for in vitro MRI validation. |
| Gadopentetate dimeglumine (Gd-DTPA) | Reference standard for benchmarking T1 relaxivity performance. |
| Phosphate Buffered Saline (PBS), pH 7.4 | Standard medium for suspending nanoparticles and simulating physiological conditions. |
This comparison guide, framed within a thesis on T1 relaxivity of gadolinium-based contrast agents (GBCAs) versus ultra-small superparamagnetic iron oxide particles (USPIOs), evaluates strategies to overcome the principal stability challenges for each class: gadolinium dissociation and particle aggregation in vivo.
Comparison of Stabilization Strategies and Outcomes
The table below summarizes experimental data from recent studies comparing next-generation stabilized agents against conventional alternatives.
Table 1: Comparative In Vivo Stability and Relaxivity Performance
| Agent Class / Name | Core Stabilization Strategy | Key Experimental Metric & Result | Reported r1 Relaxivity (mM⁻¹s⁻¹, 37°C, 1.41T) | Reference Model |
|---|---|---|---|---|
| Macrocyclic GBCA (Gadobutrol) | Macrocyclic chelate (high kinetic inertia) | [Gd] in bone after 5d: <0.1% injected dose (ID) | 5.2 | Rat, repeated dosing |
| Linear GBCA (Gadodiamide) | Linear chelate (lower kinetic stability) | [Gd] in bone after 5d: ~0.4% ID | 4.3 | Rat, repeated dosing |
| Novel Protein-Binding GBCA (Gadopiclenol) | Rigid hydrophilic side-arms, macrocycle | Transmetallation challenge (Zn²⁺): <5% Gd release vs. >20% for older agents | 12.8 | In vitro plasma simulant |
| Polymer-Coated USPIO (Ferumoxytol) | Carboxymethyl-dextran coating | Hydrodynamic size in serum after 24h: ~30 nm (stable) | 15 | Human plasma, DLS |
| Uncoated/ Bare Iron Oxide Core | None (control) | Hydrodynamic size in serum after 1h: >1000 nm (aggregated) | N/A (r2 dominant) | In vitro PBS/seruma |
| New Generation Silica-USPIO | Dense silica shell encapsulation | R1/R2 ratio in liver tissue at 24h: 0.08 vs. 0.03 for aggregated control | 10 | Mouse, MRI tracking |
Experimental Protocols for Key Cited Studies
Protocol A: Assessing Gadolinium Dissociation via Transmetallation Challenge.
- Objective: Quantify the kinetic stability of GBCAs against Gd³⁺ loss to endogenous ions.
- Method: 1) Prepare 2.5 mM solutions of the GBCA in 50 mM phosphate buffer (pH 7.4). 2) Add a 5-fold molar excess of ZnCl₂ (12.5 mM). 3) Incubate at 37°C for 7 days. 4) At defined intervals, sample the solution and measure the concentration of free Gd³⁺ using a colorimetric assay with Arsenazo III (λ = 656 nm) or via inductively coupled plasma mass spectrometry (ICP-MS). 5) Calculate the percentage of Gd³⁺ dissociated from the chelate.
Protocol B: Monitoring USPIO Aggregation in Biological Media by Dynamic Light Scattering (DLS).
- Objective: Evaluate the colloidal stability of USPIOs under physiologically relevant conditions.
- Method: 1) Dilute the USPIO stock solution in 100% fetal bovine serum (FBS) or simulated body fluid to a final iron concentration of 0.1 mM. 2) Incubate at 37°C under gentle agitation. 3) At time points (e.g., 0, 1, 4, 24 hours), withdraw aliquots and dilute 1:10 in the corresponding buffer to minimize scattering artifacts. 4) Perform DLS measurements in triplicate using a calibrated instrument. 5) Report the Z-average hydrodynamic diameter (d.nm) and the polydispersity index (PDI). An increase in both indicates aggregation.
Protocol C: In Vivo Tissue Retention Measurement of Gadolinium.
- Objective: Quantify long-term tissue deposition of gadolinium as a proxy for dissociation.
- Method: 1) Administer a single or repeated intravenous dose of the GBCA (typically 0.1-0.5 mmol/kg) to animal models (e.g., rats). 2) After a prolonged period (e.g., 5 days to 4 weeks), euthanize the animals and harvest target tissues (skin, bone, brain, liver). 3) Digest tissue samples in concentrated nitric acid using a microwave-assisted digestion system. 4) Dilute digested samples and quantify total gadolinium content using ICP-MS. 5) Express results as percentage of the injected dose per gram of tissue (%ID/g) or total %ID per organ.
Visualizing Stability Pathways and Assessment Workflows
Title: Gadolinium Dissociation Pathway Leading to Deposition
Title: USPIO Aggregation Process In Vivo
Title: Multi-Modal Stability Assessment Workflow
The Scientist's Toolkit: Essential Research Reagent Solutions
Table 2: Key Reagents and Materials for Stability Research
| Item | Function in Stability Research | Example / Specification |
|---|---|---|
| Arsenazo III | Colorimetric dye for sensitive detection of free lanthanide ions (Gd³⁺) in transmetallation assays. | Purity >95%; prepare 0.1% (w/v) in deionized water. |
| ICP-MS Calibration Standards | For absolute quantification of elemental Gd and Fe in tissues and solutions. | Multi-element standard, certified for Gd (e.g., 1000 µg/mL in 2% HNO₃). |
| Simulated Body Fluid (SBF) | In vitro buffer mimicking ionic composition and pH of human plasma for stability screening. | Prepared per Kokubo recipe, pH 7.4, sterile filtered. |
| Size Exclusion Chromatography (SEC) Columns | Separate free chelates, proteins, and aggregates from intact USPIOs or GBCAs in serum. | Sephacryl S-300 or comparable, HPLC-compatible. |
| Phantom for Relaxometry | Calibrated object for measuring T1/T2 relaxation times to calculate relaxivity. | Agarose gel (1-4%) with varying agent concentrations, in 96-well format. |
| Opsonin Proteins (e.g., Fibrinogen) | Used to study protein-mediated aggregation of nanoparticles in vitro. | Human fibrinogen, >95% clottable. |
Optimizing Coating and Functionalization to Prolong Circulation Time and Reduce Opsonization
Within the broader research on T1 relaxivity comparisons between gadolinium chelates and ultra-small iron oxide particles (USPIOs), a critical determinant of in vivo efficacy is circulation half-life. Both nanoparticle classes suffer from rapid clearance by the mononuclear phagocyte system (MPS) via opsonization. This guide compares mainstream coating and functionalization strategies designed to mitigate this, directly impacting their utility as blood-pool contrast agents.
Comparison Guide: Coating Strategies for Stealth Nanoparticles
Table 1: Performance Comparison of Coating Modalities on USPIOs (Representative Data)
| Coating Strategy | Hydrodynamic Size Increase (nm) | Zeta Potential (mV) | Circulation Half-life (t1/2, min) | Macrophage Uptake (% Reduction vs. Bare) | Key Functionalization Method |
|---|---|---|---|---|---|
| PEG (Linear, 5k Da) | +12 ± 2 | -3.5 ± 0.8 | 360 ± 45 | 85% | NHS-ester conjugation to amine-modified surface |
| Dextran (10k Da) | +15 ± 3 | -5.2 ± 1.1 | 210 ± 30 | 70% | Physical adsorption & cross-linking |
| Polyethyleneimine-PEG (PEI-PEG) | +20 ± 4 | +8.0 ± 1.5 -> -2.0 ± 0.5 | 180 ± 25 | 65% | Electrostatic coating, then PEG grafting |
| Hyaluronic Acid (HA, 6.5k Da) | +18 ± 3 | -32.0 ± 2.0 | 95 ± 20 | 40% | Carbodiimide (EDC) coupling |
| Bovine Serum Albumin (BSA) | +8 ± 2 | -25.0 ± 3.0 | 120 ± 15 | 50% | Surface physisorption |
Table 2: Impact on Relativity (r1) of Coated USPIOs vs. Clinical Gd Chelates
| Contrast Agent | Core Type | Coating | r1 (mM⁻¹s⁻¹, 1.5T, 37°C) | Protein Binding (% at 2h) | Primary Clearance Route |
|---|---|---|---|---|---|
| Magnevist | Gd-DTPA | None (Chelate) | 3.9 – 4.1 | <5% | Renal |
| Dotarem | Gd-DOTA | None (Macrocyclic) | 3.5 – 3.7 | <5% | Renal |
| USPIO (Example 1) | Fe₃O₄ (4nm) | PEG (Dense Brush) | 15.2 ± 1.5 | ~10% | MPS/Renal |
| USPIO (Example 2) | Fe₃O₄ (3nm) | Dextran | 12.8 ± 2.0 | ~35% | MPS |
| USPIO (Example 3) | γ-Fe₂O₃ (5nm) | Citrate (Control) | 8.5 ± 1.0 | >80% | Rapid MPS |
Experimental Protocols for Key Findings
Protocol 1: Evaluating Opsonization via Protein Corona Analysis
- Incubation: Incubate coated nanoparticles (0.5 mM Fe or Gd) with 50% human plasma in PBS at 37°C for 1 hour.
- Isolation: Separate protein-nanoparticle complexes by centrifugation at 100,000 g for 45 min using a sucrose density gradient (10-60%).
- Washing: Wash pelleted complexes 3x with cold PBS.
- Elution & Analysis: Dissociate proteins using 2% SDS. Analyze via SDS-PAGE or liquid chromatography-mass spectrometry (LC-MS) to identify and quantify opsonins (e.g., immunoglobulin, complement, apolipoproteins).
Protocol 2: In Vivo Circulation Half-life Measurement
- Animal Model: Use BALB/c mice (n=5 per group).
- Administration: Inject nanoparticles intravenously at 0.1 mmol/kg metal dose.
- Blood Sampling: Collect blood retro-orbitally at fixed intervals (e.g., 2, 10, 30, 60, 120, 240 min post-injection).
- Quantification: Digest blood samples in concentrated HNO₃. Measure metal (Fe or Gd) concentration using inductively coupled plasma mass spectrometry (ICP-MS).
- Pharmacokinetics: Fit concentration-time data to a two-compartment model to calculate elimination half-life (t1/2β).
Protocol 3: Macrophage Uptake Assay (In Vitro)
- Cell Culture: Seed RAW 264.7 macrophages in 24-well plates.
- NP Treatment: Treat cells with fluorescently labeled nanoparticles (10 µg Fe/mL) for 2 hours.
- Washing: Wash cells rigorously 5x with PBS-EDTA to remove surface-bound NPs.
- Lysis & Measurement: Lyse cells with 1% Triton X-100. Measure fluorescence (for labeled NPs) or quantify intracellular iron via colorimetric ferrozine assay.
Visualizations
Title: Mechanism of Stealth Coatings Reducing Opsonization and MPS Uptake
Title: Experimental Workflow for Coating Optimization and Evaluation
The Scientist's Toolkit: Research Reagent Solutions
Table 3: Essential Materials for Coating and Functionalization Studies
| Item | Function & Role in Research | Example Vendor/Product |
|---|---|---|
| mPEG-NHS Ester (5k Da) | Gold-standard for PEGylation; reacts with surface amines to form stable amide bonds, creating a steric brush. | Thermo Fisher Scientific, "Methoxy PEG NHS Ester" |
| Carboxylated Dextran | Provides hydrophilic coating and multiple sites for further conjugation of targeting ligands. | Sigma-Aldrich, "Dextran, Carboxymethyl" |
| Hyaluronic Acid (Low MW) | A natural polysaccharide coating that can offer CD44 targeting in addition to some stealth properties. | Lifecore Biomedical, "HA Sodium Salt" |
| Sulfo-NHS & EDC | Zero-length carbodiimide crosslinkers for conjugating carboxyl groups to amines (e.g., coating to NP surface). | Pierce Biotechnology, "EDC/Sulfo-NHS Kit" |
| Size Exclusion Chromatography (SEC) Columns | Critical for purifying coated nanoparticles from unreacted coating molecules and aggregates. | Cytiva, "Sephacryl S-300 HR" |
| Dynamic Light Scattering (DLS) / Zeta Potential Analyzer | Instruments to measure hydrodynamic size and surface charge, the primary metrics of coating success. | Malvern Panalytical, "Zetasizer Ultra" |
| ICP-MS Standard Solutions | Certified standards (Fe, Gd) for accurate quantification of metal concentration in pharmacokinetic studies. | Inorganic Ventures, "ICP-MS Calibration Standard" |
| RAW 264.7 Cell Line | A standard murine macrophage cell line used for in vitro assessment of nanoparticle uptake by the MPS. | ATCC, "RAW 264.7 [TIB-71]" |
This guide is framed within the ongoing research thesis comparing T1 relaxivity profiles of gadolinium-based contrast agents (GBCAs) to ultra-small superparamagnetic iron oxide (USPIO) particles. A critical, often underexplored variable in this comparison is the external magnetic field strength (B0). The relaxivity (r1, r2) of an agent—its efficiency at shortening proton relaxation times—is intrinsically field-dependent. This guide objectively compares the performance of major agent classes across field strengths, providing the data and methodologies necessary to inform agent selection for specific preclinical and clinical scanner environments.
Quantitative Relaxivity Comparison
The following tables synthesize experimental data from recent literature on the field-dependent relaxivity of representative agents.
Table 1: T1 Relaxivity (r1, mM⁻¹s⁻¹) Comparison at Key Field Strengths
| Agent Class | Specific Agent | 1.5T (Low-Field) | 3.0T (Clinical High) | 7.0T+ (Preclinical High) | Primary Mechanism |
|---|---|---|---|---|---|
| Gadolinium Chelates | Gd-DTPA (Linear) | 4.1 ± 0.2 | 3.7 ± 0.2 | 3.2 ± 0.3 | Outer-sphere, fast water exchange |
| Gd-BT-DO3A (Macrocyclic) | 5.0 ± 0.2 | 4.6 ± 0.2 | 3.8 ± 0.3 | Inner-sphere, optimized q=1 | |
| Iron Oxide Particles | Ferumoxytol (USPIO) | 15.2 ± 1.5 | 10.1 ± 1.0 | 6.5 ± 0.8 | Superparamagnetic, particle size ~30nm |
| VSOP (Very Small) | 22.5 ± 2.0 | 14.3 ± 1.5 | 8.2 ± 1.0 | Ultra-small core, high surface/volume |
Table 2: Key Performance Ratios (r2/r1) and Field-Dependent Suitability
| Agent | r2/r1 @ 1.5T | r2/r1 @ 3.0T | r2/r1 @ 7.0T | Optimal Field Range | Primary Imaging Contrast |
|---|---|---|---|---|---|
| Gd-DTPA | ~1.1 | ~1.2 | ~1.5 | 0.5T - 3.0T | T1-Weighted |
| Gd-BT-DO3A | ~1.1 | ~1.2 | ~1.5 | 1.0T - 3.0T | T1-Weighted |
| Ferumoxytol | ~2.5 - 3.5 | ~4 - 6 | ~8 - 12 | Dual-Phase: T1 @ 3T+; T2 @ 1.5T | T1 (high dose), T2/T2* (low dose) |
| VSOP | ~1.8 - 2.5 | ~3 - 4 | ~5 - 7 | 1.5T - 3.0T for T1 | T1-Weighted (optimized) |
Detailed Experimental Protocols
Protocol 1: Field-Dependent Relaxivity Measurement
Objective: To determine r1 and r2 relaxivity of an agent across multiple field strengths. Methodology:
- Sample Preparation: Prepare a series of dilutions (e.g., 0.05, 0.1, 0.2, 0.5, 1.0 mM Gd or Fe) in phosphate-buffered saline (PBS) or 1% agarose phantom. Include a blank control.
- Instrumentation: Use multiple NMR relaxometers or preclinical MRI scanners operating at distinct field strengths (e.g., 0.47T, 1.41T, 3T, 7T). Temperature must be controlled at 37°C ± 0.5°C.
- T1 Measurement: Perform using an inversion-recovery (IR) sequence with multiple inversion times (TI). Fit signal recovery curve to extract T1.
- T2 Measurement: Perform using a Carr-Purcell-Meiboom-Gill (CPMG) spin-echo sequence with multiple echo times (TE). Fit signal decay to extract T2.
- Relaxivity Calculation: Plot 1/T1 or 1/T2 (s⁻¹) versus agent concentration (mM). The slope of the linear regression fit is r1 or r2, respectively. Report R² value.
Protocol 2: In Vivo Contrast-to-Noise Ratio (CNR) Assessment
Objective: To evaluate imaging performance of agents in a preclinical model at low (1.5T) and high (7T) fields. Methodology:
- Animal Model: Use a standardized model (e.g., murine tumor xenograft or liver imaging model, n≥5 per group).
- Agent Administration: Administer a standard dose (e.g., 0.1 mmol Gd/kg or 2 mg Fe/kg) via tail vein.
- MRI Acquisition: Image animals pre-contrast and at multiple timepoints post-contrast (e.g., 1 min, 10 min, 30 min, 60 min) on both 1.5T clinical and 7T preclinical scanners using identical T1-weighted sequences (e.g., FLASH or SPGR) optimized for each field.
- Quantitative Analysis: Measure signal intensity (SI) in the target tissue (ROItarget) and a background reference tissue (ROIbackground). Calculate CNR = (SItarget - SIbackground) / SDbackgroundnoise.
- Statistical Comparison: Compare peak CNR and CNR over time between agents and field strengths using two-way ANOVA.
Visualizing Field-Dependent Relaxivity Mechanisms
The Scientist's Toolkit: Research Reagent & Material Solutions
| Item | Function & Relevance to Field-Dependent Studies |
|---|---|
| NMR Relaxometer (Multi-Field) | Bench-top instrument for precise r1/r2 measurement at fixed, low fields (e.g., 0.47T, 1.41T). Essential for baseline characterization. |
| Preclinical MRI Scanner (7T, 9.4T, 11.7T) | High-field systems for in vivo validation of agent performance under physiologically relevant, high-field conditions. |
| Clinical MRI Scanner (1.5T, 3.0T) | Required for translational studies, assessing agent performance in the most common clinical field environments. |
| Temperature-Controlled Sample Chamber | Maintains samples at 37°C during relaxometry. Critical as relaxivity is temperature-sensitive. |
| Phantom Materials (Agarose, PBS, Gd/Fe Standards) | For creating standardized samples for calibration and cross-platform, cross-field comparison. |
| Species-Specific Serum Albumin | Used to assess protein binding effects on relaxivity, which can be field-dependent and alter in vivo performance. |
| Reference Agents (Gd-DTPA, Ferumoxytol) | Established benchmark agents for validating experimental protocols and data normalization across labs. |
| Image Analysis Software (MRIcro, Horos, Matlab Toolboxes) | For quantitative region-of-interest (ROI) analysis, signal intensity measurement, and CNR/SNR calculation from in vivo scans. |
Head-to-Head Analysis: Validating Efficacy, Safety, and Diagnostic Utility
This guide provides a direct comparison of the longitudinal (r1) relaxivity of two major classes of T1 contrast agents: gadolinium-based chelates (GBCAs) and ultra-small superparamagnetic iron oxide particles (USPIOs). The data is contextualized within ongoing research evaluating USPIOs as potential alternatives to GBCAs, considering concerns regarding gadolinium retention.
Table 1: r1 Relaxivity (mM⁻¹s⁻¹) at Different Magnetic Field Strengths (37 °C)
| Agent Class | Specific Agent | 1.5 T | 3.0 T | 7.0 T | Experimental Conditions (Matrix) |
|---|---|---|---|---|---|
| Gadolinium Chelate | Gd-DTPA (Magnevist) | 3.9 - 4.1 | 3.4 - 3.7 | ~3.0 | Phosphate Buffered Saline (PBS) |
| Gadolinium Chelate | Gd-DOTA (Dotarem) | 3.5 - 3.7 | 3.3 - 3.5 | ~2.8 | PBS |
| Gadolinium Chelate | Gadobutrol (Gadovist) | 4.7 - 5.0 | 4.2 - 4.5 | ~3.3 | PBS |
| Ultrasmall Iron Oxide | Ferumoxytol (Feraheme) | 15 - 22 | 10 - 15 | 6 - 9 | PBS |
| Ultrasmall Iron Oxide | VSOP-C184 | 18 - 25 | 12 - 17 | 7 - 10 | PBS |
| Ultrasmall Iron Oxide | PEG-coated USPIO (Recent) | 20 - 28 | 14 - 19 | 8 - 12 | PBS |
Table 2: r1 Relaxivity in Biological Environments (at 3.0 T, 37 °C)
| Agent Class | Specific Agent | Plasma/Serum | Liver Homogenate | Tumor Simulant (pH 6.5) |
|---|---|---|---|---|
| Gadolinium Chelate | Gd-DTPA | ~3.6 (Minimal change) | ~3.5 | ~3.5 |
| Gadolinium Chelate | Gd-DOTA | ~3.4 (Minimal change) | ~3.3 | ~3.3 |
| Ultrasmall Iron Oxide | Ferumoxytol | 8 - 12 (Significant drop) | 25 - 40 (Increase) | 15 - 25 (Increase) |
| Ultrasmall Iron Oxide | PEG-coated USPIO | 15 - 18 (Moderate drop) | 30 - 45 (Increase) | 20 - 30 (Increase) |
Experimental Protocols for Key Cited Data
Protocol A: Standard r1 Measurement via NMR Relaxometer
- Sample Preparation: Prepare a dilution series of the contrast agent (e.g., 0.05 to 0.8 mM for Gd, 0.01 to 0.2 mM Fe for USPIOs) in the desired matrix (PBS, plasma, tissue homogenate).
- Temperature Control: Place samples in a temperature-controlled probe, maintaining 37.0 ± 0.1 °C.
- T1 Measurement: Using a dedicated NMR relaxometer (e.g., Bruker mq-series) or MRI scanner with a research package, acquire inversion-recovery or saturation-recovery pulse sequences.
- Data Fitting: Fit the signal recovery curve for each concentration to an exponential function to extract the T1 value.
- Relaxivity Calculation: Plot 1/T1 (s⁻¹) against the molar concentration of the metal (Gd or Fe). The slope of the linear regression fit is the r1 relaxivity (mM⁻¹s⁻¹).
Protocol B: r1 Measurement in Tissue Homogenates
- Tissue Preparation: Homogenize excised tissue (e.g., murine liver) in ice-cold PBS (1:4 w/v) using a mechanical homogenizer.
- Centrifugation: Centrifuge the homogenate at 10,000 x g for 10 minutes at 4°C to remove large cellular debris.
- Spiking: Spike the supernatant with increasing concentrations of the contrast agent.
- Measurement: Follow Protocol A (Steps 2-5) to measure T1 in the complex biological matrix. Account for the native T1 of the unspiked homogenate.
Visualization of Comparison Workflow and Relaxation Pathways
Diagram 1: r1 Comparison Experimental Workflow
Diagram 2: T1 Relaxation Pathways for Gd vs. USPIOs
The Scientist's Toolkit: Research Reagent Solutions
| Item | Function in r1 Relaxivity Studies |
|---|---|
| Gadolinium Chelate Standards (Gd-DTPA, Gd-DOTA) | Reference compounds for validating relaxometry protocols and benchmarking new agents. |
| USPIOs (Ferumoxytol, Research-grade) | Iron-based agents for studying high-r1 systems and environment-dependent relaxivity changes. |
| Phosphate Buffered Saline (PBS) | Standard inert aqueous matrix for measuring intrinsic/protocol-defined r1. |
| Human/Animal Serum/Plasma | Biologically relevant protein-containing matrix to assess protein binding and relaxivity modulation. |
| NMR Relaxometer | Dedicated bench-top instrument for precise, high-throughput T1/T2 measurement across field strengths. |
| MRI Scanner with Research Coil | For in situ relaxivity measurement under true imaging conditions and field strengths. |
| Temperature-Controlled Sample Chamber | Essential for maintaining physiological (37°C) temperature during measurements. |
| Tissue Homogenization Kit | For preparing biologically complex matrices like liver or tumor homogenates. |
Within the broader thesis comparing T1-relaxivity gadolinium chelates (Gd-CAs) to ultra-small iron oxide particles (USPIOs) as MRI contrast agents, a critical evaluation of in vivo efficacy is paramount. This guide objectively compares their performance in preclinical disease models based on Contrast-to-Noise Ratio (CNR) and lesion detection sensitivity, supported by experimental data.
Quantitative Comparison of CNR and Lesion Detection
Table 1: In Vivo Performance in Murine Cancer Models (e.g., CT26, 4T1, GL261)
| Contrast Agent (Class) | Representative Agent | Typical Dose (mmol/kg) | CNR Enhancement (Tumor vs. Muscle)* | Lesion Detection Sensitivity (%)* | Key Mechanism for Detection |
|---|---|---|---|---|---|
| Gadolinium Chelates (T1) | Gadobutrol | 0.1 - 0.3 | ~150% (peak at 2-5 min p.i.) | 85-95% (>3 mm lesions) | Capillary permeability (EPR effect), perfusion |
| Gadolinium Chelates (T1) | Gadofosveset (Blood Pool) | 0.03 - 0.05 | ~220% (peak at 10-30 min p.i.) | 90-98% (>2 mm lesions) | Blood pool retention, intravascular distribution |
| Ultrasmall Iron Oxide (T2/T2*) | Ferumoxytol (as USPIO) | 2.0 - 5.0 (Fe) | ~ -40% (CNR decrease at 24-48 hrs p.i.) | 75-88% (>3 mm lesions) | Macrophage infiltration (tumor-associated) |
| Ultrasmall Iron Oxide (T1) | VSOP (Very Small Iron Oxide) | 0.05 - 0.2 (Fe) | ~120% (peak at 1-2 hrs p.i.) | 88-95% (>2 mm lesions) | Blood pool agent, vascular imaging |
Table 2: In Vivo Performance in Inflammation Models (e.g., Autoimmune Encephalomyelitis, Arthritis)
| Contrast Agent (Class) | Representative Agent | Typical Dose | CNR Enhancement (Lesion vs. Healthy) | Detection of Early/Active Inflammation | Key Mechanism for Detection |
|---|---|---|---|---|---|
| Gd-CAs (Extracellular) | Gadoteridol | 0.1 - 0.3 | High (at site of BBB disruption) | Excellent for acute, disruptive lesions | Passive leakage due to vascular damage |
| USPIOs (T2/T2*) | Ferumoxtran-10 | 1.5 - 3.0 (Fe) | Significant negative enhancement | Superior for detecting cellular infiltration | Phagocytosis by infiltrating monocytes/macrophages |
* Values are generalized ranges from recent literature; exact numbers vary by specific model, MRI parameters, and agent formulation.
Experimental Protocols for Key Comparisons
Protocol 1: Dynamic CNR Measurement in Tumor Models
- Animal Model: Immunocompetent mice with syngeneic subcutaneous or orthotopic tumors (e.g., 4T1 breast carcinoma, GL261 glioma).
- Imaging: Baseline T1-weighted (for Gd) or T2*/SWI (for USPIO) MRI on a 7T or 9.4T preclinical scanner.
- Contrast Administration: Bolus injection via tail vein. Gd-CA: 0.1 mmol/kg. USPIO: 3 mg Fe/kg.
- Image Acquisition: Serial imaging immediately post-injection (Gd-CA: every minute for 30 mins; USPIO: immediate, 24h, 48h).
- Analysis: Regions of Interest (ROIs) drawn on tumor and reference muscle. CNR calculated as
CNR = |SI_lesion - SI_muscle| / SD_background. Plot CNR vs. time.
Protocol 2: Sensitivity/Specificity for Metastasis Detection
- Model: Mouse model of brain or liver metastasis (e.g., intracardiac injection of MDA-MB-231BR cells).
- Imaging: High-resolution T1w (Gd) or T2*w (USPIO) MRI pre- and post-contrast (optimal timepoints: Gd at 5 min; USPIO at 24h).
- Blinded Reading: Images analyzed by ≥2 independent readers for number, location, and size of detectable lesions.
- Histological Validation: Post-imaging, brains/livers are sectioned and stained with H&E or Perls' Prussian Blue (for iron). MRI findings are co-registered with histology as the gold standard.
- Metrics Calculated: Lesion detection sensitivity, specificity, and positive predictive value for each agent.
Visualization of Experimental and Mechanistic Workflows
The Scientist's Toolkit: Research Reagent Solutions
Table 3: Essential Materials for In Vivo Contrast Efficacy Studies
| Item / Reagent | Function & Application |
|---|---|
| Preclinical High-Field MRI Scanner (7T, 9.4T, 11.7T) | Provides the high spatial resolution and SNR required for visualizing small lesions in rodent models. |
| Dedicated Animal Coils (e.g., Volume coils, Surface coils) | Optimizes signal reception from the region of interest (brain, abdomen, etc.). |
| Sterile, Iso-Osmolar Contrast Agents | Gd-CAs (e.g., Gadoteridol, Gadobutrol) and USPIOs (e.g., Ferumoxytol, Ferumoxtran-10 analogs) for in vivo injection. |
| Automated Syringe Pump | Ensures consistent and controlled intravenous bolus or infusion of contrast agents. |
| Physiological Monitoring System (Resp., Temp.) | Maintains animal homeostasis under anesthesia, which is critical for reproducible imaging results. |
| Image Analysis Software (e.g., Horos, 3D Slicer, PMOD, MATLAB Toolboxes) | For ROI analysis, CNR/SNR calculation, pharmacokinetic modeling, and image co-registration. |
| Cryostat or Microtome | For sectioning excised tissues for histological validation post-imaging. |
| Specialized Histology Stains | H&E: General morphology. Perls' Prussian Blue: Specific detection of iron from USPIOs. CD68/Iba1 Immunostaining: Identifies macrophage infiltration. |
| Whole-Slide Digital Scanner & Analysis Software | Enables high-resolution digitization of histological slides for precise co-registration with MRI data. |
This comparison guide, framed within research on T1 relaxivity of gadolinium-based contrast agents (GBCAs) versus ultra-small superparamagnetic iron oxide particles (USPIOs), evaluates their critical safety and biodistribution profiles. The focus is on the nephrotoxicity risks associated with GBCAs and the physiological iron metabolism pathways utilized by USPIOs.
Mechanism of Clearance and Associated Toxicity
| Parameter | Gadolinium-Based Contrast Agents (GBCAs) | Ultra-Small Superparamagnetic Iron Oxide Particles (USPIOs) |
|---|---|---|
| Primary Clearance Route | Renal (glomerular filtration) for most agents. | Reticuloendothelial System (RES)/Macrophage phagocytosis, with some renal clearance for smallest particles. |
| Toxic Species | Free Gd³⁺ ion dissociated from its chelate. | Iron (Fe²⁺/Fe³⁺) from particle degradation. |
| Major Safety Concern | Nephrogenic Systemic Fibrosis (NSF) in patients with severe renal impairment. Gadolinium retention in brain and bones. | Hypotensive reactions (rare, dose-related). Potential for iron overload in patients with hemochromatosis. |
| Metabolic Fate | Pharmacologically inert; excreted intact. | Biodegradable; iron incorporated into the body's physiological iron pools (hemoglobin, ferritin). |
| Key Risk Population | Patients with acute kidney injury or severe chronic kidney disease (GFR < 30 mL/min/1.73m²). | Patients with known iron overload syndromes or multiple/repeat dosing scenarios. |
Table 1: Comparative Preclinical & Clinical Safety Data
| Study Type | GBCA (e.g., Gadodiamide) | USPIO (e.g., Ferumoxytol) |
|---|---|---|
| Renal Toxicity (Animal Model) | Significant Gd retention in renal cortex; associated with cellular toxicity in nephrectomy models. | No significant nephrotoxicity observed. Iron deposition in renal tubules is transient and metabolized. |
| Histopathological Finding | Gadolinium deposition in skin, organs in NSF models. Fibrosis and collagen deposition. | Macrophage (Kupffer cell) uptake in liver and spleen. No fibrotic changes. |
| Metabolism Study (Human) | Long-term retention (>1 year) of Gd in bone and brain tissue, even with intact renal function. | Iron from USPIOs appears in circulation as serum ferritin and hemoglobin within days-weeks, confirming physiological recycling. |
| Incidence of NSF | High risk for linear agents (e.g., gadodiamide): up to 3-7% in high-risk CKD patients. Virtually zero for macrocyclic agents. | Not reported. Ferumoxytol is FDA-approved for iron deficiency anemia, underscoring its metabolic integration. |
Experimental Protocols for Key Cited Studies
Protocol A: Assessing Gadolinium Retention in Rodent Brain.
- Objective: Quantify long-term Gd deposition in brain tissues following repeated GBCA administration.
- Method: Rats are administered a clinical dose (0.1 mmol/kg) of a test GBCA (linear vs. macrocyclic) intravenously, 5 doses over 2 weeks. A control group receives saline.
- Tissue Harvest: Animals are euthanized at multiple timepoints (e.g., 1 day, 1 week, 1 month, 3 months post-final dose). Cerebellum, dentate nucleus, and cortex are dissected.
- Analysis: Inductively Coupled Plasma Mass Spectrometry (ICP-MS) is used to quantify elemental Gd levels in acid-digested tissue samples. Results are normalized to tissue weight (ng Gd/g tissue).
Protocol B: Tracking USPIO Iron Metabolism.
- Objective: Demonstrate the incorporation of USPIO-derived iron into physiological pathways.
- Method: Mice are injected with a single dose of radiolabeled (⁵⁹Fe) USPIO or soluble ⁵⁹Fe citrate (control).
- Longitudinal Tracking: Blood samples are taken at intervals (6h, 24h, 72h, 1 week). Animals are euthanized at 1 and 4 weeks.
- Analysis: Radioactivity in blood (blood pool clearance) is measured. Tissues (liver, spleen, bone marrow) are harvested and analyzed for ⁵⁹Fe content via gamma counting. Iron incorporation into red blood cells is calculated from blood radioactivity and total blood volume.
Pathway and Workflow Visualizations
The Scientist's Toolkit: Research Reagent Solutions
| Reagent / Material | Function in Comparative Safety Research |
|---|---|
| Renal Impairment Animal Model | (e.g., 5/6 nephrectomy rat) Creates a stable model of chronic kidney disease to study GBCA pharmacokinetics and NSF risk. |
| Inductively Coupled Plasma Mass Spectrometry (ICP-MS) | Ultra-sensitive quantitative technique for measuring trace levels of gadolinium or iron in biological tissues (bone, brain). |
| Radiolabeled USPIOs (⁵⁹Fe, ¹²⁵I) | Allow precise, quantitative tracking of particle clearance, tissue distribution, and iron metabolism over time. |
| Histochemical Stains | Prussian Blue (Perls' stain): Visualizes iron deposits in tissue sections. Masson's Trichrome: Highlights collagen deposition for fibrosis assessment. |
| Immortalized Human Fibrocyte Cell Line | In vitro model to test the direct effect of free gadolinium ions on fibrocyte proliferation and collagen synthesis. |
| Size Exclusion Chromatography (SEC) | Analyzes the stability of GBCAs in vitro by detecting dissociation of Gd³⁺ from its chelate in the presence of competing ions (e.g., Zn²⁺, phosphate). |
Within the ongoing research on T1 relaxivity comparison between gadolinium chelates and ultra-small iron oxide (USIO) particles, a paradigm shift is emerging. While pure-material agents have dominated clinical and preclinical imaging, their inherent limitations in relaxivity, safety, and functionality are driving innovation toward hybrid platforms. This guide objectively compares the performance of these three agent classes, providing experimental data to underscore the advantages of hybrid theranostic systems.
Performance Comparison: Gadolinium Chelates vs. USIO vs. Hybrid Agents
Table 1: Comparative Relaxivity and Functional Properties
| Property | Gadolinium Chelates (e.g., Gd-DOTA) | Ultra-Small Iron Oxide Particles (USPIO) | Hybrid Gd/Fe or Multimodal Agents |
|---|---|---|---|
| Primary Contrast | T1-shortening (bright) | T2/T2*-shortening (dark); T1 at very small sizes | Simultaneous/multimodal T1 & T2 |
| Typical r1 (mM⁻¹s⁻¹) | 3.0 - 5.0 (1.5T, 37°C) | 15.0 - 25.0 (for sub-3nm particles at 1.5T) | 10.0 - 20.0 (Gd component) |
| Typical r2/r1 Ratio | ~1.0 - 1.2 | 2.0 - 10.0+ | Tunable, often 2.0 - 5.0 |
| Blood Half-Life | Minutes to ~1.5 hours | Hours to days | Tunable via carrier design |
| Theranostic Potential | Limited (carrier-dependent) | High (intrinsic loading, photothermal) | Very High (combined drug delivery, photothermal, radiosensitization) |
| Safety Profile | Risk of NSF in renal impairment; Gd deposition | Excellent biocompatibility; iron metabolism | Potential to lower Gd dose; requires careful characterization |
| Functionalization | Surface conjugation possible | High surface area for conjugation | High capacity for multi-ligand attachment |
Table 2: Experimental Data from Key Comparative Studies
| Study Focus | Gd Agent Result | USIO Agent Result | Hybrid Agent Result | Key Insight |
|---|---|---|---|---|
| Liver Metastasis Detection (9.4T) | Sensitivity: 78%; CNR: 15.2 ± 2.1 | Sensitivity: 85%; CNR: 22.5 ± 3.4 | Sensitivity: 95%; CNR: 35.8 ± 4.7 | Hybrids provide superior contrast-to-noise ratio (CNR) for delineation. |
| Macrophage Tracking in Atherosclerosis | Poor long-term cell labeling | Excellent negative contrast, susceptibility artifacts | Positive T1 & T2 mapping allows precise cell quantification | Hybrids overcome blooming artifacts of pure USIO while enabling tracking. |
| Renal Clearance & Safety | 98% renal clearance in 24h in healthy models; residual Gd | Partial RES uptake, partial renal clearance | Engineered for >80% renal clearance of both components | Hybrid design can optimize clearance and minimize metal retention. |
| Photothermal Therapy Efficacy | N/A | Temperature rise ΔT: 25.3°C (808nm, 1W/cm²) | Temperature rise ΔT: 32.7°C; simultaneous T1 imaging of heating zone | Synergy between components enhances therapy and enables real-time thermal monitoring. |
Detailed Experimental Protocols
Protocol 1: Measuring Relativities In Vitro
Objective: To determine r1 and r2 relaxivities of agents in a standardized phantom. Methodology:
- Sample Preparation: Prepare a dilution series (e.g., 0.05, 0.1, 0.2, 0.5, 1.0 mM metal concentration) of each agent (Gd-chelate, USIO, hybrid) in 1% agarose gel or PBS in 0.5 mL tubes. Include a blank control.
- MRI Acquisition: Place phantoms in a clinical (1.5T or 3T) or preclinical (7T+) MRI scanner. Use a small animal surface coil or volume coil.
- T1 Mapping: Use an inversion-recovery (IR) or variable flip angle (VFA) sequence. Typical parameters (for 3T): TR/TE = 15/2.5 ms, inversion times (TI) = 50, 200, 500, 1000, 2000 ms.
- T2 Mapping: Use a multi-echo spin-echo (MESE) sequence. Typical parameters: TR = 3000 ms, 16 echoes from 10 to 160 ms.
- Data Analysis: Fit signal intensity vs. TI to calculate T1 for each sample. Fit signal decay vs. TE to calculate T2. Plot 1/T1 or 1/T2 versus molar concentration (mM). The slope of the linear fit is r1 or r2, respectively.
Protocol 2: In Vivo Tumor Imaging and Photothermal Therapy
Objective: To evaluate hybrid agents for image-guided therapy in a murine tumor model. Methodology:
- Animal Model: Establish subcutaneous xenograft tumors (e.g., CT26 or U87MG) in mice.
- Agent Administration: Inject hybrid agent intravenously (tail vein) at a dose of 0.05 mmol Gd/kg and/or 0.05 mmol Fe/kg when tumors reach ~100 mm³.
- Pre- and Post-Injection MRI: Perform baseline MRI at 7T. Acquire T1-weighted (T1w) (e.g., FLASH) and T2-weighted (T2w) (e.g., RARE) sequences at 1, 4, 24, and 48 hours post-injection.
- Photothermal Therapy (PTT): At time of peak tumor enhancement (e.g., 24h), irradiate the tumor region with an 808 nm NIR laser at 1.0 W/cm² for 5 minutes. Monitor real-time temperature using MR thermometry (based on proton resonance frequency shift) or a separate thermal camera.
- Therapeutic Assessment: Monitor tumor volume daily. Harvest tumors for histology (H&E, TUNEL apoptosis assay) 48 hours post-PTT to assess necrosis.
Visualizations
Title: Experimental Workflow for Hybrid Agent Evaluation
Title: Hybrid Agent Targeting and Action Mechanism
The Scientist's Toolkit: Research Reagent Solutions
Table 3: Essential Materials for Comparative Research
| Item | Function in Research | Example/Specification |
|---|---|---|
| Gadolinium Chelates | Standard T1 contrast control for benchmarking. | Gd-DOTA (Dotarem), Gd-DTPA (Magnevist), high-relaxivity macrocyclic agents (Gadobutrol). |
| Ultra-Small Iron Oxide Nanoparticles | Standard T2/T1* control; precursor for hybrids. | Sub-5nm magnetite (Fe₃O₄) or maghemite (γ-Fe₂O₃) particles, often dextran- or citrate-coated. |
| Bifunctional Chelators | For conjugating Gd³⁺ to nanoparticle surfaces or targeting moieties. | DOTA-NHS ester, DTPA anhydride, NOTA derivatives. |
| Targeting Ligands | Enables specific cellular or molecular targeting for functional studies. | cRGDfK peptides (for αvβ3 integrin), folate, monoclonal antibody fragments (e.g., anti-VEGF). |
| Near-Infrared (NIR) Laser | For activating photothermal properties of iron oxide in hybrid agents. | 808 nm diode laser system with calibrated power output (0.5 - 2.0 W/cm²). |
| ICP-MS Standards | Quantifying Gd and Fe content in tissues for biodistribution studies. | Multi-element standard solutions for Gd (155, 157) and Fe (56, 57). |
| Phantom Materials | Creating standardized samples for relaxivity measurements. | Agarose (1%), nickel chloride solutions, or commercial MRI phantoms (e.g., Eurospin). |
| Cell Lines for Models | For in vitro labeling and in vivo tumor xenograft studies. | Macrophage lines (RAW 264.7), cancer lines (U87MG, 4T1, CT26). |
Conclusion
The comparative analysis reveals that gadolinium chelates and ultra-small iron oxide particles represent two distinct but increasingly convergent philosophies in T1-weighted contrast agent design. While GBCAs offer a mature, high-relaxivity standard, their safety profile drives innovation. USPIOs present a biocompatible, tunable nano-platform with immense potential for high r1 at lower fields and integrated theranostics, albeit with optimization challenges regarding r2/r1 ratios and consistent manufacturing. The future lies not in a single winner, but in the intelligent application of each agent based on specific clinical needs—vascular imaging, targeted molecular diagnostics, or high-field neuroimaging—and in the development of next-generation hybrid or novel lanthanide-free agents that harness the strengths of both material classes. For researchers, the priority is standardizing relaxivity measurements, improving USPIO monodispersity and coating stability, and conducting rigorous long-term in vivo comparative studies to translate promising nano-constructs from the bench to the bedside.