Stealth Nanomedicine: Advanced PEGylation Strategies to Overcome Opsonization and Prolong Systemic Circulation
This article provides a comprehensive analysis of PEGylation as a cornerstone strategy for enhancing the pharmacokinetics and biodistribution of therapeutic nanoparticles.
Stealth Nanomedicine: Advanced PEGylation Strategies to Overcome Opsonization and Prolong Systemic Circulation
Abstract
This article provides a comprehensive analysis of PEGylation as a cornerstone strategy for enhancing the pharmacokinetics and biodistribution of therapeutic nanoparticles. Aimed at researchers and drug development professionals, it explores the fundamental mechanisms by which PEG coatings confer 'stealth' properties by reducing opsonization and recognition by the mononuclear phagocyte system (MPS). The scope encompasses foundational principles, practical methodologies for surface conjugation and architecture, common challenges with optimization techniques, and comparative validation of next-generation PEG alternatives. The synthesis offers a roadmap for designing nanoparticles with optimized circulation half-life and targeted delivery efficacy.
The Stealth Imperative: Understanding Opsonization and the Biological Rationale for PEGylation
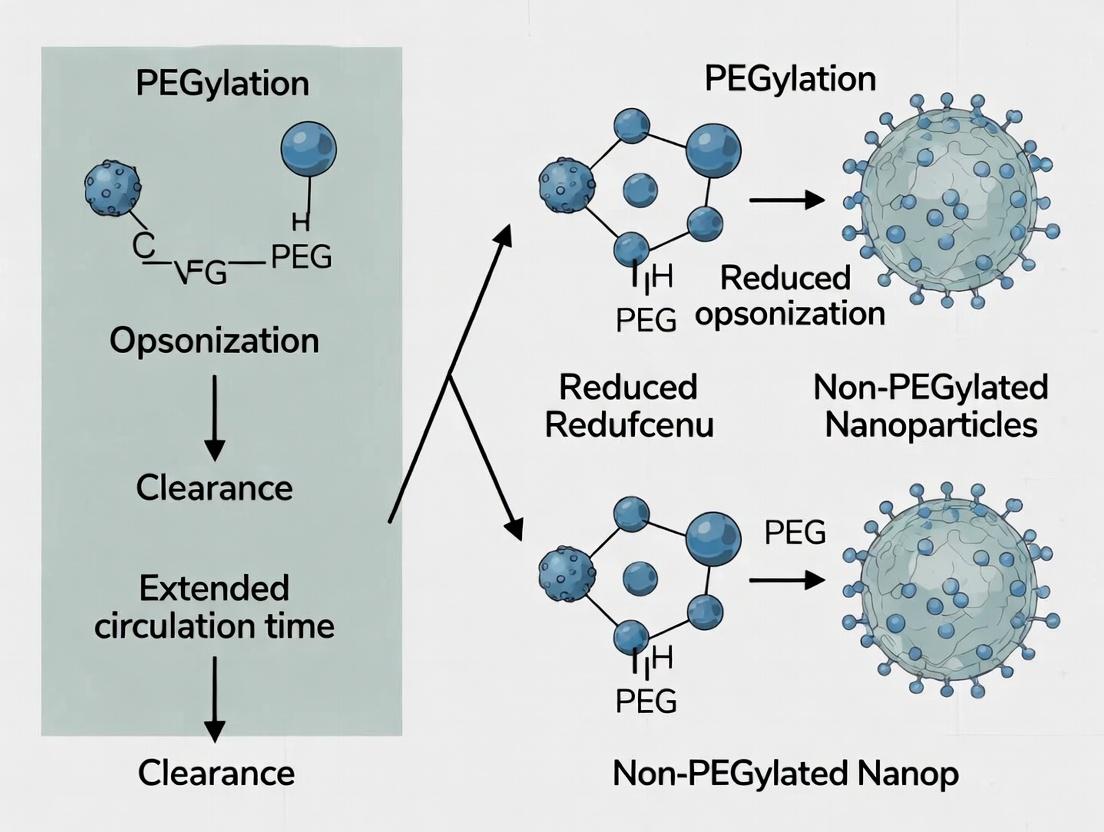
Within the context of advancing PEGylation strategies to mitigate nanoparticle clearance, understanding the biological processes of opsonization and Mononuclear Phagocyte System (MPS) sequestration is paramount. Upon intravenous administration, nanoparticles are immediately exposed to a complex biological milieu, where serum proteins adsorb to their surface in a process termed opsonization. This "protein corona" marks the particles for rapid recognition and uptake by phagocytic cells of the MPS, primarily macrophages in the liver (Kupffer cells) and spleen. This innate immune clearance mechanism severely limits the circulation half-life and target tissue accumulation of therapeutic nanoparticles, undermining their efficacy. Current research quantitatively investigates these processes to design effective stealth coatings, with PEGylation remaining the benchmark strategy.
Quantitative Data: Opsonization & Clearance Kinetics
Table 1: Key Opsonins and Their Affinities for Common Nanoparticle Surfaces
| Opsonin Protein | Molecular Weight (kDa) | Primary Source | Key Ligand/Receptor on Phagocyte | Approx. Binding Affinity (Kd) for Uncoated PS* | Impact on Clearance |
|---|---|---|---|---|---|
| Immunoglobulin G (IgG) | 150 | Adaptive Immune Response | Fcγ Receptor (FcγR) | 10-100 nM | High - Direct phagocytic signal |
| Complement C3b/iC3b | 185 (C3b) | Innate Immune (Complement) | Complement Receptor 1/3 (CR1/CR3) | 1-10 nM | Very High - Potent opsonin |
| Fibrinogen | 340 | Plasma | Mac-1 Integrin | 100-500 nM | High - Promotes MPS adhesion |
| Apolipoproteins (e.g., ApoE) | 34-44 | Plasma | LDL Receptor on Hepatocytes | Varies widely | Can divert particles to liver parenchyma |
| Albumin | 66.5 | Plasma (Abundant) | Scavenger Receptors | Weak (µM range) | Low - Often considered "dysopsonin" |
*Polystyrene as a model hydrophobic surface. Data compiled from recent surface plasmon resonance and isothermal titration calorimetry studies.
Table 2: Comparative Pharmacokinetic Parameters of Coated vs. Uncoated Nanoparticles (Mouse Model, IV Admin)
| Nanoparticle Formulation (100 nm) | Circulation Half-life (t₁/₂, h) | % Injected Dose in Liver at 1 h | % Injected Dose in Spleen at 1 h | Key Metric: AUC(0-24h) (µg·h/mL) |
|---|---|---|---|---|
| Uncoated Polystyrene | 0.1 - 0.3 | 70-85% | 5-10% | 10 ± 3 |
| PEG-coated (Low Density: 5 PEG/nm²) | 2 - 6 | 45-60% | 3-8% | 85 ± 15 |
| PEG-coated (High Density: 15 PEG/nm²) | 12 - 24 | 20-35% | 2-5% | 350 ± 50 |
| PEG-coated ("Brush" Regime) with Chitosan Core | 8 - 15 | 30-50% | 4-7% | 220 ± 30 |
| Poloxamer 338-Coated | 4 - 10 | 40-55% | 3-6% | 150 ± 25 |
AUC: Area Under the Curve (plasma concentration-time). Data synthesized from recent *in vivo studies.
Experimental Protocols
Protocol 3.1:In VitroOpsonization and Macrophage Uptake Assay
Objective: To quantify the effect of PEGylation density on protein adsorption and subsequent cellular uptake by macrophages.
Materials: See "The Scientist's Toolkit" below. Procedure:
- Nanoparticle Incubation with Serum: Dilute fluorescently labeled nanoparticles (e.g., COOH-modified PS, 100 nm) in 100% fetal bovine serum (FBS) or human plasma to a final concentration of 1 mg/mL. Incubate at 37°C for 60 min with gentle rotation.
- Corona Isolation: Ultracentrifuge the opsonized nanoparticles at 100,000 x g for 45 min at 4°C. Carefully remove the supernatant and resuspend the pellet in cold PBS. Repeat washing step twice.
- Protein Quantification: Determine the amount of protein bound using a micro-BCA assay. Dissociate a separate aliquot of the corona in 2% SDS and analyze via SDS-PAGE.
- Cell Culture & Seeding: Culture RAW 264.7 or primary murine bone-marrow-derived macrophages (BMDMs) in complete DMEM. Seed cells in a 24-well plate at 2.5 x 10^5 cells/well and allow to adhere overnight.
- Uptake Experiment: Replace medium with serum-free medium containing opsonized nanoparticles (equivalent to 50 µg/mL particle mass). Incubate for 2 h at 37°C, 5% CO₂.
- Quantification: Wash cells 3x with cold PBS, lyse with 1% Triton X-100, and measure fluorescence intensity (Ex/Em appropriate to dye) using a plate reader. Normalize fluorescence to total cellular protein content.
Protocol 3.2:Ex VivoHepatic Perfusion for Cellular Distribution Analysis
Objective: To delineate the specific cellular uptake (Kupffer cells vs. hepatocytes) of nanoparticles within the liver. Procedure:
- Animal Dosing & Organ Harvest: Administer a fluorescent or radiolabeled nanoparticle formulation via tail vein injection to a mouse. At a predetermined time (e.g., 30 min post-injection), euthanize the animal and cannulate the portal vein.
- Liver Perfusion & Digestion: Perfuse the liver sequentially with 1) perfusion buffer (heparinized) to remove blood, 2) digestion buffer (Collagenase IV/DNase I in HBSS) for 15-20 min at 37°C.
- Cell Suspension Preparation: Mechanically dissociate the softened liver through a 70 µm cell strainer. Centrifuge the resulting single-cell suspension at 50 x g for 3 min to pellet hepatocytes.
- Non-Parenchymal Cell (NPC) Isolation: Collect the supernatant and centrifuge at 600 x g for 10 min to pellet NPCs.
- Kupffer Cell Enrichment: Resuspend the NPC pellet and perform density gradient centrifugation (e.g., Percoll, 25%/50%). Kupffer cells are enriched at the interface.
- Flow Cytometry Analysis: Stain cells with fluorescent antibodies (e.g., anti-F4/80-APC for Kupffer cells). Analyze nanoparticle fluorescence within specific gated cell populations using flow cytometry to determine the percentage of dose per cell type.
Visualization: Pathways and Workflows
Opsonization and MPS Clearance Pathway
In Vivo PK and Biodistribution Workflow
The Scientist's Toolkit: Research Reagent Solutions
| Item | Function & Relevance |
|---|---|
| Fluorescently Labeled Nanoparticles (e.g., COOH-PS, 100nm) | Model particles for tracking cellular uptake and biodistribution via fluorescence. Surface charge influences initial protein adsorption. |
| Methoxy-PEG-NHS Ester (5 kDa) | Reactive PEG derivative for covalent "stealth" coating of amine-containing nanoparticles, reducing opsonization. |
| Density Gradient Medium (e.g., Percoll, OptiPrep) | Essential for isolating specific liver cell populations (Kupffer cells, hepatocytes) after in vivo dosing to determine cellular distribution. |
| Collagenase Type IV & DNase I | Enzyme cocktail for gentle dissociation of perfused liver into a viable single-cell suspension for flow cytometry. |
| Anti-F4/80 Antibody (e.g., APC conjugate) | Definitive surface marker for identification and gating of murine Kupffer cells/Macrophages via flow cytometry. |
| Micro BCA Protein Assay Kit | Colorimetric method for quantifying the total protein content of the hard corona isolated from nanoparticles. |
| RAW 264.7 Cell Line | Widely used murine macrophage model for high-throughput, reproducible in vitro phagocytosis and uptake studies. |
| Isothermal Titration Calorimetry (ITC) | Instrumental technique for directly measuring the binding thermodynamics (Kd, ΔH, ΔS) between opsonins and nanoparticle surfaces. |
Application Notes
Within the central thesis that PEGylation is a primary strategy to mitigate nanoparticle opsonization and accelerate systemic circulation half-life, the efficacy of the "PEG shield" is governed by fundamental physicochemical principles. Its function is not passive coating but active repulsion, driven by well-defined molecular mechanisms.
1. Mechanism of Steric Stabilization: PEG chains, when grafted at sufficient density on a nanoparticle surface, adopt a "brush" or "mushroom" conformation. In an aqueous environment, highly flexible PEG chains are heavily hydrated, creating a steric barrier. The primary repulsive force arises from the unfavorable loss of conformational entropy when approaching surfaces compress these chains. A secondary contribution is the osmotic repulsion from the high local concentration of hydrated ethylene oxide units, which excludes other polymers and proteins.
2. Molecular Determinants of Protein Repulsion: The reduction of protein adsorption is a direct consequence of this steric barrier. Key molecular parameters dictate shield performance, as summarized in Table 1.
Table 1: Molecular Determinants of PEG Shield Efficacy
| Parameter | Optimal Range for Anti-Fouling | Molecular Impact |
|---|---|---|
| PEG Grafting Density (chains/nm²) | >0.5 for MW 2-5 kDa | Determines conformation (mushroom < 0.5; brush > 0.5). High density is critical for a continuous barrier. |
| PEG Molecular Weight (Da) | 2,000 - 5,000 | Longer chains increase barrier thickness (L ~ N^0.6) but may reduce grafting density and increase immunogenicity. |
| PEG Chain Conformation | Dense Brush | Maximizes steric repulsion and surface coverage, minimizing interstitial gaps for protein penetration. |
| PEG Linkage Chemistry | Stable (amide, carbamate) | Prevents shield loss in vivo. Unstable esters (e.g., PEG-PLA) are for controlled release, not permanent shielding. |
| Surface Under PEG | Hydrophilic, Neutral | A hydrophobic or charged core can attract proteins if the PEG layer is incomplete or compromised. |
3. Quantitative Data on Protein Adsorption Reduction: Effective PEGylation reduces both the rate and total amount of protein adsorption, directly impacting opsonization. Table 2 summarizes key experimental findings.
Table 2: Quantitative Impact of PEGylation on Protein Adsorption
| Nanoparticle Core | PEGylation Parameters | % Reduction in Fibrinogen Adsorption (vs. Non-PEGylated) | Method | Reference Context |
|---|---|---|---|---|
| Polystyrene | MW: 5,000 Da, Density: 0.6 chains/nm² | ~95% | Quartz Crystal Microbalance (QCM-D) | In vitro model study |
| PLGA | MW: 2,000 Da, Density: 0.3 chains/nm² | ~70% | MicroBCA Assay | Drug delivery nanoparticle |
| Gold Nanoparticle | MW: 2,000 Da, Density: 1.2 chains/nm² | >98% | Surface Plasmon Resonance (SPR) | Fundamental mechanism study |
| Liposome | PEG-2000-DSPE, 5 mol% lipid | ~90% (in serum) | SDS-PAGE & Gel Staining | Pre-clinical formulation |
Protocols
Protocol 1: Quantifying Protein Adsorption via Quartz Crystal Microbalance with Dissipation (QCM-D)
Objective: To measure the kinetics and mass of human serum albumin (HSA) or fibrinogen adsorption onto PEGylated vs. bare nanoparticle surfaces immobilized on a sensor chip.
Research Reagent Solutions & Materials:
| Item | Function |
|---|---|
| QCM-D Sensor Chips (SiO2-coated) | Provides a model, ultra-smooth surface for nanoparticle immobilization and mass-sensitive detection. |
| PEGylated Nanoparticles & Bare Controls | Test and control articles. Must be monodisperse and amenable to surface deposition. |
| Phosphate Buffered Saline (PBS), pH 7.4 | Standard isotonic buffer for protein dilution and system equilibration. |
| Human Serum Albumin (HSA) or Fibrinogen | Model plasma proteins for adsorption studies. |
| 1% (w/v) Sodium Dodecyl Sulfate (SDS) | Strong ionic detergent for rigorous chip cleaning between experiments. |
| Polyelectrolyte Solutions (e.g., PEI, PSS) | For building precursor layers to immobilize charged nanoparticles if needed. |
Procedure:
- Chip Preparation: Clean the sensor chip sequentially with SDS, deionized water, and ethanol under a nitrogen stream. Plasma clean for 5 minutes.
- Baseline Establishment: Mount the chip in the QCM-D chamber. Flow PBS at 100 µL/min until a stable baseline for frequency (Δf) and energy dissipation (ΔD) is achieved (typically 30+ minutes).
- Nanoparticle Surface Immobilization:
- For direct adsorption: Introduce a 50 µg/mL suspension of nanoparticles (PEGylated or bare) in PBS over the chip until a stable frequency shift indicates monolayer adsorption (~30-60 min).
- For layer-by-layer assembly: First adsorb a cationic polyelectrolyte (e.g., polyethylenimine), then an anionic one (e.g., polystyrenesulfonate), followed by the cationic nanoparticle suspension.
- Rinse: Flow PBS thoroughly to remove any loosely bound particles until Δf stabilizes.
- Protein Adsorption: Introduce a 1 mg/mL solution of the target protein (HSA or fibrinogen) in PBS at a constant flow rate.
- Data Acquisition: Monitor Δf (primarily related to adsorbed mass, including coupled water) and ΔD (related to film viscoelasticity) in real-time throughout the protein injection.
- Rinse and Regeneration: Return to PBS flow to observe desorption of loosely bound protein. Clean the entire system with 1% SDS for the next run.
Protocol 2: Evaluating Opsonization by Serum Incubation and SDS-PAGE Analysis
Objective: To qualitatively and semi-quantitatively analyze the profile of proteins (opsonins) adsorbed onto nanoparticles after exposure to biological serum.
Research Reagent Solutions & Materials:
| Item | Function |
|---|---|
| PEGylated & Control Nanoparticles | Lyophilized or concentrated stock for incubation. |
| Fetal Bovine Serum (FBS) or Human Plasma | Complex biological fluid source of opsonins. |
| Beckman Coulter Airfuge Ultracentrifuge | Provides high g-force to pellet nanoparticles and isolate the protein corona efficiently. |
| Laemmli Sample Buffer (2X, with β-mercaptoethanol) | Denatures and reduces adsorbed proteins for electrophoresis. |
| Precast Polyacrylamide Gradient Gels (4-20%) | For separation of a wide range of protein molecular weights. |
| Coomassie Brilliant Blue or Silver Stain Kit | For visualizing separated protein bands. |
Procedure:
- Serum Incubation: Incubate a fixed amount (e.g., 1 mg) of nanoparticles with 1 mL of 50% FBS in PBS for 1 hour at 37°C with gentle rotation.
- Corona Isolation: Transfer the mixture to an Airfuge ultracentrifuge tube. Pellet the nanoparticles at ~100,000 x g for 30 minutes at 4°C. Carefully aspirate the supernatant.
- Washing: Gently resuspend the pellet in 1 mL of cold PBS. Repeat the ultracentrifugation step twice to remove unbound/loosely associated proteins.
- Protein Elution: Resuspend the final nanoparticle pellet in 50 µL of 1X Laemmli buffer. Heat at 95°C for 10 minutes to elute and denature the hard corona proteins.
- Separation: Centrifuge the heated samples at high speed to pellet the bare nanoparticles. Load 20 µL of the supernatant (containing eluted proteins) onto the precast gel. Include a molecular weight ladder and a sample of diluted FBS (1:100 in sample buffer) as a reference.
- Electrophoresis & Staining: Run the gel at constant voltage (150V) until the dye front reaches the bottom. Stain the gel with Coomassie Blue or a sensitive silver stain according to the manufacturer's protocol.
- Analysis: Visually compare band intensities between PEGylated and non-PEGylated samples. Key opsonins like immunoglobulin G (~150 kDa), fibrinogen (~340 kDa), and complement proteins (C3, ~185 kDa) will show markedly reduced intensity on PEGylated nanoparticles.
Diagrams
Mechanism of PEG-Mediated Steric Repulsion
Workflow to Link Shield Properties to Function
Application Notes
Within the broader research on PEGylation strategies to mitigate nanoparticle (NP) opsonization and clearance, the primary pharmacokinetic (PK) benefits are twofold: a significant prolongation of systemic circulation half-life (t1/2) and a consequential enhancement of the Enhanced Permeability and Retention (EPR) effect in target tissues, typically tumors. PEGylation creates a hydrophilic, steric barrier on the NP surface, reducing protein opsonization (e.g., by complement factors, immunoglobulins) and subsequent recognition by the mononuclear phagocyte system (MPS), primarily in the liver and spleen. This "stealth" characteristic directly increases t1/2. The longer circulation time increases the probability of NP extravasation through the leaky vasculature characteristic of pathological sites, leading to enhanced passive targeting via the EPR effect.
Table 1: Impact of PEGylation on Nanoparticle Pharmacokinetics and Biodistribution
| Nanoparticle Formulation | PEG Molecular Weight (kDa) / Density | Circulation Half-life (t1/2) | Liver Accumulation (%ID/g) | Tumor Accumulation (%ID/g) | Key Finding |
|---|---|---|---|---|---|
| Non-PEGylated Liposomes | 0 / 0 | 0.5 - 2 h | 25-35 | 0.5 - 2 | Rapid MPS clearance, minimal EPR. |
| PEGylated Liposomes (Standard) | 2 / 5% molar | 15 - 24 h | 8-15 | 3 - 6 | Prototypical stealth effect; benchmark formulation. |
| PEG-PLGA Nanoparticles | 5 / ~10 chains/particle | 12 - 20 h | 10-20 | 4 - 8 | Dense PEG corona enhances stability and circulation. |
| High-Density PEG Micelles | 2 / >20% molar | >30 h | <5 | 5 - 10 | Optimal shielding, maximal t1/2, but potential for reduced cellular uptake. |
| PEGylated Gold Nanorods | 5 / Dense monolayer | 18 - 30 h | 6-12 | 6 - 12 | Inorganic core, tunable optics, demonstrates universal PEG benefit. |
%ID/g: Percentage of Injected Dose per gram of tissue.
Table 2: Key Parameters Influencing PK Outcomes of PEGylation
| Parameter | Effect on Opsonization/Clearance | Optimal Range for Long t1/2 | Impact on EPR Enhancement |
|---|---|---|---|
| PEG Molecular Weight (MW) | Higher MW = thicker barrier, but very high MW can induce immune response. | 2 - 5 kDa | Higher MW increases circulation time, directly boosting EPR. |
| PEG Surface Density (Grafting Density) | Higher density = more complete shielding. Critical for preventing protein adsorption. | >5% molar (lipids); >0.5 chains/nm² (polymers) | Maximizes the stealth effect, leading to highest EPR. |
| PEG Conjugation Chemistry | Stable linkage (amide, carbamate) prevents premature dePEGylation. | Stable, non-hydrolyzable bonds in vivo. | Ensures stealth property is maintained throughout circulation. |
| Nanoparticle Size (with PEG layer) | Sub-100 nm avoids splenic filtration; <200 nm for EPR. | 80 - 150 nm (including PEG corona) | Optimal size for vascular extravasation and interstitial penetration. |
Experimental Protocols
Protocol 1: Assessing Circulation Half-life of PEGylated vs. Non-PEGylated Nanoparticles
Objective: To quantify the increase in blood circulation half-life afforded by PEGylation.
Materials:
- Test formulations: PEGylated NPs and non-PEGylated NPs (matched in core composition and size).
- Fluorescent dye (e.g., DiR, Cy5.5) or radiolabel (e.g., ³H, ¹¹¹In) for tracking.
- Animal model (e.g., BALB/c mice).
- Heparinized capillary tubes or syringes.
- Microplate reader or gamma counter.
- Software for PK modeling (e.g., PK Solver).
Procedure:
- Labeling: Incorporate a hydrophobic dye into the nanoparticle lipid bilayer or conjugate it to the polymer/particle surface. Purify to remove unencapsulated/free dye.
- Dosing: Administer NPs intravenously via tail vein at a standardized dose (e.g., 5 mg/kg NP or 100 µL of dye-labeled NP suspension).
- Blood Sampling: At predetermined time points (e.g., 5 min, 30 min, 2 h, 6 h, 12 h, 24 h, 48 h), collect blood samples (~20 µL) via retro-orbital or submandibular bleed into heparinized tubes.
- Sample Processing: Lyse blood samples with 1% Triton X-100. Centrifuge to remove debris.
- Quantification: Measure fluorescence/radioactivity in the supernatant. Create a standard curve from spiked control blood samples to determine the percentage of injected dose (%ID) remaining in blood per mL.
- PK Analysis: Plot %ID/mL vs. time. Fit data to a two-compartment or non-compartmental model using PK software to calculate the elimination half-life (t1/2,β).
Protocol 2: Evaluating the EPR Effect via Tumor Accumulation
Objective: To demonstrate enhanced tumor accumulation of long-circulating PEGylated NPs.
Materials:
- Tumor-bearing mouse model (e.g., subcutaneous xenograft of CT26 or HeLa cells).
- PEGylated and non-PEGylated NP formulations (labeled).
- In vivo imaging system (IVIS) for fluorescent probes, or facilities for tissue harvesting.
- Confocal microscopy equipment.
Procedure:
- Tumor Model: Allow tumors to grow to ~100-200 mm³.
- Administration: Inject NPs intravenously as in Protocol 1.
- In Vivo Imaging: At selected time points (e.g., 4 h, 24 h, 48 h), anesthetize mice and acquire whole-body fluorescence images using IVIS. Compare signal intensity at the tumor site.
- Ex Vivo Biodistribution: At terminal time points (e.g., 24 h and 48 h), euthanize animals. Harvest tumor, liver, spleen, kidneys, heart, and lungs. Weigh organs, homogenize, and solubilize. Quantify fluorescence/radioactivity in each organ. Express data as %ID/g of tissue.
- Histological Analysis: For selected tumors, freeze or OCT-embed. Section and stain with DAPI for nuclei. Image using confocal microscopy to visualize NP localization within tumor vessels and parenchyma.
The Scientist's Toolkit: Key Research Reagent Solutions
Table 3: Essential Materials for PEGylation and PK/EPR Studies
| Item | Function/Application |
|---|---|
| DSPE-PEG(2000/5000) | Phospholipid-PEG conjugate for post-insertion or co-formulation into lipid-based NPs (liposomes, micelles). Provides anchoring and stealth layer. |
| mPEG-NHS Ester | Methoxy-PEG with N-hydroxysuccinimide ester for covalent conjugation to amine groups on protein or nanoparticle surfaces. |
| HSPC/Cholesterol | Core lipid components for forming stable liposomal bilayers, often used with DSPE-PEG to create stealth liposomes. |
| PLGA-PEG Diblock Copolymer | Forms PEGylated polymeric nanoparticles or micelles via nanoprecipitation or emulsion methods. PLGA provides biodegradable core. |
| Near-Infrared (NIR) Dyes (DiR, Cy7.5) | Hydrophobic or reactive dyes for in vivo and ex vivo tracking of nanoparticles due to low tissue autofluorescence in NIR range. |
| Anti-PEG IgM/IgG ELISA Kits | To assess the anti-PEG immune response (Accelerated Blood Clearance phenomenon) in pre-dosed animal models. |
| Size Exclusion Chromatography (SEC) Columns | For purifying PEGylated conjugates and measuring hydrodynamic diameter changes post-PEGylation. |
Visualization Diagrams
Title: PEGylation Mechanism for Enhanced PK and EPR
Title: PK and Biodistribution Study Workflow
Historical Context and Evolution of PEG from Polymer to Nanomedicine Gold Standard
PEGylation, the covalent attachment of polyethylene glycol (PEG) chains to therapeutic molecules and nanoparticles, is a cornerstone strategy in nanomedicine. Within the broader thesis on mitigating nanoparticle opsonization and clearance, this article details the historical trajectory of PEG, from its synthesis as an inert polymer to its established role as a "stealth" agent. The following application notes and protocols provide a practical framework for implementing and evaluating PEGylation strategies in research.
Historical Application Notes
Early Development (1940s-1970s)
PEG was first synthesized in 1859 but found significant application a century later. Its initial uses were as industrial surfactants and laxatives (MiraLAX), highlighting its biocompatibility and solubility.
The Stealth Concept Emerges (1970s-1990s)
The pioneering work of Frank Davis and colleagues in the 1970s, attaching PEG to proteins, demonstrated reduced immunogenicity and prolonged circulation. This laid the groundwork for the "stealth" hypothesis: that a hydrophilic, neutrally charged PEG corona could reduce protein adsorption (opsonization) and delay recognition by the mononuclear phagocyte system (MPS).
Evolution into Nanomedicine (1990s-Present)
The advent of nanomedicine propelled PEG to gold-standard status. PEG lipids became essential for stabilizing liposomal formulations, culminating in the 1995 FDA approval of Doxil (PEGylated liposomal doxorubicin), a landmark achievement. PEG is now integral to lipid nanoparticles (LNPs), including those used for mRNA COVID-19 vaccines, polymer-drug conjugates, and diagnostic agents.
Table 1: Key Milestones in PEG Evolution
| Decade | Milestone | Impact on Opsonization/Clearance |
|---|---|---|
| 1970s | First protein PEGylation (Albumin) | Demonstrated prolonged plasma half-life. |
| 1990s | Approval of PEG-adenosine deaminase (Adagen) | First FDA-approved PEGylated protein. |
| 1995 | Approval of Doxil (PEGylated liposome) | Validated "stealth" effect in vivo; reduced MPS uptake. |
| 2000s | PEGylation of siRNA & aptamers | Extended circulation for oligonucleotide therapeutics. |
| 2020s | Use of PEG-lipids in COVID-19 mRNA LNPs | Critical for in vivo delivery efficiency and stability. |
Quantitative Data on PEG Efficacy
Table 2: Impact of PEGylation on Pharmacokinetic Parameters
| Nanoparticle Core | PEG Chain Length (kDa) / Density | Change in Half-life (vs. non-PEGylated) | Reduction in Liver Clearance |
|---|---|---|---|
| Liposomal Doxorubicin | 2 kDa, ~5% molar lipid | Increase from ~2 hr to ~55 hr | ~90% reduction in Kupffer cell uptake |
| Poly(lactic-co-glycolic acid) (PLGA) NPs | 5 kDa, dense brush | Increase from 0.5 hr to >12 hr | ~75% reduction |
| Gold Nanospheres (15 nm) | 2 kDa, low density | Increase from 0.2 hr to 2 hr | ~50% reduction |
| siRNA-LNPs | 2 kDa, ~1.5% molar lipid | Enables >24 hr circulation | Critical for hepatic delivery |
Experimental Protocols
Protocol 1: Synthesis of Maleimide-Terminated PEG (MAL-PEG-NHS) for Conjugation to Thiolated Nanoparticles
Objective: To functionalize PEG for site-specific conjugation to nanoparticles bearing free thiol (-SH) groups. Materials: See "Scientist's Toolkit" below. Procedure:
- Activation: Dissolve PEG-diamine (1 mmol) and NHS (2.2 mmol) in 20 mL anhydrous DMF under argon.
- Reaction: Add DIC (2.2 mmol) dropwise at 0°C. Stir for 4 hours at room temperature (RT).
- Precipitation: Filter the mixture to remove urea byproduct. Precipitate the product (NHS-PEG-NHS) in cold diethyl ether. Dry under vacuum.
- Maleimide Capping: Dissolve NHS-PEG-NHS (0.8 mmol) and maleimide-acetic acid (1.6 mmol) in DMF. Add DIC (1.6 mmol). React overnight at RT.
- Purification: Precipitate in ether, filter, and purify via size-exclusion chromatography. Lyophilize to obtain MAL-PEG-NHS as a white powder. Characterize by 1H-NMR and MALDI-TOF.
Protocol 2: PEGylation of Liposomal Nanoparticles via Post-Insertion Technique
Objective: To incorporate PEG-lipids into pre-formed liposomes to create a stealth corona. Materials: Pre-formed liposomes (100 nm, e.g., DSPC/Cholesterol), mPEG-DSPE (MW 2000), HEPES buffer (10 mM, pH 6.5). Procedure:
- Micelle Formation: Dissolve mPEG-DSPE in HEPES buffer to 5 mg/mL. Sonicate in a bath sonicator at 60°C for 15 min to form PEG-lipid micelles.
- Incubation: Mix pre-formed liposomes (10 mg/mL phospholipid) with the PEG-lipid micelle solution at a 5-10 mol% target ratio. Incubate with gentle stirring at 60°C for 1 hour.
- Purification: Cool to RT. Remove unincorporated PEG-lipid by dialyzing against HEPES buffer (MWCO 100 kDa) for 24 hours or via size-exclusion chromatography (Sepharose CL-4B column).
- Characterization: Measure particle size and zeta potential via dynamic light scattering (DLS). Confirm PEG density via colorimetric assay for phospholipid content and 1H-NMR.
Protocol 3: Evaluating Stealth Properties: Plasma Protein Adsorption Assay
Objective: To quantify the reduction in opsonization on PEGylated versus non-PEGylated nanoparticles. Materials: PEGylated and bare nanoparticles, human plasma, PBS, SDS-PAGE kit, BCA assay kit. Procedure:
- Incubation: Incubate 1 mg of each nanoparticle type with 1 mL of 50% human plasma in PBS at 37°C for 1 hour with end-over-end rotation.
- Separation: Centrifuge at 21,000 x g for 30 min to pellet the nanoparticles with adsorbed proteins. Wash pellet 3x with cold PBS.
- Elution: Resuspend the final pellet in 50 μL of 2% SDS solution. Heat at 95°C for 10 min to elute adsorbed proteins.
- Analysis:
- Run the eluate on a 4-20% gradient SDS-PAGE gel. Stain with Coomassie Blue to visualize the "protein corona" profile.
- Perform a BCA assay on the eluate to quantify total adsorbed protein. Calculate % reduction for PEGylated samples.
Visualizations
Diagram 1: Clearance of Non-PEGylated Nanoparticles
Diagram 2: Stealth Effect of PEGylated Nanoparticles
Diagram 3: Workflow for Evaluating PEGylation Strategies
The Scientist's Toolkit
Table 3: Essential Research Reagents for PEGylation Studies
| Reagent / Material | Function / Role in PEGylation Research |
|---|---|
| mPEG-NHS Ester (MW 2000, 5000) | Gold-standard reagent for amine conjugation. Used to PEGylate lysine residues on proteins or amine-functionalized nanoparticles. |
| Maleimide-PEG-NHS (MAL-PEG-NHS) | Enables site-specific conjugation to thiol (-SH) groups. Critical for controlled orientation of antibodies or targeting ligands. |
| DSPE-PEG(2000) Amine / Carboxyl | PEG-lipid conjugate for creating stealth liposomes and LNPs. Used in post-insertion or co-formulation. Functional end-group allows further coupling. |
| Heterobifunctional PEGs (e.g., NH2-PEG-COOH, MAL-PEG-NHS) | Provide flexible linkers for multi-step conjugations and creating complex nanocarrier architectures. |
| Size-Exclusion Chromatography (SEC) Media (Sephadex G-25, Sepharose CL-4B) | Critical for purifying PEGylated conjugates from unreacted PEG, catalysts, or byproducts. |
| Dynamic Light Scattering (DLS) / Zetasizer | Instruments to measure hydrodynamic diameter (size), polydispersity index (PDI), and zeta potential before and after PEGylation. |
| SDS-PAGE & Coomassie Staining Kit | Standard for analyzing protein corona composition and confirming successful protein-PEG conjugate formation. |
| BCA or Micro-BCA Protein Assay Kit | For quantifying total protein adsorbed onto nanoparticles in opsonization assays. |
Crafting the Stealth Coating: Practical PEGylation Techniques and Architectural Designs
Within the ongoing thesis research on PEGylation strategies to reduce nanoparticle opsonization and clearance, the selection of a robust, stable bioconjugation chemistry is paramount. The efficacy of the PEG "stealth" layer is critically dependent on the covalent linkage anchoring it to the nanoparticle surface or therapeutic payload. NHS esters, maleimide, and click chemistry represent three cornerstone strategies, each with distinct advantages in terms of reactivity, stability, and biocompatibility. This document provides detailed application notes and protocols for implementing these chemistries in the context of nanoparticle functionalization for long-circulating drug delivery systems.
Table 1: Comparison of Key Conjugation Strategies
| Parameter | NHS Ester Chemistry | Maleimide Chemistry | Copper-Free Click Chemistry (e.g., SPAAC) |
|---|---|---|---|
| Target Functional Group | Primary amines (-NH₂) | Thiols (-SH) | Azides (N₃) or Cyclooctynes |
| Reaction pH | 7.0-9.0 (optimal 8.0-8.5) | 6.5-7.5 (to prevent thiol hydrolysis) | 7.0-8.0, physiologically compatible |
| Typical Reaction Time | 30 min - 2 hours | 1 - 4 hours | 1 - 12 hours |
| Reaction Stability | Hydrolyzes in aqueous buffer (t½ ~1h at pH 7.4) | Thioether bond can be cleaved in vivo via retro-Michael | Exceptionally stable triazole linkage |
| In Vivo Linkage Stability | Stable amide bond | Susceptible to thiol exchange in plasma | Highly stable, bioorthogonal |
| Common Application in Thesis Context | PEG-NHS to amine-coated nanoparticle surfaces | PEG-maleimide to thiolated ligands or proteins | PEG-cyclooctyne to azide-functionalized nanoparticles |
Table 2: Representative Reagent Properties and Yields
| Reagent (Example) | Molecular Weight (Da) | Typical Conjugation Efficiency | Post-Conjugation Stability (in PBS, 37°C) |
|---|---|---|---|
| NHS-PEG(5k)-OH | ~5,000 | 70-90% (on amine surfaces) | > 95% stable after 1 week |
| Mal-PEG(5k)-NHS | ~5,300 | 80-95% (on thiols) | ~85% stable (thioether bond) |
| DBCO-PEG(5k)-NHS | ~5,400 | >90% (on azides) | > 99% stable after 1 week |
Research Reagent Solutions Toolkit
Table 3: Essential Materials for Conjugation Experiments
| Item Name | Function & Explanation |
|---|---|
| NHS-PEG Derivative | Reacts with lysine amines or surface amines to form stable amide bonds. Key for initial PEG coating. |
| Maleimide-PEG Derivative | Selective conjugation to cysteine thiols (-SH) for site-specific protein/nanoparticle attachment. |
| DBCO-PEG Derivative | Strain-promoted alkyne for copper-free click reaction with azides, enabling bioorthogonal labeling. |
| Tris(2-carboxyethyl)phosphine (TCEP) | Reducing agent to cleave disulfide bonds and generate free thiols for maleimide reaction. |
| HEPES Buffer (pH 7.2-7.5) | Optimal buffer for maleimide reactions, lacks primary amines that compete with NHS chemistry. |
| Zeba Spin Desalting Columns | For rapid buffer exchange and removal of unreacted dyes, crosslinkers, or quenching agents. |
| Azide-Functionalized Nanoparticle | Pre-modified nanoparticle core providing the target for DBCO-PEG click conjugation. |
| Gel Permeation Chromatography (GPC) System | Analyzes conjugate size and purity, confirming successful PEGylation and absence of aggregates. |
Experimental Protocols
Protocol 4.1: Conjugation of NHS-PEG to Amine-Modified Nanoparticles
Objective: To create a stable amide linkage between a PEG stealth layer and an amine-functionalized nanoparticle (NP) surface. Materials: Amine-NPs (10 mg/mL in PBS), NHS-PEG(5k)-OMe (10 mM in anhydrous DMSO), 1M Borate Buffer (pH 8.5). Procedure:
- Activation: Dilute 100 µL of amine-NPs into 890 µL of borate buffer (pH 8.5) in a low-protein-binding microcentrifuge tube.
- Reaction: Add 10 µL of NHS-PEG(5k)-OMe stock solution dropwise while vortexing gently. Final PEG concentration is 0.1 mM.
- Incubation: React for 2 hours at room temperature with end-over-end mixing.
- Quenching: Add 10 µL of 1M Tris-HCl (pH 7.5) and incubate for 15 minutes to quench unreacted NHS esters.
- Purification: Purify the PEGylated NPs using size-exclusion chromatography (Sepharose CL-4B) or centrifugal filtration (100kDa MWCO) with PBS as the eluent.
- Characterization: Determine PEG grafting density via TNBSA assay for residual amines and DLS for hydrodynamic diameter increase.
Protocol 4.2: Site-Specific Conjugation Using Maleimide-PEG to a Thiolated Antibody
Objective: To attach PEG to a site-specifically introduced cysteine residue on a targeting antibody. Materials: Monoclonal Antibody (2 mg/mL in PBS), Traut's Reagent (2-iminothiolane), Maleimide-PEG(5k), Zeba Spin Column (7kDa MWCO), HEPES Buffer (pH 7.3), TCEP. Procedure:
- Thiolation: Reduce the antibody with a 10-fold molar excess of TCEP (10 mM stock) for 30 min at RT. Desalt into HEPES buffer using a Zeba column.
- Thiol Introduction: React with a 20-fold molar excess of Traut's Reagent for 1 hour at RT. Desalt again to remove excess reagent.
- Conjugation: Add a 15-fold molar excess of Maleimide-PEG(5k) to the thiolated antibody. Incubate for 3 hours at 4°C in the dark.
- Quenching: Add a 100-fold molar excess of free L-cysteine relative to maleimide and incubate for 15 minutes.
- Purification: Purify the conjugate using an affinity column (e.g., Protein A) or SEC (FPLC).
- Analysis: Confirm conjugation by SDS-PAGE (gel shift) and measure thiol concentration via Ellman's assay.
Protocol 4.3: Copper-Free Click Conjugation of DBCO-PEG to Azide-NPs
Objective: To employ bioorthogonal click chemistry for efficient, stable PEGylation under physiological conditions. Materials: Azide-functionalized NPs (5 mg/mL in PBS), DBCO-PEG(5k)-COOH (5 mM in DMSO), PBS (pH 7.4), Amicon Ultra Centrifugal Filter (appropriate MWCO). Procedure:
- Preparation: Equilibrate azide-NPs in PBS via one wash cycle using centrifugal filtration.
- Reaction: Add DBCO-PEG reagent to the NP solution at a 50-fold molar excess relative to surface azide concentration. Mix gently.
- Incubation: Allow the reaction to proceed for 12 hours at room temperature with gentle agitation.
- Purification: Wash the NPs thoroughly with PBS using centrifugal filtration (3x 5 mL) to remove unclicked PEG reagent.
- Verification: Confirm conjugation via FTIR (for azide peak disappearance at ~2100 cm⁻¹) or by fluorescence if using a labeled PEG.
Visualization Diagrams
Diagram Title: NHS-PEG Conjugation to Amine Nanoparticles Workflow
Diagram Title: In Vivo Stability of PEG Linkage Chemistries
Diagram Title: Decision Tree for Conjugation Chemistry Selection
Application Notes: The Impact of PEG Architecture on Nanoparticle Stealth
The systematic comparison of linear, branched, and brush-like PEG configurations is central to advancing PEGylation strategies aimed at reducing nanoparticle opsonization and clearance. The architecture dictates the density, conformation, and steric barrier efficacy of the PEG layer, directly influencing pharmacokinetics and biodistribution.
Key Quantitative Data Summary
Table 1: Comparative Characteristics of PEG Architectures
| Parameter | Linear PEG | Branched PEG (e.g., Y-shaped) | Brush-like PEG (Dense Polymer Brush) |
|---|---|---|---|
| Grafting Density | Low to Moderate | Moderate | Very High |
| Conformation | "Mushroom" to "Brush" transition | Intermediate "Dense Mushroom" | Extended "Brush" |
| Hydrodynamic Thickness | ~5-10 nm (for 5 kDa) | ~8-15 nm (for 2x 2.5 kDa arms) | ~15-30 nm (for 5 kDa) |
| Protein Adsorption Reduction | Moderate (~40-60%) | High (~60-75%) | Very High (~80-95%) |
| Macrophage Uptake Reduction | Moderate | High | Very High |
| Blood Circulation Half-life (t1/2) | Moderate (~4-8 h in murine models) | Extended (~8-15 h) | Longest (~12-24 h+) |
| Synthesis & Conjugation Complexity | Low | Moderate | High |
Table 2: In Vivo Performance Metrics from Representative Studies
| Study Model | PEG Architecture | Core NP | Key Outcome vs. Non-PEGylated |
|---|---|---|---|
| Murine, i.v. injection | Linear (5 kDa) | Liposome | 5-fold increase in AUC; 4x longer t1/2 |
| Rat, i.v. injection | Branched (2 x 2.5 kDa) | Poly(lactic-co-glycolic acid) (PLGA) NP | 12-fold increase in AUC; 10x longer t1/2 |
| Murine, i.v. injection | Brush-like (2 kDa, high density) | Polystyrene NP | >50-fold reduction in liver uptake at 1h; 20x longer t1/2 |
Experimental Protocols
Protocol 1: Synthesis of Brush-like PEGylated Nanoparticles via "Grafting-to" Method Objective: To conjugate pre-synthesized ω-functionalized linear PEG chains onto amine-functionalized nanoparticles to create a dense brush configuration. Materials: Amine-functionalized PLGA nanoparticles (100 nm), methoxy-PEG-succinimidyl carboxymethyl ester (mPEG-SCM, 2 kDa), borate buffer (0.1 M, pH 8.5), centrifugation equipment. Procedure:
- Suspend 10 mg of amine-PLGA NPs in 5 mL of borate buffer.
- Add a 100-fold molar excess of mPEG-SCM to surface amine groups. Vortex immediately.
- React for 4 hours at room temperature with gentle stirring.
- Purify the PEGylated NPs via three cycles of centrifugation (20,000 x g, 20 min) and resuspension in PBS.
- Characterize grafting density via 1H-NMR of digested particles or by colorimetric assay for residual surface amines.
Protocol 2: In Vitro Macrophage Uptake Assay (Flow Cytometry) Objective: To quantify the reduction in nanoparticle uptake by RAW 264.7 macrophages as a function of PEG architecture. Materials: RAW 264.7 cell line, fluorescently labeled NPs (linear, branched, brush-like), flow cytometry buffer (PBS + 1% BSA), flow cytometer. Procedure:
- Seed cells in a 12-well plate at 2.5 x 10^5 cells/well. Incubate overnight.
- Treat cells with fluorescent NPs (equivalent particle number) for 3 hours at 37°C, 5% CO2.
- Wash cells 3x with cold PBS, detach using gentle scraping.
- Centrifuge cell suspension (300 x g, 5 min), resuspend in flow buffer, and keep on ice.
- Analyze using a flow cytometer (e.g., FITC channel). Gate on live cells and measure the geometric mean fluorescence intensity (MFI) of 10,000 cells per sample.
- Calculate percentage uptake relative to non-PEGylated control NPs.
Protocol 3: Pharmacokinetic Profiling in a Murine Model Objective: To determine blood circulation half-life and area under the curve (AUC) for NPs with different PEG architectures. Materials: Mice (e.g., Balb/c), fluorescent or radiolabeled NP formulations, tail vein catheter, microsampling tubes, in vivo imaging system (IVIS) or gamma counter. Procedure:
- Administer a single dose (e.g., 5 mg/kg NP) via tail vein injection.
- Collect blood samples (10-20 µL) via serial tail vein nick or saphenous vein at pre-determined time points (e.g., 2 min, 15 min, 1h, 4h, 8h, 24h).
- Lyse blood samples in 1% Triton X-100/PBS. Measure fluorescence/radioactivity via plate reader or gamma counter.
- Express data as percentage of injected dose (%ID) per gram of blood or %ID/mL over time.
- Perform non-compartmental pharmacokinetic analysis using specialized software (e.g., PK Solver) to calculate t1/2, AUC, and clearance (CL).
Visualizations
PEG Architecture Determines Opsonization & Clearance
Brush-like PEG-NP Synthesis Workflow
The Scientist's Toolkit: Essential Research Reagent Solutions
| Reagent/Material | Function & Explanation |
|---|---|
| Amine-functionalized PLGA Nanoparticles | Core substrate providing reactive -NH2 groups for covalent PEG conjugation. |
| mPEG-SCM (Succinimidyl Carboxymethyl Ester) | Activated linear PEG reagent for stable amide bond formation with surface amines. |
| Branched PEG-NHS (e.g., Y-shape) | Multi-armed PEG with N-hydroxysuccinimide esters for higher grafting density per conjugation site. |
| PEG-phospholipid (DSPE-PEG) | For inserting PEG into lipid bilayers; architecture is defined by the conjugated PEG chain. |
| Borate Buffer (pH 8.5) | Optimizes reaction pH for efficient nucleophilic attack of amine on NHS ester. |
| RAW 264.7 Murine Macrophage Cell Line | Standard in vitro model for assessing immune cell uptake and stealth properties. |
| Fluorescent Lipophilic Dye (e.g., DiD, DIR) | For stable, non-leaching labeling of polymeric or lipid nanoparticles for tracking. |
| PK Solver (Software Add-in) | Open-source tool for non-compartmental pharmacokinetic analysis of blood concentration data. |
Within the broader research on PEGylation strategies to reduce nanoparticle opsonization and clearance, optimizing the physicochemical properties of the PEG layer is critical. The density, chain length (molecular weight), and surface coverage of polyethylene glycol (PEG) on nanoparticle surfaces directly dictate the efficiency of the "stealth" effect. This application note details the key parameters, experimental protocols for their optimization, and analytical methods to correlate these parameters with biological performance.
The following table summarizes the target ranges and effects of critical PEG parameters based on current literature and experimental data.
Table 1: Optimization Ranges for Critical PEG Parameters on Nanoparticles
| Parameter | Typical Optimization Range | Key Impact on Performance | Optimal Value for Stealth Effect |
|---|---|---|---|
| PEG Density (chains/nm²) | 0.5 - 2.5 | High density reduces protein adsorption & macrophage uptake. Too high can cause steric instability. | 1.0 - 2.0 (depends on MW) |
| PEG Chain Length (MW, Da) | 1,000 - 10,000 | Longer chains improve steric repulsion & circulation half-life. Increases hydrodynamic size. | 2,000 - 5,000 (common balance) |
| Surface Coverage (%) | 50% - 95% | Higher coverage improves stealth. Incomplete coverage leads to opsonin attachment sites. | > 70% (often > 85% for optimal effect) |
| Grafting Chemistry | DSPE, PLA, Thiol, Silane | Determines conjugation stability and density achievable. | DSPE-PEG for liposomes; Thiol-PEG for gold NPs. |
Detailed Experimental Protocols
Protocol 1: Synthesis and Purification of PEGylated Nanoparticles (Liposome Example)
Objective: To prepare PEGylated liposomes with controlled PEG density and chain length. Materials: Hydrogenated soy phosphatidylcholine (HSPC), cholesterol, mPEG-DSPE (varying MW: 2k, 5k), chloroform, phosphate-buffered saline (PBS, pH 7.4), rotary evaporator, extruder with 100 nm polycarbonate membranes. Procedure:
- Formulation: Dissolve HSPC, cholesterol, and the selected mPEG-DSPE lipid in chloroform at molar ratios (e.g., 55:40:5 for 5 mol% PEG-lipid) in a round-bottom flask. Vary the mPEG-DSPE percentage (0.5 - 10 mol%) to adjust density.
- Thin Film Formation: Remove solvent using rotary evaporation (40°C) to form a thin lipid film. Dry under vacuum overnight.
- Hydration: Hydrate the film with PBS at 60°C with vigorous vortexing to form multilamellar vesicles (MLVs).
- Size Reduction: Subject the MLV suspension to 5 freeze-thaw cycles (liquid nitrogen/60°C water bath). Extrude 11 times through two stacked 100 nm membranes at 60°C.
- Purification: Purify the resultant unilamellar vesicles via size exclusion chromatography (Sepharose CL-4B column) or tangential flow filtration to remove unencapsulated material and free PEG-lipid. Store at 4°C.
Protocol 2: Quantitative Analysis of PEG Surface Density and Coverage
Objective: To measure the number of PEG chains per unit area on nanoparticle surfaces. Materials: PEGylated nanoparticles, 1% Triton X-100, iodine solution (0.1 M I₂ in 0.2 M KI), UV-Vis spectrophotometer. Procedure (Iodine Complexation Assay for PEG):
- Standard Curve: Prepare standard solutions of the exact mPEG-DSPE conjugate used in formulation (0-200 µg/mL in water). For each, mix 1 mL standard with 1 mL iodine solution and 2 mL water. Incubate 15 min in the dark. Measure absorbance at 500 nm (A500). Plot A500 vs. PEG concentration.
- Sample Analysis: Lyse a known volume of purified nanoparticles (e.g., 100 µL) with 1% Triton X-100. Dilute to 1 mL. Mix 1 mL of this lysate with 1 mL iodine solution and 2 mL water. Incubate and read A500.
- Calculation: Determine total PEG mass from the standard curve. Calculate the number of PEG chains using the PEG-lipid's molecular weight. Using the mean nanoparticle diameter (from DLS) and concentration (from phosphorus assay), calculate the total surface area. PEG density (chains/nm²) = (Total # of PEG chains) / (Total nanoparticle surface area).
Protocol 3: In Vitro Evaluation of Stealth Properties
Objective: To correlate PEG parameters with reduced protein adsorption and macrophage uptake. Materials: PEGylated nanoparticles, fluorescent lipid dye (e.g., DiD), fetal bovine serum (FBS), RAW 264.7 macrophage cell line, flow cytometer, micro-BCA protein assay kit. Procedure A: Protein Corona Analysis:
- Incubate nanoparticles (1 mg/mL lipid) with 50% FBS in PBS at 37°C for 1 hr.
- Separate nanoparticle-protein complexes from unbound proteins by ultracentrifugation (100,000 g, 1 hr).
- Wash pellet gently with PBS and resuspend. Quantify total adsorbed protein using a micro-BCA assay against a BSA standard curve. Procedure B: Macrophage Uptake Assay:
- Label nanoparticles with a lipophilic dye (DiD) during formulation.
- Seed RAW 264.7 cells in a 24-well plate (2 x 10⁵ cells/well) and culture overnight.
- Incubate cells with DiD-labeled nanoparticles (50 µg lipid/mL) in serum-containing media for 2-3 hrs at 37°C.
- Wash cells thoroughly, trypsinize, and analyze DiD fluorescence via flow cytometry. Report mean fluorescence intensity (MFI) relative to non-PEGylated control.
Signaling Pathways and Experimental Workflows
Diagram Title: Impact of PEG Parameters on Nanoparticle Fate In Vivo
Diagram Title: Workflow for Optimizing Nanoparticle PEGylation
The Scientist's Toolkit: Key Research Reagent Solutions
Table 2: Essential Materials for PEGylation Optimization Studies
| Reagent/Material | Function & Rationale |
|---|---|
| mPEG-DSPE Lipids (varying MW) | The gold-standard amphiphilic PEG conjugate for lipid-based nanoparticles. Varying MW (1k-5k) allows chain length optimization. |
| Mal-PEG-NHS Ester Heterobifunctional Linkers | For covalent PEGylation of amine-containing nanoparticle surfaces (e.g., PLGA, proteins). Enables controlled density. |
| Thiolated PEG (SH-PEG-COOH) | For grafting onto gold or other metal nanoparticle surfaces via strong Au-S bonds. |
| Size Exclusion Chromatography Columns (Sepharose CL-4B, Sephadex G-75) | Critical for purifying PEGylated nanoparticles from unconjugated PEG and free reagents. |
| Iodine Solution (I₂/KI) | Key reagent for the colorimetric quantification of PEG concentration and surface density. |
| Dynamic Light Scattering (DLS) / Zetasizer | For measuring hydrodynamic diameter, PDI, and zeta potential—essential physical characterization. |
| RAW 264.7 Murine Macrophage Cell Line | Standard in vitro model for evaluating nanoparticle uptake by the reticuloendothelial system (RES). |
| Micro-BCA Protein Assay Kit | For sensitive quantification of total protein adsorbed onto nanoparticles (protein corona). |
Application Notes
This document provides a comparative analysis of passive adsorption and covalent grafting for functionalizing nanoparticle (NP) surfaces with polyethylene glycol (PEG), a central strategy to reduce opsonization and prolong systemic circulation. The primary trade-off lies between the experimental simplicity and potential bioactivity preservation of passive adsorption versus the superior stability and controllable density offered by covalent grafting.
Key Findings from Recent Literature:
- Stability: Covalently grafted PEG layers (PEGylated surfaces) demonstrate markedly higher stability in complex biological fluids and under shear stress, with less than 10% desorption over 24 hours in serum. Passively adsorbed PEG conjugates can show >50% desorption under the same conditions, leading to rapid loss of the "stealth" effect.
- Performance in Opsonization Reduction: At optimal grafting density ("brush" regime), covalent PEGylation reduces serum protein adsorption by 85-95% compared to uncoated NPs. Passive adsorption, while effective initially, shows a time-dependent decline in anti-fouling performance correlating with desorption.
- Impact on Clearance: In murine models, NPs with covalently grafted PEG (MW: 2000-5000 Da) exhibit a circulation half-life extended by 8-15 fold over uncoated NPs. Passively adsorbed PEG extends half-life by only 2-4 fold, with high variability between batches.
- Activity Trade-off: Covalent grafting, particularly using amine-reactive chemistry (e.g., NHS esters), may modify critical functional groups on therapeutic NPs (e.g., on encapsulated proteins). Passive adsorption can preserve the native structure of sensitive cargos but at the cost of coating stability.
Table 1: Comparative Performance of PEGylation Strategies
| Parameter | Passive Adsorption | Covalent Grafting | Measurement Method |
|---|---|---|---|
| Coating Stability (% remaining after 24h in 50% FBS) | 40-50% | >90% | Radiolabeling / Fluorescence quenching |
| Reduction in Protein Adsorption | 60-75% | 85-95% | BCA Assay / QCM-D |
| Circulation Half-life Extension (vs. bare NP) | 2-4 fold | 8-15 fold | Murine PK study, blood sampling |
| Grafting Density Control | Low (highly variable) | High (precise) | NMR, TGA, Colorimetric assay |
| Batch-to-Batch Reproducibility | Low | High | Dynamic Light Scattering (DLS) |
| Risk of Cargo Denaturation | Low | Moderate to High | Activity assay, CD spectroscopy |
Table 2: Common Covalent Grafting Chemistries for PEGylation
| Chemistry | Target Functional Group | Stability of Bond | Key Consideration |
|---|---|---|---|
| NHS Ester | Amine (-NH₂) | High (amide) | Fast reaction; may alter protein isoelectric point. |
| Maleimide | Thiol (-SH) | High (thioether) | Specific for cysteine; requires reducing conditions. |
| Click Chemistry (e.g., Azide-Alkyne) | Specific paired groups | Very High | Bio-orthogonal, requires pre-functionalization. |
| Epoxide | Amine, Hydroxyl | High | Can react with multiple nucleophiles. |
Experimental Protocols
Protocol 1: Assessing Coating Stability via Fluorophore Quenching
Objective: To quantify the desorption kinetics of passively adsorbed PEG versus covalently grafted PEG from nanoparticle surfaces in a biologically relevant medium. Materials: See "The Scientist's Toolkit" below. Method:
- Labeling: Label PEG polymers (e.g., PEG-COOH) with a fluorophore (e.g., FITC) at one terminus. Purify via dialysis or size-exclusion chromatography.
- Coating:
- Passive Adsorption: Incurate NPs with a 10-fold molar excess of FITC-PEG in PBS (pH 7.4) for 2 hours at room temperature with gentle agitation. Purify via ultracentrifugation (100,000 x g, 45 min) and wash 3x with PBS.
- Covalent Grafting: Activate carboxylated NPs with EDC/NHS for 15 min. React with a 5-fold molar excess of amine-terminated FITC-PEG (or FITC-PEG-NH₂) for 4 hours. Purify as above.
- Stability Assay: Resuspend coated NPs in 50% (v/v) fetal bovine serum (FBS) in PBS. Aliquot into a black 96-well plate.
- Measurement: Use a fluorescence plate reader to monitor fluorescence intensity (λex/~495 nm, λem/~519 nm) over 24-48 hours at 37°C. Include a control with 0.1% Triton X-100 to measure total fluorescence (100% reference).
- Analysis: Calculate % PEG remaining = (Ft - F0) / (Ftotal - F0) * 100, where Ft is fluorescence at time t, F0 is fluorescence of supernatant after initial wash, and Ftotal is fluorescence from Triton-lysed sample.
Protocol 2: Quantifying Protein Corona Formation
Objective: To compare the efficacy of different PEGylation strategies in reducing nonspecific serum protein adsorption. Materials: BCA assay kit, nanoparticle samples, FBS. Method:
- Incubation: Incubate equivalent concentrations (1 mg/mL) of bare NPs, passively PEGylated NPs, and covalently PEGylated NPs in 100% FBS for 1 hour at 37°C.
- Isolation: Separate protein-coated NPs from unbound proteins via ultracentrifugation (100,000 x g, 1 hour). Carefully wash the pellet 3x with PBS.
- Elution: Resuspend the final pellet in 200 μL of 2% SDS in PBS to elute adsorbed proteins. Vortex thoroughly.
- Quantification: Perform a standard micro-BCA assay according to the manufacturer's instructions. Measure absorbance at 562 nm.
- Calculation: Determine total protein mass from a standard curve. Normalize to nanoparticle mass or surface area. Report as μg protein per mg NP.
Diagrams
PEG Coating Method Decision Path
NP PEGylation Strategy Selection Workflow
The Scientist's Toolkit
Table 3: Essential Research Reagents for PEGylation Studies
| Item | Function & Key Feature | Example Vendor/Product |
|---|---|---|
| mPEG-NHS Ester (MW: 2k-5k Da) | Amine-reactive PEG for covalent grafting. Ensures chain terminus is non-reactive methoxy. | BroadPharm, JenKem Technology |
| Heterobifunctional PEG (e.g., Maleimide-PEG-NHS) | Enables oriented conjugation, e.g., to thiolated NPs or proteins. | Creative PEGWorks |
| Fluorescein-PEG-Amine (FITC-PEG-NH₂) | For tracking PEG adsorption/grafting efficiency and stability via fluorescence. | Nanocs |
| EDC (1-Ethyl-3-(3-dimethylaminopropyl)carbodiimide) | Carboxyl activator for creating amide bonds with amine-PEG. Used with NHS. | Thermo Fisher Scientific |
| Sulfo-NHS (N-Hydroxysulfosuccinimide) | Stabilizes EDC-activated intermediates, increases reaction efficiency in aqueous buffer. | Thermo Fisher Scientific |
| Size-Exclusion Chromatography (SEC) Columns | For purifying PEG-conjugated nanoparticles or proteins (desalting, removal of free PEG). | Cytiva, Bio-Rad |
| Zetasizer Nano System | Measures hydrodynamic diameter (DLS) and zeta potential to confirm PEG coating success. | Malvern Panalytical |
| Quartz Crystal Microbalance with Dissipation (QCM-D) | Label-free, real-time measurement of PEG adsorption kinetics and protein corona formation. | Biolin Scientific |
| BCA Protein Assay Kit | Colorimetric quantification of total protein adsorbed onto NPs (protein corona). | Thermo Fisher Scientific, Pierce |
Beyond the Basics: Solving PEGylation Challenges and Mitigating the ABC Phenomenon
Recognizing and Overcoming Accelerated Blood Clearance (ABC) and Anti-PEG Immunity
Within the ongoing research thesis on PEGylation strategies to reduce nanoparticle opsonization and clearance, a significant paradoxical challenge has emerged: the induction of Accelerated Blood Clearance (ABC) and anti-PEG immunity. While initial doses of PEGylated nanocarriers benefit from prolonged circulation, repeated administration can trigger robust immune responses, leading to rapid clearance of subsequent doses, thereby undermining therapeutic efficacy. This application note details the mechanisms, recognition assays, and emerging strategies to overcome this critical hurdle.
Mechanisms and Signaling Pathways
Anti-PEG immunity, primarily mediated by anti-PEG IgM and IgG antibodies, drives the ABC phenomenon. Upon a first injection, PEGylated nanoparticles can elicit a T-cell-independent B-cell response, predominantly in the spleen. Subsequent injections lead to rapid antibody binding, complement activation, and opsonization, resulting in clearance by macrophages in the liver and spleen.
Title: Anti-PEG IgM Mediated ABC Pathway
Key Research Reagent Solutions
| Reagent / Material | Function / Explanation |
|---|---|
| Methoxy-PEG Liposomes | Standard model nanoparticle to induce and study the classic ABC phenomenon. |
| Anti-PEG IgM/IgG ELISA Kits | Quantify anti-PEG antibody titers in serum post-injection. Critical for correlation with clearance kinetics. |
| Fluorescently Labeled PEG-NPs (e.g., DiD, Cy7) | Enable real-time pharmacokinetic and biodistribution tracking via IVIS or flow cytometry. |
| Complement Assay Kits (C3a, SC5b-9) | Measure complement activation products in plasma as a marker of immune complex formation. |
| PEG-Specific B-Cell Hybridomas | Tool for studying B-cell receptor binding and activation mechanisms in vitro. |
| C1q Depleted Serum | Used to confirm the role of the classical complement pathway in ABC. |
| Clodronate Liposomes | Deplete splenic and hepatic macrophages to validate their role in clearance. |
Experimental Protocols for Recognition & Quantification
Protocol 4.1: Induction and Pharmacokinetic (PK) Profiling of ABC
Objective: To establish the ABC phenomenon in vivo and quantify its impact on circulation half-life. Procedure:
- Animal Model: Use BALB/c or C57BL/6 mice (n=5-8/group).
- Priming Dose: Administer 5 mg/kg of plain PEGylated liposomes (e.g., Doxil mimic) via tail vein injection (Day 0).
- Challenge Dose: On Day 7, administer a second dose of 5 mg/kg fluorescently labeled (Cy7) PEGylated liposomes.
- Serial Blood Sampling: Collect blood retro-orbitally at 1min, 30min, 2h, 8h, and 24h post-injection.
- Sample Processing: Centrifuge blood to obtain plasma.
- Fluorescence Measurement: Quantify Cy7 fluorescence in plasma using a plate reader. Compare to a control group receiving only the challenge dose.
- Data Analysis: Calculate pharmacokinetic parameters (AUC, t₁/₂).
Table 1: Representative PK Data for ABC Phenomenon
| Group | AUC(0-24h) (μg·h/mL) | Circulating t₁/₂ (h) | Liver Uptake (%ID) at 24h |
|---|---|---|---|
| Naive (Single Dose) | 450 ± 35 | 12.5 ± 1.8 | 18 ± 3 |
| Primed (Day 7 Challenge) | 85 ± 15 | 1.2 ± 0.4 | 65 ± 7 |
Protocol 4.2: Quantification of Anti-PEG Antibodies by ELISA
Objective: To measure anti-PEG IgM and IgG titers following priming. Procedure:
- Coating: Coat a 96-well plate with 100 μL/well of 10 μg/mL PEG-BSA conjugate in carbonate buffer overnight at 4°C.
- Washing & Blocking: Wash 3x with PBS-T (0.05% Tween-20). Block with 200 μL/well of 1% BSA in PBS for 2h at RT.
- Serum Incubation: Add serial dilutions (1:50 to 1:10,000) of test sera (collected on Day 7) in duplicate. Incubate 2h at RT.
- Detection Antibody: Add HRP-conjugated goat anti-mouse IgM (μ-chain specific) or IgG (Fc specific). Incubate 1h at RT.
- Signal Development: Add TMB substrate for 15 min, stop with 1M H₂SO₄.
- Analysis: Read absorbance at 450 nm. Report titer as the highest dilution giving an absorbance >2x that of pre-immune serum.
Strategies to Overcome ABC: Application Notes
Emerging strategies focus on modulating the immune response or engineering stealth alternatives.
Table 2: Strategies to Mitigate ABC & Anti-PEG Immunity
| Strategy | Mechanism | Potential Drawback |
|---|---|---|
| Low/Ultra-low Dose Priming | Induces immune tolerance, avoiding robust IgM response. | Therapeutic window may be constrained. |
| Pre-treatment with PEGylated Polymers | Saturates anti-PEG B-cells or acts as a tolerogen. | Requires precise dosing and timing. |
| PEG Architecture Modification (e.g., brush-like, cleavable PEG) | Reduces antigenicity and/or sheds PEG post-delivery. | Synthetic complexity; altered PK. |
| Alternative Stealth Polymers (e.g., Poly(2-oxazoline), Zwitterions) | Avoids PEG-specific immunity entirely. | Long-term safety and PK databases are less extensive. |
| Immunosuppressive Regimens (e.g., transient anti-CD20) | Depletes B-cells, preventing antibody production. | Systemic immunosuppression risk. |
Title: Strategic Approaches to Overcome ABC
Protocol for Evaluating Alternative Stealth Polymers
Protocol 6.1: In Vivo Comparison of Poly(2-oxazoline) vs. PEG Coatings
Objective: To assess if Poly(2-methyl-2-oxazoline) (PMOZ) coatings avoid ABC. Procedure:
- Nanoparticle Preparation: Prepare identical liposomal cores coated with either 5 mol% PEG-DSPE or PMOZ-DSPE. Label with DiD fluorophore.
- ABC Induction Regimen: Prime mice with PEG-NPs (5 mg/kg, Day 0). Include a naive control group.
- Challenge & PK: On Day 7, administer three separate challenge groups:
- Group A (PEG-Primed): PEG-NPs
- Group B (PEG-Primed): PMOZ-NPs
- Group C (Naive): PMOZ-NPs
- Analysis: Perform PK sampling as in Protocol 4.1. Quantify liver/spleen accumulation at 24h via ex vivo imaging. Measure anti-PEG and anti-PMOZ antibodies via ELISA (using appropriate conjugates).
Expected Outcome: Group A will show ABC. Group B & C will show similar, prolonged PK, demonstrating PMOZ avoids cross-reactive immunity.
1. Introduction Within the broader thesis on PEGylation strategies to reduce nanoparticle (NP) opsonization and clearance, a critical paradox emerges: the very polymer (polyethylene glycol, PEG) that confers stealth properties in the bloodstream often hinders essential intracellular delivery steps. This "PEG Dilemma" describes the inverse relationship between prolonged systemic circulation and efficient target cell uptake and endosomal escape, ultimately impacting therapeutic efficacy. These Application Notes detail experimental protocols to quantify this dilemma.
2. Quantitative Data Summary
Table 1: Impact of PEG Density & Chain Length on Key Pharmacokinetic and Cellular Parameters
| Parameter | Short PEG Chain (2 kDa) | Long PEG Chain (5 kDa) | High PEG Density (Low MW) | Low PEG Density (High MW) | Measurement Technique |
|---|---|---|---|---|---|
| Serum Half-life | Moderate Increase (~2-4x) | Significant Increase (~5-10x) | Significant Increase | Moderate Increase | ICP-MS (for Au NPs), Fluorescence (IVIS) |
| Macrophage Uptake (in vitro) | ~40-60% of Non-PEGylated | ~20-40% of Non-PEGylated | ~15-30% of Non-PEGylated | ~50-70% of Non-PEGylated | Flow Cytometry |
| Target Cell Uptake (in vitro) | ~70-90% of Non-PEGylated | ~50-70% of Non-PEGylated | ~40-60% of Non-PEGylated | ~80-95% of Non-PEGylated | Confocal Microscopy, Flow Cytometry |
| Endosomal Escape Efficiency | ~25-40% | ~10-25% | ~5-15% | ~30-50% | Galectin-8/Galectin-9 Assay, Chloroquine Rescue Assay |
| Overall In Vivo Efficacy | Variable | Often Suboptimal | Often Low | Higher Potential | Tumor Growth Inhibition, Gene Expression |
Table 2: Strategies to Mitigate the PEG Dilemma & Their Trade-offs
| Strategy | Mechanism | Benefit | Trade-off/Challenge |
|---|---|---|---|
| PEG Shedding | pH-/Enzyme-cleavable PEG linkage | Restores uptake/escape after targeting | Complexity, linker stability in plasma |
| Dual-Ligand | PEG + Targeting ligand (e.g., folate) | Improves specific uptake | Potential accelerated clearance |
| Charge-Masking | Cationic core shielded by anionic PEG | PEG shedding exposes charge for escape | Risk of premature charge exposure |
| Alternative Polymers | e.g., Poly(2-oxazoline), Zwitterions | Potentially less inhibitory to uptake | Less clinical validation than PEG |
3. Experimental Protocols
Protocol 3.1: Quantifying Cellular Uptake of PEGylated vs. Non-PEGylated NPs via Flow Cytometry Objective: To measure the dose- and time-dependent internalization of NPs by target cells and macrophages. Materials: Fluorescently labeled NPs (e.g., Cy5-labeled), cell culture, flow cytometer. Procedure:
- Seed cells in 24-well plates (e.g., HeLa and RAW 264.7 macrophages) at 1x10^5 cells/well. Incubate overnight.
- Prepare serial dilutions of NPs in serum-free medium (e.g., 0, 10, 50, 100 µg/mL).
- Aspirate medium from cells. Add 250 µL of NP solutions per well. Incubate at 37°C for 2h and 4h.
- Critical Step: Terminate uptake by placing plates on ice. Wash cells 3x with cold PBS containing 0.5% BSA and 5 mM EDTA to remove surface-bound NPs.
- Trypsinize cells, transfer to FACS tubes, and resuspend in cold PBS with 1% FBS.
- Analyze using a flow cytometer (Cy5 channel). Gate on live cells. Report mean fluorescence intensity (MFI) normalized to non-PEGylated control at 2h.
Protocol 3.2: Assessing Endosomal Escape Efficiency via Galectin-8 Recruitment Assay Objective: To visualize and quantify endosomal damage/escape triggered by NPs. Materials: Cells stably expressing GFP-Galectin-8, PEGylated and non-PEGylated NPs, confocal microscope. Procedure:
- Seed GFP-Galectin-8 reporter cells on glass-bottom dishes 24h prior.
- Treat cells with NPs (optimized concentration from Protocol 3.1) for 4-6h.
- Fix cells with 4% PFA for 15 min, permeabilize with 0.1% Triton X-100, and stain nuclei with DAPI.
- Acquire ≥10 high-resolution z-stack images per condition using a confocal microscope.
- Analysis: Count the number of GFP-Galectin-8 puncta per cell (indicative of endosomal damage). Calculate the percentage of NP-positive cells that show >5 Galectin-8 puncta. Compare PEGylated vs. non-PEGylated formulations.
4. Visualization Diagrams
Title: The Core Conflict of the PEG Dilemma
Title: Key Experimental Workflow for PEG Dilemma Analysis
5. The Scientist's Toolkit: Research Reagent Solutions
Table 3: Essential Materials for PEG Dilemma Research
| Item | Function/Benefit | Example/Note |
|---|---|---|
| Heterobifunctional PEG Linkers (e.g., MAL-PEG-NHS) | Enables controlled, oriented conjugation of PEG to NPs/proteins, crucial for density studies. | Sunbright series (NOF America) |
| pH-Cleavable PEG Reagents (e.g., Vinyl Ether, Benzylcarbamate) | For constructing "PEG-sheddable" NPs to test escape enhancement. | Key tool for mitigation strategies. |
| Fluorescent NP Core Kits (e.g., Cy5-amine, FITC-silica) | Provides consistent, bright labeling for uptake and trafficking studies. | Avoids quenching issues. |
| Galectin-8 GFP Reporter Cell Line | Direct, quantitative readout of endosomal damage/escape. | Superior to traditional chloroquine rescue. |
| DLS/Zetasizer Instrument | Critical for measuring hydrodynamic diameter and zeta potential pre/post-PEGylation. | Confirms stealth corona. |
| Pre-formed Model Liposomes (PEGylated) | Readymade systems for isolating and studying PEG effects without synthesis variability. | Avanti Polar Lipids catalog. |
Optimization of Ligand Coupling for Active Targeting alongside Stealth Properties
Application Notes
This document details advanced strategies for conjugating targeting ligands onto the surface of PEGylated nanoparticles (NPs) without compromising their stealth properties. Within the broader thesis on PEGylation to reduce opsonization and clearance, this work addresses a central challenge: achieving targeted delivery to specific cells while maintaining prolonged systemic circulation. Dense, conformationally optimized PEG brushes are critical for minimizing protein adsorption (opsonization) and subsequent macrophage clearance. However, this same PEG layer can sterically hinder the accessibility and binding efficiency of attached targeting ligands (e.g., antibodies, peptides, aptamers). The optimal coupling strategy must therefore balance ligand density, presentation, and activity with the preservation of stealth functionality.
Table 1: Impact of Ligand Coupling Method on Nanoparticle Pharmacokinetics and Targeting Efficiency
| Coupling Strategy | PEG Mw (kDa) | Ligand Density (units/nm²) | % Initial Dose in Blood (t=2h) | Tumor Accumulation (%ID/g) | Cellular Uptake in Target Cells (vs. Non-target) |
|---|---|---|---|---|---|
| Direct Amidation (PEG terminus) | 2 | 3.5 | 45 ± 3 | 2.1 ± 0.3 | 3.5x |
| Maleimide-Thiol (PEG terminus) | 2 | 3.2 | 48 ± 4 | 4.8 ± 0.5 | 8.2x |
| SPDP Heterobifunctional Linker | 5 | 1.8 | 82 ± 5 | 6.5 ± 0.7 | 15.3x |
| Click Chemistry (PEG terminus) | 5 | 2.0 | 75 ± 6 | 5.9 ± 0.6 | 12.1x |
| Post-Insertion (Micelle) | 2 | ~1.0 | 65 ± 4 | 4.2 ± 0.4 | 6.8x |
Table 2: Quantification of Stealth Properties via Protein Corona Analysis
| NP Formulation | Total Plasma Protein Adsorption (mg/m²) | Key Opsonins Identified (Relative Abundance) | Complement C3 Deposition (Relative Units) |
|---|---|---|---|
| Non-PEGylated NP | 45.2 ± 2.1 | IgG (High), Fibrinogen (High), ApoE (Med) | 100 ± 8 |
| PEG-only (5 kDa) | 8.5 ± 0.9 | ApoA-I (High), Albumin (High) | 12 ± 3 |
| PEG-Ligand (Terminal Coupling, 2 kDa) | 18.3 ± 1.5 | IgG (Med), Albumin (High), ApoE (Low) | 35 ± 4 |
| PEG-Ligand (SPDP, 5 kDa) | 9.8 ± 1.1 | Albumin (High), ApoA-I (High) | 15 ± 2 |
The Scientist's Toolkit: Key Research Reagent Solutions
Table 3: Essential Materials for Ligand Coupling on Stealth Nanoparticles
| Item | Function/Description | Example Product/Chemical |
|---|---|---|
| Heterobifunctional PEG Linkers | Enable controlled, oriented ligand conjugation at a point distant from the NP core, preserving PEG brush integrity. | NHS-PEG-Maleimide, MAL-PEG-NHS, DSPE-PEG(2000)-NHS. |
| Thiolated Targeting Ligands | Required for maleimide-based coupling; ligands are engineered or reduced to present free -SH groups. | Anti-EGFR Fab' fragments, cRGDfK(Cys) peptides. |
| Site-Specific Conjugation Kits | Facilitate controlled antibody conjugation (e.g., to Fc regions) to preserve antigen binding. | Thunder-Link IO, SNAP-tag/CLIP-tag substrates. |
| Size Exclusion Chromatography (SEC) Columns | Critical for purifying conjugated NPs from free, unreacted ligands. | Sepharose CL-4B, PD-10 Desalting Columns. |
| Quasi-Elastic Light Scattering (QELS) Instrument | Measures hydrodynamic diameter and PDI to monitor conjugation success and aggregation. | Malvern Zetasizer Nano ZS. |
| Surface Plasmon Resonance (SPR) Chip | For quantifying ligand binding affinity and kinetics post-conjugation. | Biacore CM5 Sensor Chip. |
| Differential Centrifugation System | For washing and concentrating NP formulations. | Ultracentrifuges with appropriate rotors. |
Experimental Protocols
Protocol 1: Conjugation of cRGDfK Peptide to PLGA-PEG-NHS Nanoparticles via a Heterobifunctional Spacer
Objective: To attach a cyclic RGD peptide to PEGylated nanoparticles while maintaining a long, undisturbed PEG brush for stealth.
Materials:
- Pre-formed PLGA-PEG(5k)-NHS NPs (synthesized via nanoprecipitation)
- cRGDfK(Cys) peptide (sequence: cyclo(Arg-Gly-Asp-D-Phe-Lys(Cys)))
- SPDP (N-Succinimidyl 3-(2-pyridyldithio)propionate)
- Dithiothreitol (DTT)
- Deuterated PBS (pH 7.4)
- PD-10 Desalting Columns
- Zetasizer Nano for DLS
Method:
- NP Activation: Dissolve SPDP in anhydrous DMSO (10 mM). Add a 5-fold molar excess (relative to surface NHS groups) to the PLGA-PEG-NHS NP suspension in PBS. React for 2 hours at 4°C under gentle agitation.
- Purification: Purify the SPDP-activated NPs from free SPDP using a PD-10 column equilibrated with PBS. Collect the NP fraction (first colored/opalescent band).
- Ligand Reduction: Reduce the cRGDfK(Cys) peptide by incubating with a 20-fold molar excess of DTT in PBS for 1 hour at room temperature. Purify the thiol-exposed peptide using a separate PD-10 column under nitrogen-sparged PBS to prevent re-oxidation.
- Conjugation: Immediately mix the purified, thiolated peptide with the SPDP-activated NP suspension at a 50:1 molar ratio (peptide:estimated SPDP). Allow to react for 12-16 hours at 4°C under an inert atmosphere.
- Final Purification & Characterization: Purify the conjugated NPs (cRGD-NPs) via PD-10 chromatography. Characterize by DLS for size and PDI. Confirm conjugation and quantify ligand density using a fluorimetric assay (if using fluorescently tagged peptide) or HPLC analysis of supernatant post-conjugation.
Protocol 2: Assessing Stealth Properties via In Vitro Macrophage Uptake Assay
Objective: To quantify the impact of ligand coupling methodology on nanoparticle stealth by measuring uptake by RAW 264.7 macrophages.
Materials:
- RAW 264.7 murine macrophage cell line
- Complete DMEM culture medium
- Fluorescently labeled NP formulations (e.g., DiO-loaded)
- Flow Cytometry Buffer (PBS + 1% BSA)
- Uptake Inhibitors (e.g., chlorpromazine, cytochalasin D)
- Flow cytometer
Method:
- Cell Seeding: Seed RAW 264.7 cells in 24-well plates at 1x10^5 cells/well and culture for 24 hours.
- NP Exposure: Replace medium with fresh, serum-free medium containing fluorescent NPs (equivalent particle number). Incubate for 2 hours at 37°C, 5% CO2.
- Inhibition Controls (Optional): Pre-treat cells with specific endocytic inhibitors for 30 minutes prior to NP exposure to determine uptake mechanisms.
- Cell Harvest & Analysis: Wash cells three times with cold PBS. Detach cells using trypsin-EDTA, quench with complete medium, and centrifuge. Resuspend cell pellets in flow cytometry buffer.
- Flow Cytometry: Analyze 10,000 events per sample using a flow cytometer. Gate on live cells via FSC/SSC. Measure the mean fluorescence intensity (MFI) in the appropriate channel (e.g., FITC for DiO). Express uptake as the fold-increase in MFI relative to cells not exposed to NPs. Compare uptake between stealth PEG-only NPs, ligand-coupled NPs, and non-PEGylated controls.
Visualization Diagrams
Title: Ligand Coupling via Heterobifunctional PEG Linker
Title: Experimental Workflow for Optimization
Stability and Storage Considerations for PEGylated Nanoformulations
Within the broader research on PEGylation strategies to mitigate nanoparticle opsonization and systemic clearance, the long-term stability and appropriate storage of these nanoformulations are critical translational hurdles. While PEGylation successfully creates a steric barrier, reducing protein adsorption and extending circulation half-life, the integrity of the PEG corona itself can be compromised over time, undermining the core thesis. These application notes detail protocols and considerations to ensure that the engineered stability in vivo is not lost ex vivo during storage and handling.
Key Degradation Pathways and Stability-Limiting Factors
PEGylated nanoformulations face physical, chemical, and colloidal instability.
Chemical Instability: PEG chains, particularly via ether linkages, can undergo auto-oxidation, leading to chain scission and aldehyde formation. This degradation is accelerated by heat, light, and transition metal ions.
Physical Instability: The physical detachment of PEG conjugates (de-PEGylation) from the nanoparticle surface can occur via hydrolysis of liable ester or carbonate linkages often used in conjugation chemistry.
Colloidal Instability: Changes in the PEG layer can lead to aggregation, fusion, or precipitation of nanoparticles due to reduced steric repulsion. Ostwald ripening is also a concern for nanocrystal-based formulations.
Signaling Pathways in Nanoparticle-Cell Interactions Post-Storage: If the PEG layer degrades, the original opsonization and clearance pathways the thesis aims to block become active.
Diagram Title: Impact of PEG Stability on Nanoparticle Fate
Table 1: Impact of Storage Conditions on Key Parameters of PEGylated Liposomes
| Storage Condition (Over 6 Months) | Particle Size Change (Δ nm) | PDI Increase (Δ) | % PEG Detachment | % Drug Retention |
|---|---|---|---|---|
| 4°C, Lyophilized (with cryoprotectant) | +5.2 ± 1.8 | +0.03 ± 0.01 | 2.1 ± 0.7 | 98.5 ± 0.5 |
| 4°C, Aqueous Suspension | +18.7 ± 4.3 | +0.12 ± 0.03 | 8.5 ± 1.5 | 95.2 ± 1.2 |
| 25°C, Aqueous Suspension | +125.5 ± 25.6 | +0.35 ± 0.08 | 25.3 ± 3.8 | 82.7 ± 3.5 |
| 40°C, Aqueous Suspension (Accelerated) | Aggregation | >0.5 | 51.2 ± 5.6 | 70.1 ± 5.1 |
Table 2: Recommended Storage Formats for Common PEGylated Nanoformulations
| Nanoformulation Type | Recommended Format | Optimal Temperature | Max Recommended Shelf-Life (Aqueous) | Key Stabilizing Excipient |
|---|---|---|---|---|
| PEGylated Liposomes | Lyophilized Powder | -20°C | 3 months | Sucrose (10% w/v) |
| PEG-PLGA Nanoparticles | Lyophilized Powder | 2-8°C | 6 months | Trehalose (5% w/v) |
| PEGylated Nanocrystals | Aqueous Suspension | 2-8°C (protected from light) | 12 months | Poloxamer 188 |
| PEGylated Inorganic NPs (e.g., Au, SiO2) | Concentrated Aqueous Suspension or Dry Powder | 2-8°C | 24 months | None required for dry powder |
Experimental Protocols
Protocol 1: Assessing PEG Detachment (TNBSA Assay)
Objective: Quantify free amine groups generated due to hydrolysis of PEG-lipid conjugates (e.g., DSPE-PEG).
Materials:
- Test nanoformulation suspension
- Trinitrobenzenesulfonic acid (TNBSA) solution (0.1% in water)
- Sodium phosphate buffer (0.1 M, pH 8.5)
- Sodium dodecyl sulfate (SDS, 1%)
- Standard amine compound (e.g., glycine)
- Microplate reader
Procedure:
- Prepare a standard curve using glycine (0-100 nmol) in sodium phosphate buffer.
- Dilute nanoparticle samples to an appropriate lipid concentration in phosphate buffer. Include a blank of buffer alone.
- Add 250 µL of sample/standard to 250 µL of SDS solution.
- Add 125 µL of TNBSA solution to each tube. Vortex.
- Incubate at 60°C for 30 minutes in the dark.
- Cool to room temperature. Measure absorbance at 335 nm.
- Calculate the amount of free amine in the sample from the standard curve. The increase over time or vs. a fresh control indicates PEG-lipid hydrolysis.
Protocol 2: Accelerated Stability Testing
Objective: Predict long-term stability under normal storage conditions using elevated temperatures (Arrhenius model).
Materials:
- Aliquots of the PEGylated nanoformulation
- Controlled temperature incubators/oil baths (e.g., 4°C, 25°C, 40°C)
- Dynamic Light Scattering (DLS) instrument
- HPLC system for drug quantification
Procedure:
- Aliquot the nanoformulation into sealed, inert vials (e.g., glass with Teflon-lined caps).
- Place aliquots into stability chambers at pre-set temperatures (e.g., 4°C, 25°C, 40°C). Protect from light.
- At predetermined time points (0, 1, 2, 4, 8, 12 weeks), remove triplicate samples from each condition.
- Analysis: a. Size & PDI: Dilute sample appropriately and measure by DLS. b. Drug Content: Lyse nanoparticles (using solvent) and quantify encapsulated drug via HPLC. c. Visual Inspection: Note any color change, precipitation, or aggregation.
- Plot degradation kinetics (e.g., % drug remaining, size increase) vs. time for each temperature. Use Arrhenius equation to extrapolate degradation rate at the intended storage temperature (e.g., 2-8°C).
Protocol 3: Lyophilization of PEGylated Nanoformulations
Objective: To prepare a stable dry powder for long-term storage.
Workflow:
Diagram Title: Lyophilization Protocol for PEGylated Nanocarriers
Detailed Steps:
- Formulation: To the aqueous nano-suspension, add a cryoprotectant (e.g., sucrose, trehalose) to a final concentration of 5-10% w/v. Ensure homogeneity.
- Filling & Stoppering: Dispense into lyophilization vials, partially stopper with lyo-stoppers.
- Pre-freezing: Load vials onto a pre-cooled shelf (-40°C to -50°C) and hold for 4-6 hours to ensure complete solidification.
- Primary Drying: Activate vacuum (≤ 0.1 mBar). Set shelf temperature to -20°C to -30°C for 24-72 hours (dependent on cake thickness) to sublime ice.
- Secondary Drying: Gradually raise shelf temperature to +20°C or +25°C while maintaining vacuum. Hold for 8-12 hours to remove bound water.
- Closure: Under vacuum or after back-filling with dry nitrogen or argon gas, fully seat the stoppers and crimp seal.
- Reconstitution Test: Validate protocol by reconstituting a vial with original volume of water/WFI, followed by DLS analysis to ensure size and PDI are unchanged.
The Scientist's Toolkit: Research Reagent Solutions
Table 3: Essential Materials for Stability Studies of PEGylated Nanoformulations
| Item | Function in Stability Research | Key Consideration |
|---|---|---|
| DSPE-PEG (2000) NH₂ | Model PEG-lipid conjugate for studying hydrolysis kinetics via free amine detection (TNBSA). | Linkage stability varies (amide > carbamate > ester). |
| Sucrose / Trehalose | Cryoprotectants and lyoprotectants. Protect nanoparticle integrity during freeze-drying by forming an amorphous glass matrix. | Ratio of protectant to nanoparticle lipid/polymer is critical (typically 1:1 to 10:1 w/w). |
| Poloxamer 188 (Pluronic F68) | Non-ionic surfactant used to prevent aggregation in aqueous suspensions of PEGylated nanocrystals/particles. | Can interfere with in vitro assays; dialysis may be needed post-storage. |
| Size Exclusion Chromatography (SEC) Columns (e.g., Sepharose CL-4B, Sephacryl S-500) | Separate intact nanoparticles from degraded PEG fragments or aggregated material for quantitative analysis. | Elution buffer must match formulation pH and osmolarity to prevent artifacts. |
| Oxygen Scavengers (e.g., Ascorbic Acid, α-Tocopherol) | Added to formulations to inhibit oxidative degradation of PEG chains and lipid components. | Must be biocompatible and not destabilize the nanoparticle core. |
| DLS/Zetasizer Instrument | Gold-standard for monitoring colloidal stability (size, PDI, zeta potential) over time and after stress. | Always use the same measurement parameters (temperature, angle, dilution factor) for comparison. |
| Lyophilizer (Freeze-Dryer) | Enables conversion of aqueous nano-suspensions into stable dry powders for long-term storage. | Controlled ramp rates and precise vacuum control are essential for cake integrity. |
Evaluating Efficacy: Analytical Methods and Next-Generation Alternatives to PEG
Within the thesis on optimizing PEGylation strategies to reduce nanoparticle opsonization and clearance, benchmarking performance across model systems is critical. This document provides detailed application notes and protocols for key in vitro and in vivo assays that quantify opsonization and biodistribution, enabling direct comparison of nanoparticle formulations.
In Vitro Opsonization Assays: Protocols and Data
Protocol 1: Fluorescence-Based Plasma Protein Association Assay
Objective: To quantify the total amount of human plasma proteins adsorbed onto nanoparticles with varying PEG densities. Materials:
- Nanoparticle suspensions (e.g., PLGA, liposomes) with conjugated fluorescent tag (e.g., Cy5) or inherent fluorescence.
- Human plasma or serum (pooled, from healthy donors).
- HEPES-buffered saline (HBS), pH 7.4.
- Microcentrifuge with ultracentrifugation capability or size-exclusion chromatography (SEC) columns.
- Fluorescence plate reader. Procedure:
- Incubate 100 µL of nanoparticle suspension (1 mg/mL) with 900 µL of 10% human plasma in HBS at 37°C for 1 hour with gentle rotation.
- Separate nanoparticles from unbound protein via three methods (choose based on NP stability): a. Ultracentrifugation: Pellet nanoparticles at 100,000 x g for 45 min at 4°C. Wash pellet twice with cold HBS. b. SEC: Pass the incubation mixture through a pre-equilibrated Sepharose CL-4B column, collecting the void volume NP fraction.
- Resuspend or collect the protein-coated NPs in a known volume of HBS.
- Measure the fluorescence intensity (FI) of the recovered NPs. The relative fluorescence loss in the supernatant can also be measured.
- Calculate the Protein Association Index (PAI): PAI = (FI of NPs post-incubation & wash / FI of pristine NPs) x 100%. A lower PAI indicates less protein adsorption. Data Interpretation: PEGylated NPs typically show a higher PAI (less quenching/signal loss) compared to non-PEGylated controls.
Protocol 2: Macrophage Uptake Assay using Flow Cytometry
Objective: To measure the uptake of opsonized nanoparticles by macrophage-like cells as a functional correlate of opsonization. Materials:
- RAW 264.7 or THP-1 (differentiated to macrophages) cell line.
- Serum-free and complete cell culture media.
- Fluorescently labelled nanoparticles (pristine and plasma-incubated from Protocol 1).
- Flow cytometer. Procedure:
- Seed cells in 24-well plates at 2.5 x 10^5 cells/well and culture overnight.
- Incubate fluorescent NPs (50 µg/mL final concentration) with 10% plasma or serum-free media (control) for 1h at 37°C.
- Wash cells with PBS, then add the opsonized or control NPs to cells. Incubate for 2 hours at 37°C.
- Wash cells thoroughly with cold PBS, trypsinize, and resuspend in flow cytometry buffer.
- Analyze using flow cytometry. Measure the mean fluorescence intensity (MFI) of at least 10,000 single-cell events.
- Calculate Phagocytic Uptake Ratio: MFI (Plasma-incubated NPs) / MFI (Serum-free control NPs).
Table 1: Comparative In Vitro Opsonization Metrics for Model Nanoparticles
| Nanoparticle Formulation | PEG Density (chains/nm²) | Protein Assoc. Index (PAI, %) | Phagocytic Uptake Ratio | Primary Opsonins Identified (via LC-MS/MS) |
|---|---|---|---|---|
| Non-PEGylated PLGA | 0 | 35.2 ± 4.1 | 8.7 ± 1.2 | IgG, C3, Fibrinogen, ApoE |
| Low-Density PEG-PLGA | 0.2 | 68.5 ± 5.6 | 3.1 ± 0.4 | IgG, C3, ApoA-I |
| High-Density PEG-PLGA | 0.8 | 92.3 ± 3.8 | 1.2 ± 0.1 | Albumin, ApoA-I (low levels) |
| Target for Stealth | >0.5 | >85% | <1.5 | Albumin-dominated corona |
In Vivo Biodistribution Models: Protocols
Protocol 3: Quantitative Biodistribution in Murine Models
Objective: To measure the temporal and spatial distribution of radiolabeled or fluorescently labeled nanoparticles in major organs. Materials:
- Mice (e.g., Balb/c, nude, or humanized models).
- Radiolabeled (¹¹¹In, ⁶⁴Cu) or near-infrared fluorescent (DIR, Cy7) nanoparticles.
- In vivo imaging system (IVIS) for fluorescence or SPECT/CT for radioactivity.
- Tissue homogenizer. Procedure:
- Administer NPs via intravenous injection (e.g., 5 mg/kg, 100 µL via tail vein).
- For fluorescence imaging: Image mice at predetermined time points (e.g., 5 min, 1h, 4h, 24h) under isoflurane anesthesia using appropriate filters. Quantify fluorescence in regions of interest (ROI) over heart (blood pool), liver, spleen, and tumor.
- For radiolabel tracking: Perform SPECT/CT imaging at similar time points. Reconstruct images and quantify activity in organs.
- Terminal Biodistribution: At final time point (e.g., 24h), euthanize animals, collect organs (blood, heart, lungs, liver, spleen, kidneys, tumor). Weigh tissues. a. For fluorescence: Homogenize tissues, extract dye, and measure fluorescence against a standard curve. b. For radioactivity: Count tissue samples in a gamma counter.
- Calculate % Injected Dose per Gram of tissue (%ID/g) and % Injected Dose per Organ.
Protocol 4: Blood Clearance Kinetics and Pharmacokinetic Analysis
Objective: To determine the circulation half-life of nanoparticles. Materials:
- Cannulated mice (jugular or carotid vein) for serial blood sampling.
- Microcentrifuge tubes with anticoagulant (heparin).
- Appropriate detection method (gamma counter, fluorescence plate reader). Procedure:
- Administer NPs intravenously.
- Collect blood samples (10-20 µL) at frequent intervals (e.g., 2, 5, 15, 30, 60, 120, 240, 480 min post-injection).
- Process plasma by centrifugation.
- Measure NP signal in each plasma sample.
- Plot plasma concentration (%ID/mL) vs. time. Fit data to a bi-exponential decay model using PK analysis software (e.g., PKSolver). Report key parameters: t½α (distribution half-life), t½β (elimination half-life), AUC (area under the curve), and Clearance (CL).
Table 2: In Vivo Biodistribution and PK Parameters of Model Nanoparticles (24h Post-Injection)
| Formulation | t½β (h) | AUC₀–∞ (%ID/mL*h) | Liver (%ID/g) | Spleen (%ID/g) | Tumor (%ID/g) | Liver:Spleen Ratio | Tumor:Muscle Ratio |
|---|---|---|---|---|---|---|---|
| Non-PEGylated | 0.8 ± 0.2 | 25 ± 4 | 45.2 ± 6.5 | 18.3 ± 3.1 | 1.2 ± 0.3 | 2.5 | 1.8 |
| Low-Density PEG | 4.5 ± 1.0 | 120 ± 15 | 28.7 ± 4.2 | 9.5 ± 1.8 | 3.5 ± 0.8 | 3.0 | 4.5 |
| High-Density PEG | 18.2 ± 3.5 | 450 ± 50 | 12.1 ± 2.1 | 4.2 ± 0.9 | 6.8 ± 1.5 | 2.9 | 8.2 |
| Stealth Target | >10 h | >300 | <15 | <5 | Maximized | Minimized | >5 |
Visualizing Pathways and Workflows
Title: Nanoparticle Fate Based on Opsonization Level
Title: Integrated In Vitro-In Vivo Benchmarking Cascade
Title: PEGylation-Mediated Stealth Mechanism
The Scientist's Toolkit: Key Research Reagent Solutions
Table 3: Essential Materials for Opsonization & Biodistribution Studies
| Item & Example Source | Function in Experiments | Critical Specification/Note |
|---|---|---|
| Fluorescent Nanoparticle Kits (e.g., Cy5/DiR Labeling Kits, Thermo Fisher) | Enable tracking in vitro (flow cytometry) and in vivo (IVIS imaging). | Ensure labeling does not alter surface chemistry (e.g., use lipid dyes for liposomes). |
| Human Pooled Plasma/Serum (BioreclamationIVT, Sigma) | Source of opsonins for in vitro assays. Use healthy donor pools for consistency. | Heat-inactivated serum controls for complement activity. |
| Differentiated THP-1 Cells (ATCC) | Human monocyte-derived macrophage model for uptake studies. | Standardize differentiation with PMA (e.g., 100 nM, 48h). |
| Size-Exclusion Chromatography Columns (e.g., Sepharose CL-4B, Cytiva) | Gentle separation of protein-coated NPs from unbound proteins. | Pre-equilibrate with relevant buffer (e.g., HBS) to prevent aggregation. |
| Near-IR Fluorescent Dyes (DiR, ICG) (Lumiprobe) | For deep-tissue in vivo imaging with low autofluorescence. | Incorporate dye during NP synthesis for stable integration. |
| Radiolabeling Reagents (e.g., ¹¹¹In-oxine, ⁶⁴Cu-Cl₂, from radiopharmacy) | For gold-standard quantitative biodistribution and PK. | Requires specific chelators conjugated to NPs (e.g., DOTA, NOTA). |
| IVIS Imaging System (PerkinElmer) | Non-invasive, longitudinal fluorescence imaging in live animals. | Calibrate with standard fluorophore concentrations for semi-quantification. |
| PKSolver Pharmacokinetic Tool (Open-source Add-in for Excel) | Non-compartmental analysis of blood clearance data. | Input plasma concentration vs. time data to calculate t½, AUC, CL. |
| Anti-PEG Antibodies (e.g., AGP3, from academia/commercial) | To detect and quantify "anti-PEG" immune responses that can accelerate clearance. | Use in ELISA to screen for pre-existing or induced anti-PEG IgM/IgG. |
Application Notes
Within the broader thesis on advancing PEGylation strategies to mitigate nanoparticle opsonization and clearance, precise characterization of the nanoparticle (NP) interface is non-negotiable. The density, conformation (mushroom vs. brush), and resulting protein corona composition of surface-grafted polyethylene glycol (PEG) are the critical determinants of in vivo fate. This document details integrated protocols for quantifying these parameters, enabling rational design of long-circulating nanomedicines.
Table 1: Core Analytical Techniques for PEGylated Nanoparticle Characterization
| Parameter | Primary Technique | Key Output Metrics | Information Gained |
|---|---|---|---|
| PEG Density & Molar Mass | Size Exclusion Chromatography with Multi-Angle Light Scattering (SEC-MALS) | Mw, Mn, Mw/Mn (Đ), % free polymer | Quantifies grafted PEG molecular weight and purity, separating free from conjugated chains. |
| PEG Surface Density & Conformation | ¹H NMR Spectroscopy (Liquid-state) | Grafting density (chains/nm²), PEG conformation regime | Calculates number of PEG chains per particle surface area, determining mushroom or brush regime. |
| Hydrodynamic Size & Conformation | Dynamic Light Scattering (DLS) | Hydrodynamic diameter (Dh), Polydispersity Index (PDI) | Monitors size changes post-PEGylation; significant Dh increase suggests brush formation. |
| Protein Corona Composition | Liquid Chromatography-Tandem Mass Spectrometry (LC-MS/MS) | Protein IDs, Relative Abundance, Enrichment Factors | Identifies and quantifies proteins adsorbed from plasma, highlighting opsonic or dysopsonic proteins. |
Protocol 1: Determining PEG Grafting Density via ¹H NMR Spectroscopy
Objective: Quantify the number of PEG chains per nanoparticle and calculate surface grafting density to determine conformational regime.
Materials (Research Reagent Solutions):
- PEGylated Nanoparticles: Purified, lyophilized sample (≥ 5 mg).
- Deuterated Solvent: Deuterium oxide (D₂O) or deuterated chloroform (CDCl₃), chosen for nanoparticle solubility.
- Internal Standard: Maleic acid (for D₂O) or 1,3,5-trioxane (for CDCl₃) of known, precise concentration.
- NMR Tube: High-quality 5 mm NMR tube.
Procedure:
- Sample Preparation: Precisely weigh 2-5 mg of lyophilized PEGylated nanoparticles. Dissolve/suspend in 600 µL of deuterated solvent containing a known concentration of internal standard (e.g., 1.0 mM maleic acid).
- NMR Acquisition: Transfer to an NMR tube. Acquire a standard ¹H NMR spectrum at 298K (e.g., 500 MHz, 64 scans). Use water suppression pulse sequences if using D₂O.
- Data Analysis:
- Identify the characteristic peak for the PEG backbone methylene protons (-CH₂-CH₂-O-) at ~3.6 ppm.
- Identify the peak for the internal standard.
- Calculate the number of moles of PEG (n_PEG) using the relative integration (I) of the PEG peak versus the internal standard peak (IS), accounting for the number of protons (N) each peak represents:
n_PEG = (I_PEG / N_PEG) * (N_IS / I_IS) * n_IS - Calculate grafting density (σ):
σ = (n_PEG * N_A) / (S_BET * m), where NA is Avogadro's number, SBET is the specific surface area of the core nanoparticle (m²/g) from BET measurements, and m is the mass of nanoparticle cores in the sample (total mass minus PEG mass).
Protocol 2: Profiling the Hard Protein Corona via LC-MS/MS
Objective: Isolate and identify proteins that form the hard corona on PEGylated nanoparticles after exposure to human plasma.
Materials (Research Reagent Solutions):
- PEGylated Nanoparticles: Sterile, PBS suspension at 1 mg/mL.
- Human Plasma: Preferably fresh or freshly frozen single-donor or pooled plasma.
- Magnetic Separation Rack: For efficient washing if using magnetic cores.
- Ultracentrifugation Tubes: Polycarbonate tubes compatible with >100,000 x g.
- Lysis & Digestion Buffer: 2% Sodium Deoxycholate (SDC) in 50 mM Tris-HCl, pH 8.0.
- Digestion Enzymes: Trypsin/Lys-C mix, MS-grade.
- StageTips: C18 material for peptide desalting.
Procedure:
- Corona Formation: Incubate 500 µL of nanoparticle suspension (1 mg/mL) with 500 µL of human plasma (1:1 v/v) at 37°C for 1 hour with gentle rotation.
- Hard Corona Isolation:
- Magnetic Separation: Place the tube on a magnetic rack for 10 minutes. Carefully remove the supernatant.
- Washing: Resuspend the pellet in 1 mL of cold PBS. Repeat the magnetic separation and washing step three times.
- Alternative Ultracentrifugation: For non-magnetic particles, centrifuge at 100,000 x g for 1 hour at 4°C. Aspirate supernatant and gently wash the pellet with PBS. Repeat 3x.
- Protein Elution & Digestion: Resuspend the final corona-coated pellet in 100 µL of 2% SDC buffer. Heat at 95°C for 10 minutes. Reduce with 5 mM DTT (30 min, 37°C) and alkylate with 15 mM iodoacetamide (30 min, RT in dark). Quench with excess DTT. Digest with trypsin/Lys-C (1:50 enzyme:protein) overnight at 37°C.
- Peptide Clean-up & MS Analysis: Acidify digest with TFA to precipitate SDC. Desalt peptides using C18 StageTips. Elute and analyze via LC-MS/MS using a 60-90 minute gradient on a Q-Exactive HF or similar mass spectrometer.
- Data Processing: Use search engines (e.g., MaxQuant, Proteome Discoverer) against the human UniProt database. Apply label-free quantification (LFQ) to compare corona compositions between different PEGylation densities.
The Scientist's Toolkit: Key Reagents & Materials
| Item | Function in Characterization |
|---|---|
| D₂O with Internal Standard | NMR solvent allowing lock/frequency stabilization; internal standard enables absolute quantitation of PEG protons. |
| Maleic Acid (for D₂O) | A suitable internal standard for aqueous NMR, providing a distinct, quantifiable peak not overlapping with PEG or nanoparticle signals. |
| Ultracentrifuge & Polycarbonate Tubes | Essential for pelleting non-magnetic nanoparticles post-corona formation to isolate the hard protein corona for proteomics. |
| Sodium Deoxycholate (SDC) | An effective, MS-compatible surfactant for eluting and solubilizing corona proteins from the nanoparticle surface prior to digestion. |
| C18 StageTips | A micro-scale, robust platform for desalting and concentrating peptide mixtures prior to LC-MS/MS injection, improving data quality. |
Analytical Workflow for PEGylated NPs
Calculating PEG Density from NMR
Application Notes
Within the broader thesis on PEGylation strategies to reduce nanoparticle (NP) opsonization and clearance, this analysis compares the established standard, polyethylene glycol (PEG), against emerging stealth polymers like zwitterionic polymers (e.g., poly(carboxybetaine)) and polysarcosine (pSar). While PEG's efficacy in prolonging circulation half-life via steric hindrance and hydration is well-documented, concerns regarding anti-PEG antibodies, accelerated blood clearance (ABC), and potential oxidative degradation in vivo have driven the search for alternatives. Emerging polymers aim to achieve superior stealth through mechanisms like forming a more robust hydration layer (zwitterions) or offering enzymatic stability and non-immunogenicity (pSar).
Key Comparative Insights:
- Protein Adsorption: Zwitterionic polymers often demonstrate quantitatively lower protein adsorption (e.g., <5 ng/cm² from serum) in vitro compared to equivalent PEG coatings due to electrostatically induced hydration.
- Pharmacokinetics: In vivo, pSar and zwitterion-coated NPs can achieve circulation half-lives (t½) comparable to or exceeding PEGylated NPs, particularly after repeated administration, where the ABC effect is mitigated.
- Immunogenicity: Both zwitterions and pSar show minimal to no detectable antibody generation in preclinical models, a significant advantage over PEG.
- Manufacturing & Conjugation: PEG benefits from decades of established, reproducible conjugation chemistry (e.g., NHS esters, click chemistry). Emerging polymers require further protocol standardization, though similar coupling strategies are employed.
Protocols
Protocol 1: Synthesis and Characterization of Stealth Polymer-Functionalized PLGA Nanoparticles
Objective: Prepare and characterize poly(D,L-lactide-co-glycolide) (PLGA) NPs coated with PEG, polysarcosine, or poly(carboxybetaine methacrylate) (pCBMA).
Materials:
- PLGA (50:50, acid-terminated).
- PEG-NH₂ (5 kDa), pSar-NH₂ (5 kDa), pCBMA-NH₂ (5 kDa).
- Carbodiimide crosslinker (EDC) and N-Hydroxysuccinimide (NHS).
- Poly(vinyl alcohol) (PVA) emulsifier.
- Dichloromethane (DCM), phosphate-buffered saline (PBS, pH 7.4).
- Dialysis tubing (MWCO 12-14 kDa).
- Dynamic Light Scattering (DLS)/Zetasizer, FTIR spectrometer.
Procedure:
- NP Formation: Emulsify 100 mg PLGA in 3 mL DCM into 20 mL of 2% w/v PVA aqueous solution using probe sonication (70 W, 2 min on ice). Stir overnight to evaporate DCM.
- Polymer Conjugation: Wash NPs twice by centrifugation (20,000 x g, 20 min). Resuspend NPs in 10 mL MES buffer (pH 6.0). Add EDC (10 mM) and NHS (5 mM) to activate PLGA surface carboxyl groups for 30 min. Wash NPs to remove excess reagents. Resuspend in PBS and add a 5x molar excess of the desired amine-terminated polymer (PEG-NH₂, pSar-NH₂, or pCBMA-NH₂). React for 4 h at room temperature.
- Purification: Purify coated NPs via dialysis against distilled water for 24 h (change water every 8 h) to remove unreacted polymer and byproducts.
- Characterization: Measure hydrodynamic diameter, polydispersity index (PDI), and zeta potential via DLS. Confirm coating success by a shift in zeta potential (e.g., more neutral for PEG/pSar, slightly negative for pCBMA) and by FTIR analysis for characteristic polymer peaks (e.g., ether for PEG, carbonyl for pSar).
Protocol 2: In Vitro Protein Fouling Assay using Quartz Crystal Microbalance with Dissipation (QCM-D)
Objective: Quantify non-specific protein adsorption from human serum onto polymer-coated surfaces.
Materials:
- QCM-D sensors (gold-coated).
- Thiol-terminated polymers: HS-PEG-OH, HS-pSar-OH, HS-pCBMA-OH.
- Human serum (type AB, pooled).
- PBS (pH 7.4), ethanolamine hydrochloride (1 M, pH 8.5).
- QCM-D flow module and analyzer.
Procedure:
- Sensor Coating: Clean gold sensors in UV-ozone for 15 min. Incubate sensors overnight in 1 mg/mL solutions of thiol-terminated polymers in PBS. Rinse thoroughly with PBS and water. Block any remaining reactive sites with ethanolamine for 30 min.
- Baseline Establishment: Mount sensor in QCM-D chamber. Flow PBS at 100 µL/min until a stable frequency (Δf) and energy dissipation (ΔD) baseline is achieved (typically 30 min).
- Protein Adsorption: Switch flow to 10% (v/v) human serum in PBS for 30 min. This models the initial plasma protein interaction.
- Rinse: Switch back to PBS flow for 20 min to remove loosely bound proteins.
- Data Analysis: Calculate adsorbed mass (ng/cm²) using the Sauerbrey equation from the Δf shift in the 3rd overtone. Record ΔD to assess viscoelastic properties of the adsorbed layer.
Data Tables
Table 1: Physicochemical and In Vitro Characterization of Polymer-Coated Nanoparticles
| Polymer Coating (5 kDa) | Avg. Hydrodynamic Diameter (nm) | PDI | Zeta Potential (mV) | Serum Protein Adsorption (ng/cm², QCM-D) |
|---|---|---|---|---|
| Uncoated PLGA | 180 ± 15 | 0.12 | -35 ± 3 | 450 ± 60 |
| PEG (linear) | 205 ± 10 | 0.10 | -4 ± 2 | 45 ± 8 |
| Polysarcosine (pSar) | 210 ± 12 | 0.11 | -5 ± 1 | 30 ± 6 |
| pCBMA (Zwitterion) | 215 ± 10 | 0.13 | -8 ± 2 | 8 ± 3 |
Table 2: Preclinical In Vivo Pharmacokinetic Parameters (Single vs. Repeated Dose)
| Polymer Coating | Circulation t½ - Single Dose (min) | Circulation t½ - 2nd Dose (min, 7 days apart) | Relative AUC (0-24h) - 2nd Dose vs. 1st |
|---|---|---|---|
| PEG | 240 ± 30 | 90 ± 20 | 0.38 |
| Polysarcosine (pSar) | 260 ± 40 | 250 ± 35 | 0.96 |
| pCBMA (Zwitterion) | 280 ± 25 | 265 ± 30 | 0.95 |
Visualizations
Title: Stealth Polymer Mechanisms and Clearance Pathways
Title: Nanoparticle Polymer Coating Protocol Workflow
The Scientist's Toolkit
Table 3: Key Research Reagent Solutions for Stealth Nanoparticle Development
| Item | Function & Rationale |
|---|---|
| Amine-Terminated Polymers (PEG, pSar, pCBMA) | Enables covalent conjugation to activated carboxyl groups on NP surfaces via stable amide bond formation. |
| EDC (1-Ethyl-3-(3-dimethylaminopropyl)carbodiimide) | Zero-length crosslinker that activates carboxyl groups for direct reaction with primary amines. |
| NHS (N-Hydroxysuccinimide) | Stabilizes the EDC-activated intermediate, improving conjugation efficiency and yield. |
| PLGA (acid-terminated) | Common biodegradable polymer NP core; terminal carboxyls provide a handle for surface functionalization. |
| Quartz Crystal Microbalance (QCM-D) Chips | Enables label-free, real-time quantitative measurement of protein adsorption (mass & viscoelasticity) onto polymer films. |
| Thiol-Terminated Stealth Polymers | For forming self-assembled monolayers on gold surfaces (e.g., QCM-D sensors) to create model coatings for fouling studies. |
| Dynamic Light Scattering (DLS) Instrument | Critical for measuring NP hydrodynamic size, size distribution (PDI), and zeta potential pre- and post-coating. |
Within the broader thesis investigating PEGylation strategies to reduce nanoparticle opsonization and clearance, this review analyzes clinically translated nanotherapeutics. Polyethylene glycol (PEG) conjugation shields nanocarriers, prolonging circulation by reducing protein adsorption and recognition by the mononuclear phagocyte system (MPS). This application note details approved agents, pipeline candidates, and essential protocols for their evaluation.
Approved PEGylated Nanotherapeutics
Table 1: Selected Approved PEGylated Nanotherapeutics (as of 2024)
| Product Name (Generic) | Indication(s) | Nanocarrier Core | Key PEG Aspect | Approval Year (First) |
|---|---|---|---|---|
| Doxil/Caelyx (PEGylated liposomal doxorubicin) | Ovarian cancer, KS, MM | Liposome (~100 nm) | PEG2000-DSPE conjugate | 1995 (US) |
| Onivyde (PEGylated liposomal irinotecan) | Pancreatic cancer (metastatic) | Liposome (~110 nm) | PEG2000-DSPE conjugate | 2015 (US) |
| PegIntron (PEG-interferon alfa-2b) | Hepatitis C | Protein (interferon) | Linear PEG (12 kDa) | 2001 (US) |
| Plegridy (PEG-interferon beta-1a) | Multiple sclerosis | Protein (interferon) | Linear PEG (20 kDa) | 2014 (US) |
| Macugen (pegaptanib) | Neovascular AMD | Aptamer (RNA) | Branched PEG (40 kDa) | 2004 (US) |
| Adynovate (PEGylated antihemophilic factor) | Hemophilia A | Protein (Factor VIII) | PEGylation site-specific | 2015 (US) |
Pipeline PEGylated Nanotherapeutics in Clinical Trials
Table 2: Select Pipeline PEGylated Nanotherapeutics in Active Development
| Candidate Name / Code | Indication | Phase (Latest) | Nanocarrier Type | Notable PEG Strategy |
|---|---|---|---|---|
| BNT114 | Immunotherapy (Cancer) | Phase I | RNA-lipoplex | PEG-lipid for LNPs |
| STP705 (Cemdisiran) | Primary IgA Nephropathy | Phase III | siRNA-GalNAc conjugate | Branched PEG linker |
| ARO-APOC3 | Hypertriglyceridemia | Phase III | siRNA conjugate | GalNAc-PEG scaffold |
| MK-2060 | End-stage renal disease | Phase II | Bispecific antibody fragment | Site-specific PEGylation (40 kDa) |
| Fidanacogene elaparvovec (PF-07055480) | Hemophilia B | Phase III (Pending BLA) | AAV vector | Formulation with PEG additives |
Key Experimental Protocols
Protocol 1: Assessing PEG Conjugation Density and Stability
Objective: To quantify PEG density on nanoparticle surfaces and assess its stability in serum-containing media. Materials: Nanoparticle formulation, SDS-PAGE system, TNBSA or iodine assay kit, fluorescent PEG derivative (optional), ultracentrifuge, spectrophotometer. Procedure:
- Sample Preparation: Dilute PEGylated nanoparticles in PBS (pH 7.4).
- Direct Quantification (Iodine Assay): a. Mix 0.5 mL nanoparticle sample with 1.5 mL iodine reagent (0.05% I2, 0.1% KI in water). b. Incubate 15 min at room temperature, protected from light. c. Measure absorbance at 500 nm. Compare to a standard curve of methoxy-PEG.
- Stability in Serum: Incubate nanoparticles in 50% fetal bovine serum (FBS) at 37°C with gentle shaking. a. Withdraw aliquots at 0, 1, 2, 4, 8, 24h. b. Ultracentrifuge (100,000 x g, 45 min) to pellet nanoparticles. c. Wash pellet with PBS and re-analyze PEG content via iodine assay. Loss indicates PEG cleavage/desorption.
- SDS-PAGE Analysis: Run samples to confirm PEG conjugate size and purity.
Protocol 2: In Vitro Opsonization and Macrophage Uptake Assay
Objective: To evaluate the effect of PEGylation on protein adsorption and subsequent phagocytic uptake. Materials: RAW 264.7 or THP-1 derived macrophages, fluorescently labelled nanoparticles (PEGylated and non-PEGylated), flow cytometer, confocal microscopy, opsonizing medium (90% FBS). Procedure:
- Opsonization: Incubate fluorescent nanoparticles in 90% FBS at 37°C for 1h.
- Cell Seeding: Plate macrophages in 24-well plates at 2x10^5 cells/well. Culture overnight.
- Uptake Assay: Replace medium with fresh serum-free medium containing opsonized nanoparticles (equivalent particle number). Incubate for 2h at 37°C.
- Stop & Wash: Place plates on ice. Wash cells 3x with ice-cold PBS to remove non-internalized particles.
- Analysis: a. Flow Cytometry: Trypsinize cells, resuspend in PBS, and analyze median fluorescence intensity (MFI). b. Confocal Microscopy: Fix cells with 4% PFA, stain actin/nuclei, and image. Quantify intracellular fluorescence per cell using image analysis software (e.g., ImageJ).
- Data Expression: Normalize MFI of PEGylated nanoparticles to non-PEGylated control. Lower MFI indicates reduced opsonization and uptake.
Protocol 3: Pharmacokinetic and Biodistribution Study in Rodents
Objective: To determine the effect of PEGylation on circulation half-life and tissue distribution. Materials: Mice/rats, fluorescent dye (DiR, Cy7) or radiolabel (e.g., ^111In) tagged nanoparticles, IV injection setup, in vivo imaging system (IVIS) or gamma counter, blood collection supplies. Procedure:
- Animal Preparation: Anesthetize animals (isoflurane). Shave if necessary for imaging.
- Administration: Inject nanoparticles via tail vein (dose: e.g., 5 mg/kg lipid, 100 µL volume).
- Blood Kinetics: a. Collect blood retro-orbitally or from tail vein at pre-determined times (e.g., 2 min, 15 min, 1, 2, 4, 8, 24h). b. Centrifuge to obtain plasma. c. Measure fluorescence/radioactivity in plasma samples. Plot concentration vs. time. d. Calculate PK parameters (t½α, t½β, AUC) using non-compartmental analysis.
- Biodistribution: At terminal time points (e.g., 24h and 7 days), euthanize animals, harvest organs (liver, spleen, kidneys, heart, lungs, tumor). Image ex vivo or homogenize tissues for quantitative analysis.
- Data Expression: Express as % injected dose per gram of tissue (%ID/g). Compare PEGylated vs. non-PEGylated nanoparticle accumulation, particularly in liver and spleen (MPS organs).
Diagrams
Diagram Title: PEGylation Mechanism to Reduce Opsonization and Clearance
Diagram Title: Key Experimental Workflow for PEG-NP Evaluation
The Scientist's Toolkit: Research Reagent Solutions
Table 3: Essential Materials for PEGylated Nanoparticle Research
| Item | Function / Relevance |
|---|---|
| Methoxy-PEG-Succinimidyl Carboxymethyl Ester (mPEG-SCM) | Common amine-reactive PEG reagent for conjugating to proteins or amine-containing ligands on nanoparticle surfaces. |
| DSPE-PEG(2000)-Amine / -Carboxylic Acid | Phospholipid-PEG conjugates for inserting into liposomal membranes, providing a stealth layer and a functional end-group for further coupling. |
| Iodine Reagent (I2/KI Solution) | Used in the classic iodine assay to quantitatively determine PEG concentration via formation of a PEG-iodine complex. |
| TNBSA (2,4,6-Trinitrobenzenesulfonic Acid) | Assays free amine groups; useful for quantifying PEG conjugation efficiency by measuring loss of surface amines. |
| Fluorescent PEG Derivatives (e.g., FITC-PEG-NHS, Cy5-PEG-Mal) | Enable tracking of PEG localization, conjugation efficiency, and nanoparticle fate in vitro and in vivo via fluorescence. |
| Pre-formed Gradient Lipid Nanoparticles (LNPs) | Commercial, customizable LNP kits (e.g., from Precision NanoSystems) that include PEG-lipids for formulating RNA/DNA therapeutics. |
| Size Exclusion Chromatography (SEC) Columns (e.g., Sepharose CL-4B, Sephacryl S-500) | For purifying PEGylated nanoparticles from free PEG or unreacted precursors based on hydrodynamic size. |
| Anti-PEG Antibodies (e.g., Mouse Anti-PEG IgM/IgG) | Critical for detecting and quantifying the potential anti-PEG immune response, a key translational hurdle. |
| DLS/Zetasizer Instrument | Measures hydrodynamic diameter (size), polydispersity index (PDI), and zeta potential (surface charge) of PEGylated NPs. |
| THP-1 Cell Line (Human Monocyte) | Can be differentiated into macrophage-like cells for standardized in vitro phagocytosis and immunogenicity assays. |
Conclusion
PEGylation remains a dominant and effective strategy to engineer stealth into nanoparticles, fundamentally addressing the critical barriers of opsonization and rapid clearance. The successful implementation requires a nuanced understanding of its foundational principles, meticulous optimization of conjugation chemistry and polymer architecture, and proactive troubleshooting of immune responses like the ABC phenomenon. While PEG sets a high benchmark, the emergence of next-generation stealth polymers presents promising alternatives for specific applications. Future directions in nanomedicine will likely involve hybrid coatings, stimuli-responsive PEG shedding, and personalized approaches to mitigate immune recognition, all aimed at maximizing therapeutic index and clinical success. Continued innovation in this field is essential for realizing the full potential of targeted, systemic nanotherapies.