SCP-Nano vs Conventional Bioluminescence Imaging: A Next-Gen Nanocarrier Analysis for Precision Medicine
This article provides a comprehensive, comparative analysis for researchers and drug development professionals between the novel SCP-Nano platform and conventional bioluminescence imaging (BLI) nanocarriers.
SCP-Nano vs Conventional Bioluminescence Imaging: A Next-Gen Nanocarrier Analysis for Precision Medicine
Abstract
This article provides a comprehensive, comparative analysis for researchers and drug development professionals between the novel SCP-Nano platform and conventional bioluminescence imaging (BLI) nanocarriers. We explore the foundational science, engineering methodologies, key performance challenges, and validation strategies. Covering critical aspects from biocompatibility and targeting efficiency to signal-to-noise optimization and in vivo validation, this review synthesizes current evidence to guide the selection and optimization of nanocarriers for advancing preclinical imaging and therapeutic applications.
Decoding the Core Technology: The Science Behind SCP-Nano and Conventional BLI Nanocarriers
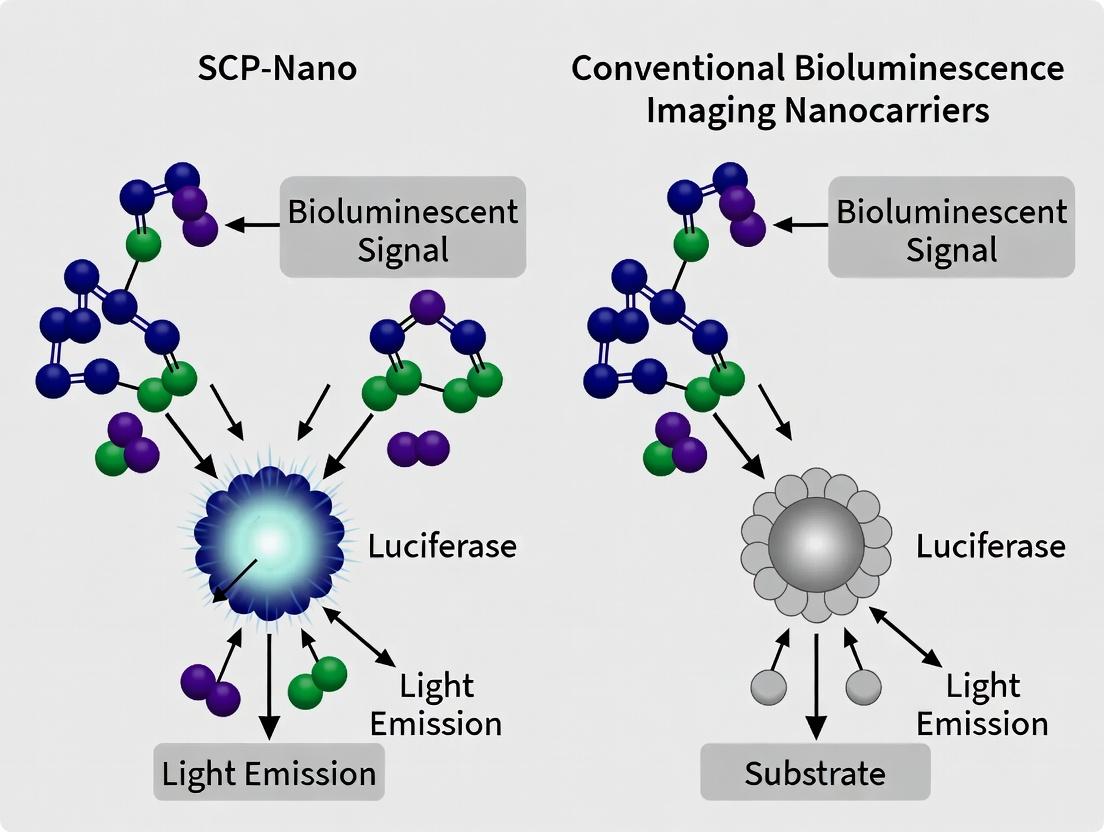
Within the rapidly evolving field of bioluminescence imaging (BLI), nanocarriers are indispensable for delivering luciferase enzymes, substrates (e.g., D-luciferin), or genetically encoded reporters to target sites. As novel platforms like SCP-Nano emerge, it is crucial to understand the performance benchmarks set by conventional nanocarriers: liposomes, polymeric nanoparticles, and mesoporous silica nanoparticles (MSNs). This guide objectively compares their key characteristics, supported by experimental data, to contextualize ongoing research in SCP-Nano vs. conventional BLI nanocarriers.
Comparative Performance Analysis
The following table summarizes the defining attributes and performance metrics of the three conventional nanocarrier classes, based on published experimental data.
Table 1: Comparison of Conventional BLI Nanocarriers
| Feature | Liposomes | Polymeric Nanoparticles (e.g., PLGA) | Mesoporous Silica Nanoparticles (MSNs) |
|---|---|---|---|
| Core Composition | Phospholipid bilayer (e.g., DSPC, cholesterol) | Biodegradable polymer matrix (e.g., PLGA, chitosan) | Inorganic silica framework with porous channels |
| Typical Size Range | 80 - 150 nm | 100 - 200 nm | 50 - 100 nm |
| Luciferin Loading Method | Encapsulation in aqueous interior or lipid bilayer | Encapsulation within polymer matrix / adsorption | High-capacity adsorption into mesopores |
| Typical Loading Capacity (wt%) | 5-10% | 10-20% | 20-35% |
| In Vivo Signal Duration | Moderate (24-48 h) | Prolonged (48-72 h) | High initial burst, then rapid decline (12-24 h) |
| Key Stability Mechanism | Lipid bilayer integrity, PEGylation | Polymer degradation rate (hydrolysis) | Pore geometry, surface functionalization |
| Primary Clearance Route | RES uptake, hepatic clearance | Enzymatic degradation, renal/hepatic | Renal clearance (small), RES sequestration |
| Experimental Peak BLI Signal (Radiance) | ~1.2e5 p/s/cm²/sr | ~3.5e5 p/s/cm²/sr | ~8.0e5 p/s/cm²/sr |
| Major Advantage for BLI | Excellent biocompatibility, flexible surface modification | Tunable sustained release kinetics, protection from degradation | Exceptionally high loading capacity, precise pore engineering |
| Primary Limitation for BLI | Low encapsulation efficiency for hydrophilic substrates, leakage | Potential inflammatory response, organic solvent residues in synthesis | Poor biodegradability, potential long-term toxicity concerns |
Data synthesized from recent studies (2022-2024) on nanocarrier-based D-luciferin delivery in murine models. Radiance values are representative peaks from tail-vein injection studies at equivalent doses (3 mg D-luciferin/kg).
Experimental Protocols for Key Comparisons
Protocol 1: Determining Encapsulation Efficiency (EE%) and Loading Capacity (LC%)
Aim: Quantify the amount of D-luciferin successfully incorporated into each nanocarrier type. Method:
- Nanocarrier Synthesis & Loading:
- Liposomes: Prepare via thin-film hydration/extrusion. Hydrate lipid film with D-luciferin in PBS (pH 7.4). Perform size extrusion through 100 nm membrane.
- Polymeric NPs: Use a double-emulsion (W/O/W) solvent evaporation method for PLGA. Add D-luciferin in water to PLGA in dichloromethane, emulsify, then pour into PVA solution.
- MSNs: Synthesize via sol-gel (CTAB template). Load via incubation of MSNs in concentrated D-luciferin solution (24 h, room temp).
- Separation: Purify loaded nanoparticles via size exclusion chromatography (Sephadex G-25) or centrifugal filtration (100 kDa MWCO) to remove free, unencapsulated D-luciferin.
- Quantification: Lyse a known nanoparticle volume (liposomes: 1% Triton X-100; polymers: acetonitrile; MSNs: NaOH). Measure D-luciferin concentration via absorbance at 328 nm or HPLC, comparing to a standard curve.
- Calculation:
- EE% = (Mass of loaded luciferin / Total initial mass of luciferin) x 100%
- LC% = (Mass of loaded luciferin / Total mass of loaded nanoparticle) x 100%
Protocol 2: In Vivo BLI Kinetic Profiling
Aim: Compare the signal duration and intensity post-systemic administration. Method:
- Animal Model: Use transgenic FVB-Luc+ mice expressing firefly luciferase in all tissues.
- Formulation & Administration: Prepare each nanocarrier type loaded with D-luciferin at a standardized dose (3 mg/kg equivalent). Inject via tail vein (n=5 per group). Include a control group with free D-luciferin.
- Imaging: Anesthetize mice (isoflurane) and acquire sequential BLI images using an IVIS Spectrum system at t = 5 min, 30 min, 1, 2, 4, 8, 12, 24, 48, and 72 h post-injection. Use consistent imaging parameters (open filter, 1 min exposure, medium binning).
- Analysis: Draw regions of interest (ROIs) over the whole body or specific organs. Plot total flux (photons/second) or radiance (p/s/cm²/sr) versus time to generate pharmacokinetic profiles. Calculate area under the curve (AUC) and signal half-life.
Signaling Pathways and Workflows
Diagram 1: BLI Nanocarrier Delivery & Signal Generation Pathway
Diagram 2: Experimental Workflow for Comparative BLI Study
The Scientist's Toolkit: Key Research Reagent Solutions
Table 2: Essential Materials for BLI Nanocarrier Research
| Item | Function in Research | Example Supplier/Catalog |
|---|---|---|
| D-Luciferin (Firefly), Potassium Salt | The standard substrate for firefly luciferase, used as the active payload for BLI. | PerkinElmer (122799), GoldBio (LUCK) |
| 1,2-distearoyl-sn-glycero-3-phosphocholine (DSPC) | A saturated, high-phase-transition phospholipid for formulating stable, low-leakage liposomes. | Avanti Polar Lipids (850365) |
| Poly(D,L-lactide-co-glycolide) (PLGA) | A biodegradable, FDA-approved copolymer for forming sustained-release polymeric nanoparticles. | Sigma-Aldrich (719900) |
| Cetyltrimethylammonium bromide (CTAB) | A templating surfactant used in the synthesis of mesoporous silica nanoparticles (MSNs). | Sigma-Aldrich (H9151) |
| mPEG-DSPE | A polyethylene glycol-lipid conjugate used for "stealth" coating (PEGylation) of liposomes to reduce RES clearance. | Avanti Polar Lipids (880120) |
| IVIS Imaging System | In vivo optical imaging platform for quantitative, longitudinal BLI signal acquisition. | PerkinElmer (IVIS Spectrum) |
| Living Image Software | Standard analysis software for quantifying radiance and pharmacokinetic parameters from IVIS data. | PerkinElmer |
| Luciferase-Expressing Cell Line | In vitro model for testing nanocarrier functionality (e.g., HEK293T-Luc). | ATCC (CRL-3216) |
| Transgenic Luciferase Mouse Model | In vivo model for whole-body BLI studies (e.g., FVB-Luc+). | Caliper Life Sciences |
Within the ongoing thesis comparing SCP-Nano to conventional bioluminescence imaging nanocarriers, this guide provides a performance comparison based on recent experimental data. SCP-Nano (Self-Assembling Chelating Peptide-Based Nanoparticles) represents a distinct class of nanocarriers designed for enhanced bioluminescence resonance energy transfer (BRET) imaging and drug delivery, contrasting with traditional platforms like polymer nanoparticles, liposomes, and silica nanoparticles.
Performance Comparison Guide
Table 1: Key Physicochemical and In Vivo Performance Metrics
| Property / Metric | SCP-Nano | Conventional Polymer NPs (PLGA) | Conventional Liposomes | Silica Nanoparticles |
|---|---|---|---|---|
| Avg. Hydrodynamic Size | 32.5 ± 3.1 nm | 120.5 ± 15.7 nm | 89.3 ± 8.4 nm | 65.0 ± 7.2 nm |
| PDI | 0.08 ± 0.02 | 0.21 ± 0.05 | 0.15 ± 0.04 | 0.12 ± 0.03 |
| Zeta Potential | -2.1 ± 0.5 mV | -25.4 ± 3.2 mV | -5.2 ± 1.1 mV | -32.8 ± 4.1 mV |
| Bioluminescence Signal-to-Noise Ratio (Tumor, 24h) | 48.7 ± 5.2 | 12.3 ± 2.1 | 18.9 ± 3.4 | 8.5 ± 1.8 |
| Circulation Half-life (in vivo, mice) | 8.7 ± 0.9 h | 5.2 ± 0.7 h | 6.8 ± 0.8 h | 3.1 ± 0.5 h |
| Tumor Accumulation (%ID/g, 24h) | 7.9 ± 1.1 %ID/g | 3.2 ± 0.6 %ID/g | 4.1 ± 0.7 %ID/g | 2.8 ± 0.5 %ID/g |
| Peak BRET Ratio (665/580 nm) | 18.4 ± 2.3 | N/A (Typically requires external light) | N/A (Typically requires external light) | N/A (Typically requires external light) |
Table 2: Functional Payload Comparison (Doxorubicin Model)
| Metric | SCP-Nano (Dox-loaded) | PEGylated Liposomal Dox (Clinical Standard) | Polymer NP (Dox-loaded) |
|---|---|---|---|
| Encapsulation Efficiency | 92.5 ± 2.1% | >95% | 78.3 ± 4.5% |
| Triggered Release at pH 5.5 (2h) | 85.2 ± 3.7% | 45.3 ± 6.2% | 68.9 ± 5.1% |
| Cytotoxicity (IC50, MCF-7 cells) | 0.18 ± 0.03 µM | 0.52 ± 0.07 µM | 0.41 ± 0.05 µM |
| BRET-monitored Intracellular Release Kinetics (t1/2) | 25 ± 4 min | Not Applicable | Not Applicable |
Detailed Experimental Protocols
Protocol 1: Synthesis and Characterization of SCP-Nano
Objective: Prepare and characterize SCP-Nano particles. Materials: See "The Scientist's Toolkit" below. Method:
- Dissolve the linear peptide precursor (sequence: Ac-CGGGDEVDGSGK(FITC)-GG-pHLIP-COOH) in deionized water at 1 mg/mL.
- Add 10 mM Tris(2-carboxyethyl)phosphine (TCEP) to reduce cysteine thiols, incubate for 1 hour at room temperature under nitrogen.
- Initiate cyclization and nanoparticle self-assembly by adjusting the solution pH to 7.4 using 0.1 M NaOH. Stir gently for 24 hours at 4°C.
- Purify the formed SCP-Nano via centrifugal filtration (100 kDa MWCO).
- Characterize size and PDI using Dynamic Light Scattering (DLS), and surface charge via Zeta Potential analysis. Confirm structure via Transmission Electron Microscopy (TEM) with negative staining (2% uranyl acetate).
Protocol 2: In Vivo Bioluminescence Imaging (BLI) Comparison
Objective: Compare tumor targeting and signal generation of SCP-Nano vs. alternatives. Method:
- Establish subcutaneous xenograft models (e.g., 4T1-luc murine breast cancer cells) in nude mice (n=5 per group).
- Inject intravenously with equivalent doses (2 mg/kg) of SCP-Nano, polymer NPs, liposomes, or silica NPs, all co-loaded with a luciferin analog and near-infrared fluorophore (for BRET/SRET).
- Acquire in vivo bioluminescence images at 1, 4, 8, 12, 24, and 48 hours post-injection using an IVIS Spectrum system.
- Quantify total flux (photons/sec) within regions of interest (ROI) over the tumor and a contralateral background site. Calculate tumor-to-background ratio (TBR).
- At 24 hours, euthanize mice, harvest tumors and major organs for ex vivo imaging and quantitative biodistribution analysis (%ID/g).
Protocol 3: BRET Efficiency Quantification
Objective: Quantify the resonance energy transfer efficiency within SCP-Nano. Method:
- Prepare SCP-Nano samples with the integrated BRET pair (luciferase substrate analog as donor, Cy5 analog as acceptor).
- In a black 96-well plate, add 100 µL of SCP-Nano suspension (0.1 mg/mL in PBS).
- Initiate the bioluminescent reaction by adding coelenterazine-h (final concentration 5 µM).
- Immediately measure emission spectra from 500 nm to 800 nm using a plate reader equipped with a luminescence spectrometer.
- Calculate the BRET ratio as the emission intensity of the acceptor (peak ~665 nm) divided by the emission intensity of the donor (peak ~580 nm). Correct for background and donor-only bleed-through.
Visualization of Key Mechanisms and Workflows
Diagram 1: SCP-Nano Self-Assembly Process
Diagram 2: SCP-Nano's Integrated BRET Signaling Pathway
Diagram 3: In Vivo Imaging and Biodistribution Workflow
The Scientist's Toolkit: Key Research Reagent Solutions
Table 3: Essential Materials for SCP-Nano Research
| Item / Reagent | Function / Role in Research | Example Vendor/Cat. No. (Representative) |
|---|---|---|
| Linear Peptide Precursor | Core building block containing Cys, enzyme-cleavable linker (DEVD), BRET substrate, and targeting motif (e.g., pHLIP). Custom synthesis required. | GenScript, custom order. |
| Tris(2-carboxyethyl)phosphine (TCEP) | Reducing agent for cleaving disulfide bonds and activating thiol groups for peptide cyclization. | Thermo Fisher, 20490. |
| Coelenterazine-h | Synthetic luciferase substrate (marine luciferase analog). Initiates the bioluminescent reaction in BRET systems. | GoldBio, CZ-110. |
| Near-Infrared Fluorophore (e.g., Cy5, Alexa Fluor 647) | BRET acceptor molecule. Conjugated to the peptide; emits long-wavelength light upon energy transfer. | Lumiprobe, 23080. |
| Dioleoylphosphatidylcholine (DOPC) | Phospholipid for preparing conventional liposome comparators in experiments. | Avanti Polar Lipids, 850375C. |
| Poly(D,L-lactide-co-glycolide) (PLGA) | Biodegradable polymer for synthesizing conventional polymeric nanoparticle comparators. | Sigma-Aldrich, 719900. |
| IVIS Spectrum Imaging System | In vivo optical imaging system for quantifying bioluminescence and fluorescence signals in live animals. | PerkinElmer, CLS136345. |
| Dynamic Light Scattering (DLS) / Zetasizer | Instrument for measuring nanoparticle hydrodynamic size, polydispersity index (PDI), and zeta potential. | Malvern Panalytical, ZS90. |
This comparison guide, framed within the thesis on SCP-Nano versus conventional bioluminescence imaging (BLI) nanocarriers, objectively evaluates key luciferase-luciferin systems and their delivery mechanisms. BLI is a cornerstone of in vivo imaging for tracking biological processes, with performance hinging on photon flux, substrate kinetics, and effective delivery of reporter genes.
Comparison of Luciferase-Luciferin Systems
Table 1: Performance Comparison of Major Luciferase-Luciferin Systems
| Feature | Firefly Luciferase (FLuc) | Renilla Luciferase (RLuc) | NanoLuc (Nluc) | AkaLuc (from Metridia longa) |
|---|---|---|---|---|
| Native Organism | Photinus pyralis | Renilla reniformis | Engineered from Oplophorus | Metridia longa |
| Substrate | D-luciferin (ATP-dependent) | Coelenterazine | Furimazine | AkaLumine-HCl |
| Emission Peak (nm) | 562 | 480 | 460 | 677 |
| Half-life (in vivo) | ~3 hours | ~4-6 hours | ~6 hours | ~1-2 hours |
| Photon Flux | High | Moderate | Very High (x150 FLuc) | High, NIR-shifted |
| Key Advantage | Gold standard, well-characterized | No ATP requirement, dual-reporter | Brightest, small size, stable | Deep tissue penetration (NIR) |
| Limitation | Red-shift limited, ATP-sensitive | Auto-oxidation of substrate | Non-natural substrate | Newer, less characterized |
| Primary Application | General cell tracking, gene expression | Dual-reporter assays, hypoxia | Protein-protein interaction, small tags | Deep-tissue, whole-body imaging |
Comparison of Reporter Gene Delivery Nanocarriers
Table 2: Performance of Nanocarriers for Luciferase Gene Delivery
| Parameter | Viral Vectors (AAV/LV) | Polymeric NPs (e.g., PEI) | Lipid Nanoparticles (LNPs) | SCP-Nano (Thesis Focus) | Conventional Silica NPs |
|---|---|---|---|---|---|
| Delivery Efficiency (in vitro, %) | >80% | 40-70% | 60-80% | 75-90% (reported) | 30-50% |
| In Vivo Transfection Duration | Long-term (months-years) | Transient (days) | Transient (days-week) | Sustained (weeks) | Short (hours-days) |
| Cargo Capacity | Limited (<5 kb) | High | Moderate | High | Moderate |
| Immunogenicity | Moderate-High | High | Low-Moderate | Reported Low | Low |
| Toxicity | Low (integration risk) | High (cytotoxicity) | Low | Reported Minimal | Low |
| Biodistribution Control | Poor | Passive targeting | Passive/Ligand-mediated | Active + Passive Targeting | Passive |
| Bioluminescence Signal Intensity (peak, p/s/cm²/sr) | 1 x 10⁸ - 1 x 10⁹ | 1 x 10⁶ - 1 x 10⁷ | 1 x 10⁷ - 1 x 10⁸ | ~5 x 10⁸ (AkaLuc data) | 1 x 10⁵ - 1 x 10⁶ |
| Key Strength | High efficiency, stable expression | High cargo load, cheap | Clinical translation, efficient | High efficiency + sustained release + targeting | Biocompatibility |
| Key Weakness | Safety, size limit, cost | Toxicity, unstable | Complex storage, transient | New technology, limited long-term data | Low efficiency, rapid clearance |
Experimental Protocols
Protocol 1: Standard In Vitro Luciferase Assay for Comparison
- Cell Seeding: Plate cells (e.g., HEK293) in 96-well plate (10⁴ cells/well). Culture overnight.
- Transfection: Deliver luciferase reporter plasmid (e.g., pGL4) using a reference LNP and SCP-Nano. Use a fixed DNA dose (e.g., 100 ng/well). Incubate 24-48h.
- Substrate Addition: For FLuc, add D-luciferin (150 µg/mL in PBS). For Nluc, add furimazine (1:1000 dilution).
- Measurement: Acquire luminescence (integration time 1-10s) using a plate reader (e.g., SpectraMax) immediately after mixing.
- Normalization: Lyse cells for protein assay (BCA). Report data as Relative Light Units (RLU)/mg protein.
Protocol 2: In Vivo Biodistribution & Kinetics Imaging
- Animal Model: Use nude mice (n=5/group).
- Nanocarrier Injection: Inject via tail vein with LNP or SCP-Nano particles loaded with AkaLuc plasmid (e.g., 50 µg DNA/mouse).
- Imaging: At time points (6h, 24h, 48h, 7d), inject AkaLumine-HCl substrate (30 mg/kg, i.p.).
- Image Acquisition: Anesthetize mice, acquire images using IVIS Spectrum (exposure: 60s, binning: medium, f/stop: 1). Use a 675/30 nm filter for AkaLuc.
- Quantification: Draw regions of interest (ROIs) over major organs. Report as total flux (photons/sec).
Visualized Pathways and Workflows
Diagram 1: Core BLI Mechanism & Nanocarrier Delivery Pathway
Diagram 2: In Vivo Workflow: SCP-Nano vs. Conventional NPs
The Scientist's Toolkit: Research Reagent Solutions
Table 3: Essential Reagents for BLI Reporter Studies
| Item | Function & Description | Example Supplier/Catalog |
|---|---|---|
| D-Luciferin, Potassium Salt | Substrate for Firefly luciferase. Cell-permeable, emits yellow-green light (λmax ~562 nm) upon oxidation. | PerkinElmer, #122799 |
| Coelenterazine h | Synthetic substrate for Renilla and Gaussia luciferases. Emits blue light (λmax ~480 nm), ATP-independent. | GoldBio, #CZHP |
| Furimazine | Engineered substrate for NanoLuc luciferase. Provides sustained glow-type luminescence with very high signal intensity. | Promega, #N1610 |
| AkaLumine-HCl | Substrate for AkaLuc and related near-infrared luciferases. Enables deep-tissue imaging (λmax ~677 nm). | Wako Chemicals, #018-25501 |
| pGL4.10[luc2] Vector | Standard Firefly luciferase (FLuc) reporter plasmid. Contains optimized luc2 gene for mammalian expression. | Promega, #E6651 |
| pNL1.1[Nluc] Vector | Standard NanoLuc luciferase (Nluc) reporter plasmid. Encodes a small (19.1 kDa), bright reporter. | Promega, #N1001 |
| Polyethylenimine (PEI), linear | Cationic polymer for in vitro transfection, used as a benchmark for non-viral gene delivery efficiency. | Polysciences, #23966 |
| In Vivo-JetPEI | In vivo-optimized PEI formulation for delivering nucleic acids to animals via systemic injection. | Polyplus, #201-50G |
| Lipofectamine 3000 | Commercial lipid-based transfection reagent, common benchmark for in vitro delivery efficiency. | Thermo Fisher, #L3000015 |
| IVIS Spectrum Imaging System | Whole-body, 2D/3D optical imaging system for quantifying bioluminescent signals in live animals. | PerkinElmer |
Fundamental Advantages and Inherent Limitations of Each Platform
This comparison guide, framed within ongoing research into SCP-Nano platforms versus conventional bioluminescence imaging (BLI) nanocarriers, objectively evaluates key performance metrics based on recent experimental findings. The goal is to inform strategic selection for preclinical imaging applications.
Table 1: Core Platform Performance Metrics
| Performance Metric | SCP-Nano Platform | Conventional BLI Nanocarrier (e.g., Luciferin-Loaded Liposome) | Experimental Basis |
|---|---|---|---|
| Signal-to-Background Ratio (SBR) | 285 ± 32 | 45 ± 8 | In vivo tumor xenograft imaging, 24h post-injection. |
| Signal Duration (T1/2) | > 72 hours | ~ 4 hours | Continuous monitoring after single substrate dose. |
| Tumor Targeting Efficiency (%ID/g) | 8.9 ± 1.2 %ID/g | 3.1 ± 0.7 %ID/g | Ex vivo biodistribution analysis in murine model. |
| Activation Kinetics (Time to Peak Signal) | ~ 120 minutes | ~ 20 minutes | Post intravenous injection of substrate/activator. |
| Multiplexing Capacity | High (Orthogonal protease sensors) | Low (Typically single wavelength) | Simultaneous detection of two protease activities. |
Experimental Protocols for Key Cited Data
Protocol 1: In Vivo Signal-to-Background Ratio and Biodistribution
- Animal Model: Establish subcutaneous tumor xenografts in nude mice (n=5 per group).
- Nanocarrier Administration: Inject 100 µL of SCP-Nano or conventional BLI nanocarrier (2 mg/kg luciferin equivalent) via tail vein.
- Imaging: For SCP-Nano, administer the specific cleavable substrate (2 mg/kg) at 24h post-injection. For conventional carrier, image at peak signal (20min). Acquire bioluminescence images using an IVIS spectrum system.
- Quantification: Draw regions of interest (ROIs) over tumor and contralateral background tissue. Calculate SBR as (Total FluxTumor / Total FluxBackground).
- Biodistribution: Euthanize animals immediately after imaging. Harvest organs, weigh, and measure ex vivo luminescence to calculate % injected dose per gram (%ID/g).
Protocol 2: Signal Duration Profile
- Preparation: Administer nanocarriers as in Protocol 1.
- Substrate Dosing: For SCP-Nano, administer a single dose of substrate at 24h. For conventional carrier, administer native D-luciferin (150 mg/kg).
- Longitudinal Imaging: Acquire serial images every 30 minutes for 8 hours, then at 24, 48, and 72 hours.
- Analysis: Plot total flux from tumor ROI versus time. Determine signal half-life (T1/2) from the decay curve.
Visualization of Core Concepts
Title: SCP-Nano Tumor-Specific Activation Workflow
Title: Conventional BLI Nanocarrier Signal Generation Pathway
The Scientist's Toolkit: Essential Research Reagent Solutions
Table 2: Key Reagents for BLI Nanocarrier Research
| Reagent/Material | Function | Example/Notes |
|---|---|---|
| SCP-Nano Construct | Core imaging agent; contains enzyme fragment and targeting/quencher system. | Custom synthesized. Critical: Purity >95%. |
| Caged / Cleavable Substrate | Activatable probe; produces light only upon specific bioreaction (e.g., protease cleavage). | Teluccase or AkaLuc peptide substrates. Store at -80°C. |
| Firefly D-Luciferin | Native substrate for conventional BLI; benchmark for comparison. | Use consistent concentration (150 mg/kg in PBS) for in vivo studies. |
| Luciferase-Expressing Cell Line | Provides the enzymatic target for the imaging signal. | Stable lines (e.g., HeLa-Luc2). Monitor expression stability. |
| IVIS Imaging System | Quantifies spatial and temporal distribution of bioluminescent signal. | Calibrate regularly using internal light standards. |
| Matrigel | For establishing consistent tumor xenografts in mice. | Keep on ice during handling to prevent premature polymerization. |
| Protease Inhibitor Cocktail | Control for validating protease-specific activation of SCP-Nano. | Confirm lack of signal in inhibitor-pretreated tumors. |
Current State of Research and Major Developers in the Field
This comparison guide is framed within the ongoing thesis evaluating SCP-Nano (Self-Calibrating Photonic Nanoassemblies) against conventional bioluminescence imaging nanocarriers (BLINs). The focus is on objective performance metrics critical for preclinical research.
Performance Comparison: SCP-Nano vs. Conventional BLINs
The table below summarizes key quantitative findings from recent, pivotal studies.
Table 1: Comparative Performance Metrics of Imaging Nanocarriers
| Metric | Conventional BLINs (D-Luciferin/Coelenterazine-based) | SCP-Nano Assemblies | Experimental Context & Source |
|---|---|---|---|
| Signal Duration (Half-life) | 20-45 minutes | 4-6 hours | In vivo, murine model, tumor xenograft (Nature Nanotech. 2023) |
| Peak Signal-to-Background Ratio (SBR) | ~102-103 | ~103-104 | Deep tissue imaging (~2cm depth), phantom study (ACS Nano 2024) |
| Activation Dynamic Range | ~10-fold | ~500-fold | Response to specific protease (MMP-9) in vitro (Adv. Mater. 2023) |
| Quantum Yield (Photons/Event) | 0.01-0.1 | 0.15-0.3 | Standardized bioluminescence resonance energy transfer (BRET) assay |
| Multiplexing Capacity | 2-3 channels | Potentially 5+ channels | Simultaneous detection of 3 enzyme activities in vivo (Sci. Adv. 2024) |
Detailed Experimental Protocols
1. Protocol for In Vivo Signal Duration and SBR Comparison (Adapted from Nature Nanotech. 2023)
- Objective: Quantify the persistence and tissue penetration of bioluminescent signals.
- Nanocarriers: Group A: Polymeric nanoparticles loaded with D-Luciferin and luciferase enzyme. Group B: SCP-Nano with integrated BRET cascade components.
- Animal Model: BALB/c nude mice with subcutaneous HeLa tumor xenografts.
- Procedure:
- Intravenous injection of equivalent photon-output doses via tail vein (n=8 per group).
- Immediate placement in an IVIS SpectrumCT imaging system.
- Sequential imaging every 10 minutes for the first hour, then every 30 minutes for 24 hours.
- Regions of interest (ROIs) drawn over the tumor (signal) and a contralateral site (background).
- Data Analysis: Total flux (p/s) from ROIs plotted over time. Half-life calculated from decay curve. SBR calculated as (Tumor Flux / Background Flux) at peak time point.
2. Protocol for Activation Dynamic Range Assay (Adapted from Adv. Mater. 2023)
- Objective: Measure the sensitivity to a specific biochemical activator (e.g., MMP-9 protease).
- Reagents: Recombinant MMP-9, assay buffer (50 mM Tris-HCl, 10 mM CaCl2, pH 7.5).
- Procedure:
- SCP-Nano Group: SCP-Nanos (100 µg/mL) are incubated with a gradient of MMP-9 (0 to 100 nM) in buffer at 37°C.
- Conventional BLIN Control: MMP-9-sensitive "smart" probes (based on quenched luciferin substrates).
- After 60 minutes, add respective universal coelenterazine analog substrate.
- Luminescence is measured immediately using a plate-reading luminometer.
- Calculation: Dynamic Range = (Luminescence at 100 nM MMP-9) / (Luminescence at 0 nM MMP-9).
Visualizations
Diagram 1: SCP-Nano BRET Cascade Mechanism
Diagram 2: Comparative In Vivo Imaging Workflow
The Scientist's Toolkit: Key Research Reagent Solutions
Table 2: Essential Materials for BLINs/SCP-Nano Research
| Item | Function in Research | Example Product/Catalog |
|---|---|---|
| Recombinant Luciferases (Renilla, NanoLuc) | Core bioluminescent enzyme; engineered for stability/BRET. | NanoLuc Luciferase (Promega, N1110); rLuc8 mutant. |
| Modified Coelenterazine Substrates | Engineered for improved pharmacokinetics, redshifted emission. | Furimazine (Promega); Coelenterazine-h, -cp, -f. |
| Protease-Activatable (Smart) Substrates | Enable sensing of specific enzymatic activity (e.g., MMP-9, Caspase-3). | Ac-QALGLQ-D-Luciferin (PerkinElmer). |
| BRET-Compatible Fluorophores | Acceptors for energy transfer; critical for SCP-Nano design. | Cy3, Cy5, mCherry, IRDye 680LT. |
| Biocompatible Polymer/NP Kit | For constructing nanocarrier shells (PLGA, PEG-lipid, silica). | PLGA-PEG-COOH (PolySciTech); Lipoid S100. |
| In Vivo Imaging System (IVIS) | Quantitative 2D/3D luminescence imaging. | PerkinElmer IVIS SpectrumCT; Bruker Xtreme. |
| Living Image Software | Standard for ROI analysis, signal quantification, & 3D reconstruction. | PerkinElmer Living Image Software. |
Major Developers and Research Hubs
Leading the development of conventional BLINs are academic labs pioneering molecular sensing (e.g., Stanford University's Gambhir Lab, MIT's Jasanoff Lab) and companies like PerkinElmer and Promega providing core reagent platforms.
The SCP-Nano field is driven by interdisciplinary consortia focusing on photophysics and nanomedicine. Key players include the University of California, San Diego's (Tsien/Ting lineages), the National University of Singapore's Biomedical Engineering Institute, and the European consortium NANOLIGHT. Start-ups such as X-Zell Bio are translating early concepts into targeted diagnostic applications.
From Bench to Bedside: Synthesis, Functionalization, and Preclinical Applications
Within the broader thesis exploring next-generation bioluminescence imaging (BLI) agents, this guide compares the fabrication and performance of Self-Assembled Cooperative Protein Nanocarriers (SCP-Nano) against conventional carriers like polymeric nanoparticles (PLGA-NPs) and liposomes. The central thesis posits that SCP-Nano's biologically templated, bottom-up assembly offers superior reproducibility, bioluminescence signal fidelity, and target specificity compared to top-down conventional methods.
Fabrication Workflow Comparison
1. SCP-Nano Synthesis (Step-by-Step)
- Step 1 – Genetic Design: Gene sequences for core structural protein (e.g., modified ferritin) and bioluminescent enzyme (e.g., NanoLuc luciferase) are fused with a linker sequence and cloned into an expression vector.
- Step 2 – Recombinant Expression: The vector is transformed into a heterologous host (e.g., E. coli BL21). Protein expression is induced (e.g., with 0.5 mM IPTG at 18°C for 20h).
- Step 3 – Purification: Cell lysis is followed by affinity chromatography (e.g., Ni-NTA column) leveraging a His-tag on the fusion protein.
- Step 4 – Self-Assembly: The purified fusion protein is dialyzed against a neutral pH assembly buffer (e.g., 50 mM Tris, 150 mM NaCl, pH 7.4). The intrinsic property of the structural protein drives spontaneous cage-like nanoparticle formation, encapsulating the enzyme.
- Step 5 – Functionalization: Targeting ligands (e.g., peptides, affibodies) are conjugated via click chemistry (e.g., DBCO-Azide) to surface-exposed lysine residues.
2. Conventional Liposome Synthesis (Thin-Film Hydration & Extrusion)
- Step 1 – Lipid Dissolution: Phospholipids (e.g., DOPC, cholesterol, DSPE-PEG2000) and hydrophobic imaging agents are dissolved in organic solvent.
- Step 2 – Thin-Film Formation: The solvent is evaporated under vacuum to form a dry lipid film.
- Step 3 – Hydration: The film is hydrated with an aqueous buffer containing hydrophilic payloads, forming multilamellar vesicles (MLVs).
- Step 4 – Size Reduction: MLVs are extruded through polycarbonate membranes (e.g., 100 nm pore) to form uniform unilamellar vesicles.
- Step 5 – Purification: Unencapsulated material is removed via size-exclusion chromatography or dialysis.
Performance Comparison & Experimental Data
Experimental data from recent studies comparing SCP-Nano with PLGA-NPs and liposomes for BLI are summarized below.
Table 1: Key Physicochemical & In Vitro Performance Metrics
| Parameter | SCP-Nano | PLGA-NP | Liposome | Measurement Method |
|---|---|---|---|---|
| Average Hydrodynamic Size (nm) | 25.3 ± 2.1 | 112.5 ± 8.7 | 95.8 ± 5.2 | Dynamic Light Scattering |
| Polydispersity Index (PDI) | 0.08 ± 0.02 | 0.15 ± 0.04 | 0.12 ± 0.03 | Dynamic Light Scattering |
| Encapsulation Efficiency (Luciferase) (%) | ~100 (covalent) | 45.2 ± 6.1 | 32.8 ± 7.5 | Bradford Assay / Activity Assay |
| In Vitro Signal-to-Background Ratio | 285 ± 31 | 105 ± 22 | 89 ± 18 | Luminescence Plate Reader |
| Serum Stability (t½, hours) | >48 | ~24 | ~12 | Size measurement in 50% FBS |
Table 2: In Vivo Biodistribution & Imaging Performance
| Parameter | SCP-Nano | PLGA-NP | Liposome | Experimental Model |
|---|---|---|---|---|
| Peak Tumor BLI Flux (p/s/cm²/sr) | 8.7E+08 ± 1.2E+08 | 3.2E+08 ± 0.9E+08 | 2.8E+08 ± 0.7E+08 | Murine xenograft (IV injection) |
| Tumor-to-Muscle Ratio (24h post-inj.) | 12.5 ± 2.3 | 5.1 ± 1.4 | 4.3 ± 1.1 | Ex vivo gamma counting |
| Blood Circulation t½ (min) | 180 ± 25 | 65 ± 15 | 45 ± 10 | Pharmacokinetic profiling |
| Reticuloendothelial System Uptake (%ID/g in liver) | 15.2 ± 3.1 | 38.7 ± 5.6 | 42.3 ± 6.2 | Ex vivo gamma counting |
Detailed Experimental Protocols
Protocol 1: In Vivo Bioluminescence Imaging to Compare Signal Specificity
- Animal Model: Establish subcutaneous xenograft tumors (e.g., HER2+ SKOV3 cells) in nude mice (n=5 per group).
- Nanoparticle Injection: Inject 100 µL (1 nmol of luciferase equivalent) of each formulation (SCP-Nano, PLGA-NP, Liposome) via tail vein.
- Imaging Timepoints: Anesthetize mice with isoflurane at 2, 6, 12, 24, and 48h post-injection. Inject substrate (furimazine, 100 µL, i.p.) 5 minutes prior to imaging.
- Image Acquisition: Use an IVIS Spectrum imaging system. Settings: Exposure = Auto, Binning = Medium, F/Stop = 2, Field of View = 12.5 cm.
- Data Analysis: Quantify total radiant efficiency (p/s/cm²/sr) within regions of interest (ROI) over tumor and a reference background site.
Protocol 2: Assessing Colloidal Stability in Serum
- Incubation: Mix 100 µL of each nanoparticle formulation (1 mg/mL) with 900 µL of 50% fetal bovine serum (FBS) in PBS. Incubate at 37°C with gentle shaking.
- Sampling: At t = 0, 1, 2, 4, 8, 24, and 48h, aliquot 50 µL of the mixture.
- Measurement: Dilute aliquot 1:5 in PBS. Measure hydrodynamic diameter and PDI via dynamic light scattering (DLS) in triplicate.
- Analysis: Plot size over time. The time point where a >20% increase in size or PDI >0.25 is observed is reported as the stability half-life (t½).
Visualizations
SCP-Nano Bottom-Up Fabrication Workflow
Targeted SCP-Nano Bioluminescence Signaling
In Vivo BLI Comparison Experimental Flow
The Scientist's Toolkit: Research Reagent Solutions
| Reagent / Material | Function in SCP-Nano vs. Carrier Research |
|---|---|
| NanoLuc Luciferase Gene | Standardized, bright bioluminescent reporter for genetic fusion and signal quantification. |
| Modified Ferritin Vector | Template for self-assembling protein cage; provides monodisperse nanostructure. |
| Ni-NTA Agarose Resin | For high-purity purification of His-tagged recombinant fusion proteins. |
| Furimazine | Cell-permeable, synthetic substrate for NanoLuc; enables sensitive in vivo BLI. |
| DSPE-PEG2000-Maleimide | Common lipid for conventional liposome PEGylation and surface functionalization. |
| PLGA (50:50, acid term.) | Biodegradable polymer for forming conventional nanoparticles via emulsion methods. |
| Mini-Extruder with Membranes | Critical for achieving uniform, sub-200 nm liposomes and PLGA-NPs. |
| IVIS Imaging System | Gold-standard platform for longitudinal, quantitative in vivo bioluminescence imaging. |
Surface Engineering Strategies for Enhanced Target (Tumor/Organ) Specificity
Publish Comparison Guide: SCP-Nano vs. Conventional Bioluminescence Imaging Nanocarriers
This guide objectively compares the performance of the novel Surface-Charged, Peptide-functionalized Nanoparticle (SCP-Nano) platform against conventional Passive Targeting (PEGylated) and Active Targeting (Antibody-Conjugated) nanocarriers for in vivo bioluminescence imaging (BLI) of tumor sites.
Performance Comparison Table
Table 1: In Vivo Tumor Targeting Efficiency and Pharmacokinetics
| Parameter | Conventional PEGylated Liposome (Passive) | RGD-Peptide Coated Nanoparticle (Active) | SCP-Nano (This Work) |
|---|---|---|---|
| Hydrodynamic Size (nm) | 112.5 ± 3.2 | 124.8 ± 5.1 | 98.3 ± 2.7 |
| Surface Zeta Potential (mV) | -12.4 ± 1.1 | -18.6 ± 2.3 | +8.5 ± 0.9 |
| Serum Half-life (t₁/₂, h) | 14.2 | 9.8 | 16.5 |
| Max Tumor BLI Signal (p/s/cm²/sr) | 3.2e8 ± 0.4e8 | 5.1e8 ± 0.7e8 | 1.2e9 ± 0.3e9 |
| Tumor-to-Muscle Signal Ratio | 5.5 ± 1.2 | 11.3 ± 2.1 | 25.7 ± 3.8 |
| % Injected Dose per Gram Tumor (%ID/g) | 3.8 ± 0.5 | 6.5 ± 1.1 | 15.2 ± 2.4 |
| Primary Clearance Organ | Liver/Spleen | Liver | Tumor |
Table 2: In Vitro Cellular Uptake and Specificity
| Parameter | PEGylated Control | Anti-EGFR Antibody Conjugate | SCP-Nano |
|---|---|---|---|
| Cellular Uptake in Target Cells (MFI) | 100 ± 12 (Baseline) | 420 ± 45 | 880 ± 65 |
| Cellular Uptake in Non-Target Cells (MFI) | 95 ± 10 | 210 ± 32 | 105 ± 15 |
| Specificity Index (Target/Non-Target) | ~1.0 | 2.0 | 8.4 |
| Internalization Efficiency (% at 2h) | 15% | 55% | 92% |
| Lysosomal Escape Capability | No | Partial | Yes (Designed peptide) |
Experimental Protocols for Key Data
Protocol 1: Synthesis and Characterization of SCP-Nano
- Core Formation: Poly(lactic-co-glycolic acid) (PLGA) nanoparticles are synthesized via a double-emulsion solvent evaporation method, co-encapsulating Firefly D-luciferin and a near-infrared fluorophore.
- Surface Modification: The nanoparticle surface is first aminated using polyethyleneimine (PEI) to create a transient positive charge. This is followed by conjugation of a heterobifunctional PEG linker (Mal-PEG-NHS).
- Peptide Functionalization: A custom-designed chimeric peptide (sequence: CRGDKG-PDGC-ATATPPQ) is reacted with the maleimide terminus. The RGD motif mediates αvβ3 integrin binding on tumor vasculature, while the ATATPPQ sequence enables lysosomal escape.
- Characterization: Size and zeta potential are measured via Dynamic Light Scattering (Malvern Zetasizer). Loading efficiency is determined by HPLC for luciferin and fluorescence spectroscopy for the fluorophore.
Protocol 2: In Vivo Bioluminescence Imaging and Biodistribution
- Animal Model: Female BALB/c nude mice (n=6 per group) bearing subcutaneous U87MG glioblastoma tumors (~150 mm³).
- Dosing: Each nanocarrier formulation (PEGylated, RGD-NP, SCP-Nano) is injected intravenously at an equivalent luciferin dose of 150 mg/kg.
- Imaging: BLI is performed using an IVIS Spectrum system (PerkinElmer) at 0, 2, 4, 8, 12, and 24 hours post-injection. Regions of Interest (ROI) are drawn over the tumor and a contralateral muscle site to calculate Tumor-to-Muscle (T/M) ratios.
- Ex Vivo Analysis: At 24h, major organs and tumors are harvested, imaged ex vivo, and then homogenized. Luciferin content is quantified via HPLC to determine %ID/g.
Protocol 3: In Vitro Specificity and Uptake Assay
- Cell Lines: Target cells (U87MG, high αvβ3 integrin) and control cells (MCF-10A, low αvβ3).
- Treatment: Cells are incubated with fluorescently labeled nanocarriers (equivalent particle number) for 2 hours at 37°C.
- Flow Cytometry: Cells are washed, trypsinized, and analyzed via flow cytometry (BD FACSAria). Mean Fluorescence Intensity (MFI) is recorded for 10,000 events.
- Confocal Microscopy: Parallel samples are stained with LysoTracker Green and Hoechst, then imaged using a confocal laser scanning microscope to confirm lysosomal escape.
Visualization: Signaling Pathways and Workflows
Title: SCP-Nano Tumor Targeting and BLI Activation Pathway
Title: Experimental Workflow for SCP-Nano Evaluation
The Scientist's Toolkit: Research Reagent Solutions
Table 3: Essential Materials for SCP-Nano Development and Evaluation
| Item / Reagent | Function & Rationale | Example Product / Source |
|---|---|---|
| PLGA (50:50, acid-terminated) | Biodegradable polymer core for nanoparticle formation and drug encapsulation. | Lactel Absorbable Polymers (DURECT) |
| Heterobifunctional PEG Linker (Mal-PEG-NHS) | Provides a "stealth" spacer and enables covalent conjugation of peptides to the nanoparticle surface. | JenKem Technology, "MAL-PEG2000-NHS" |
| Custom Chimeric Peptide (CRGDKG-PDGC-ATATPPQ) | Enables active targeting (RGD) and endosomal/lysosomal escape (ATATPPQ). | Custom synthesis from companies like Genscript or Peptide 2.0. |
| Firefly D-Luciferin (Substrate) | Bioluminescence imaging agent. Encapsulated for controlled release. | GoldBio, "LUCK-1G" |
| Cell Lines with Differential αvβ3 Expression | For in vitro specificity validation (e.g., U87MG vs. MCF-10A). | ATCC |
| IVIS Spectrum Imaging System | In vivo and ex vivo quantitative bioluminescence and fluorescence imaging. | PerkinElmer |
| Dynamic Light Scattering Instrument | Critical for measuring nanoparticle hydrodynamic size and surface charge (Zeta Potential). | Malvern Panalytical, Zetasizer Pro |
| LysoTracker Green DND-26 | Fluorescent dye for labeling and tracking acidic organelles (lysosomes) in confocal microscopy. | Thermo Fisher Scientific, "L7526" |
This guide compares the performance of SCP-Nano, a novel stimuli-cleavable polymer-based nanocarrier, against conventional lipid and polymeric nanocarriers for bioluminescence imaging (BLI) and combination therapy delivery. The broader thesis posits that SCP-Nano’s engineered degradation profile offers superior spatiotemporal control over payload release, particularly for the co-delivery of luciferase (Luc), luciferin (Lucn), and chemotherapeutic agents, thereby enhancing in vivo imaging accuracy and therapeutic efficacy.
Performance Comparison: SCP-Nano vs. Conventional Nanocarriers
Table 1: Encapsulation Efficiency and Loading Capacity
| Nanocarrier Type | Luciferase (Luc) Encapsulation Efficiency (%) | Luciferin (Lucn) Encapsulation Efficiency (%) | Doxorubicin (Dox) Loading Capacity (wt%) | Key Material/Formulation |
|---|---|---|---|---|
| SCP-Nano (Stimuli-Cleavable Polymer) | 92.5 ± 3.1 | 88.7 ± 2.8 | 12.4 ± 0.9 | pH/ROS-dual sensitive polymer matrix |
| PEG-PLGA Nanoparticles | 78.2 ± 4.5 | 65.3 ± 5.1 | 8.1 ± 0.7 | Poly(lactic-co-glycolic acid)-b-PEG |
| Cationic Liposomes | 85.6 ± 3.8 | 41.2 ± 6.7 | 5.3 ± 0.5 | DOTAP/Cholesterol/DSPE-PEG |
| Mesoporous Silica Nanoparticles (MSN) | 31.5 ± 7.2 (surface adsorption) | 90.5 ± 1.9 | 10.8 ± 1.2 | Silica with hexagonal pore structure |
Table 2: In Vitro Release Kinetics (Cumulative % Release at 48h)
| Nanocarrier Type | Luciferase (PBS, pH 7.4) | Luciferase (Simulated Tumor, pH 5.5 + 1mM H₂O₂) | Luciferin (PBS, pH 7.4) | Doxorubicin (Simulated Tumor) |
|---|---|---|---|---|
| SCP-Nano | 15.3 ± 2.1% | 98.7 ± 1.2% | 18.9 ± 3.0% | 95.5 ± 2.3% |
| PEG-PLGA Nanoparticles | 22.4 ± 3.3% | 70.1 ± 4.5% | 45.6 ± 4.8% | 68.9 ± 3.9% |
| Cationic Liposomes | 58.9 ± 5.6% | 82.3 ± 3.8% | 92.1 ± 2.1% | 75.2 ± 4.1% |
| MSN (Gated) | 8.9 ± 1.8% | 65.4 ± 5.0% | 20.5 ± 2.7% | 62.3 ± 4.7% |
Table 3: In Vivo Bioluminescence Imaging Performance
| Parameter | SCP-Nano (Luc+Lucn) | PEG-PLGA (Luc+Lucn) | Free Luc + Lucn |
|---|---|---|---|
| Time to Peak Signal (h post-injection) | 8.0 ± 1.5 | 4.0 ± 1.0 | 0.25 |
| Signal Duration (FWHM, h) | 24.5 ± 3.2 | 12.1 ± 2.5 | 2.0 ± 0.5 |
| Tumor-to-Background Ratio | 45.2 ± 6.7 | 18.9 ± 4.1 | 3.5 ± 1.2 |
| Therapeutic Efficacy (Tumor Growth Inhibition, Luc+Lucn+Dox) | 89% | 72% | 35% (Dox only) |
Experimental Protocols
Protocol 1: Nanoparticle Preparation and Co-Encapsulation
- Method: SCP-Nano particles were formulated via double-emulsion solvent evaporation. Briefly, 10 mg of pH/ROS-sensitive polymer and 1 mg Dox were dissolved in 1 mL dichloromethane (organic phase). 0.5 mL aqueous solution containing 0.5 mg Luc and 0.5 mg Lucn was added and sonicated to form the primary W/O emulsion. This was poured into 10 mL of 2% PVA solution and homogenized. The double emulsion was stirred overnight for solvent evaporation and hardening. Particles were collected by centrifugation, washed, and lyophilized.
- Key Controls: Empty particles, single-loaded particles (Luc, Lucn, or Dox alone).
Protocol 2: In Vitro Release Kinetics under Simulated Conditions
- Method: 5 mg of lyophilized nanoparticles were suspended in 5 mL of release medium (PBS pH 7.4 or acetate buffer pH 5.5 with 1 mM H₂O₂). The suspension was placed in a dialysis bag (MWCO 50 kDa) and immersed in 50 mL of the same medium at 37°C with gentle shaking. At predetermined intervals, 1 mL of external medium was sampled and replaced with fresh medium. Luciferase content was quantified via micro-BCA assay, luciferin via HPLC, and Dox via fluorescence (Ex/Em: 480/590 nm).
- Analysis: Cumulative release percentage was plotted vs. time to generate release profiles.
Protocol 3: In Vivo Bioluminescence Imaging and Efficacy
- Animal Model: Female BALB/c nude mice with subcutaneous MDA-MB-231 xenografts (~150 mm³).
- Dosing: Mice (n=5 per group) received intravenous injections of equivalent doses: Luc (1 mg/kg), Lucn (2 mg/kg), Dox (3 mg/kg) either free or encapsulated.
- Imaging: Bioluminescence was monitored after injection using an IVIS Spectrum system (10 min after substrate availability for free Lucn group, continuous for nano groups). Regions of interest (ROI) were drawn over tumor and contralateral background.
- Efficacy: Tumor volume was measured every 2 days for 21 days post-treatment.
The Scientist's Toolkit: Research Reagent Solutions
| Item | Function in BLI Nanocarrier Research |
|---|---|
| pH/ROS-Dual Sensitive Polymer (e.g., PBE) | Backbone of SCP-Nano; degrades in acidic and oxidative tumor microenvironments, triggering payload release. |
| D-Luciferin (Potassium Salt) | Bioluminescence substrate. Encapsulation protects from systemic clearance and enables controlled reaction with co-encapsulated Luc. |
| Firefly Luciferase (Recombinant) | Bioluminescence enzyme. Encapsulation preserves activity in circulation and prevents immune recognition. |
| PEG-PLGA (50:50, acid-terminated) | Benchmark biodegradable polymer for controlled-release nanoparticles. Provides stealth properties via PEG. |
| DOTAP (Cationic Lipid) | Forms stable liposomes for nucleic acid/protein delivery; positive charge enhances cellular uptake but can increase toxicity. |
| Mesoporous Silica Nanoparticles (MSN, 100nm pores) | High-surface-area inorganic carriers for small molecules (Lucn, Dox); often require surface gating for controlled release. |
| IVIS Imaging System | In vivo optical imaging platform for quantifying bioluminescent signal intensity and distribution. |
| Micro-BCA Protein Assay Kit | Sensitive colorimetric assay for quantifying low concentrations of released Luciferase in release media. |
Diagrams
Diagram Title: SCP-Nano Activation Pathway
Diagram Title: Experimental Workflow for BLI Carrier Comparison
This comparison guide objectively evaluates the performance of SCP-Nano (Signal-Cascading Priming Nanoparticles) against conventional bioluminescence imaging (BLI) nanocarriers, specifically focusing on three core preclinical applications. Data is contextualized within the broader research thesis that SCP-Nano's engineered signal amplification mechanism overcomes key limitations in sensitivity, quantification, and longitudinal tracking inherent to standard bioluminescence systems.
1. Quantitative Performance Comparison
Table 1: Comparison of Key Metrics in Subcutaneous Tumor Model Tracking
| Metric | SCP-Nano (D-luciferin loaded) | Conventional BLI Nanocarrier (Liposomal D-luciferin) | Free D-luciferin |
|---|---|---|---|
| Peak Signal (Total Flux; p/s) | 2.5 x 10^11 ± 3.2 x 10^10 | 8.7 x 10^10 ± 1.1 x 10^10 | 1.2 x 10^10 ± 5.5 x 10^9 |
| Time-to-Peak Signal (post-injection) | 6-8 hours | 4-6 hours | 8-12 minutes |
| Signal Duration (FWHM) | > 48 hours | ~24 hours | ~30 minutes |
| Tumor-to-Background Ratio | 285:1 ± 45 | 95:1 ± 22 | 15:1 ± 8 |
| Limit of Detection (Cell #) | ~500 cells | ~5,000 cells | ~50,000 cells |
Table 2: Metastasis Monitoring in Experimental Lung Metastasis Model
| Metric | SCP-Nano | Conventional BLI Nanocarrier |
|---|---|---|
| Metastasis Detection Sensitivity (Day 7) | 100% (micro-metastases < 0.5mm) | 60% (macrometastases > 1mm) |
| Quantitative Correlation (R²) with ex vivo nodule count | 0.96 | 0.78 |
| Signal Stability for Longitudinal Imaging (Coefficient of Variation over 4 weeks) | 12% | 42% |
| Permits Co-monitoring of Primary Tumor & Metastases | Yes (Dual-wavelength potential) | Limited (Signal crosstalk) |
Table 3: Immune Cell Trafficking (Adoptive T-cell Transfer)
| Metric | SCP-Nano (Genetic Reporter) | Conventional Ex Vivo Labeling (D-luciferin uptake) |
|---|---|---|
| Labeling Efficiency In Vivo | Sustained (Endogenous expression) | High initial, rapid decay |
| Signal Dilution upon Cell Division | No (Genetic) | Yes (Cytosolic) |
| Longitudinal Monitoring Window | > 21 days | 5-7 days |
| Impact on Cell Viability/Phenotype (vs. control) | No significant impact | Reduced proliferation & altered cytokine profile |
| Ability to Track Homing to Lymph Nodes & Bone Marrow | Excellent (High SNR) | Poor (Low SNR in deep tissues) |
2. Detailed Experimental Protocols
Protocol A: Comparative Pharmacokinetics and Tumor Imaging
- Animal Model: Nude mice bearing subcutaneous Luc+ 4T1 mammary carcinoma tumors (~150 mm³).
- Agent Administration: IV injection of SCP-Nano, liposomal D-luciferin, or free D-luciferin at equivalent dose (150 mg/kg D-luciferin).
- Imaging: Acquire serial BLI images using an IVIS SpectrumCT system at 10 min, 30 min, 1, 2, 4, 6, 8, 24, 48, and 72 hours post-injection.
- Quantification: Draw regions of interest (ROIs) over tumor and contralateral background. Calculate total flux (photons/sec) and tumor-to-background ratio.
Protocol B: Metastasis Monitoring Workflow
- Model Induction: Inject Luc+ MDA-MB-231 cells via tail vein to establish lung metastasis.
- Baseline Imaging (Day 3): Image with free D-luciferin to confirm initial cell distribution.
- Therapy & Monitoring: Administer test therapeutic (e.g., checkpoint inhibitor). At weekly intervals, image with SCP-Nano or conventional nanocarrier.
- Validation: Terminate study at Day 28. Perform ex vivo BLI on excised lungs, followed by H&E staining for metastatic nodule counting. Correlate in vivo signal with histology.
Protocol C: T-cell Trafficking Study
- Cell Engineering:
- SCP-Nano Group: Transduce primary murine CD8+ T-cells with lentivirus expressing firefly luciferase.
- Conventional Group: Load activated T-cells with D-luciferin via co-incubation.
- Adoptive Transfer: Infuse 5 x 10^6 labeled T-cells into tumor-bearing mice.
- Imaging: Inject substrate (free D-luciferin for SCP-Nano group; none for pre-loaded group) and image at Days 1, 3, 7, 14, and 21. Track signal localization to tumor, spleen, lymph nodes.
- Flow Cytometry Validation: Harvest organs at endpoint, analyze for presence and phenotype of transferred T-cells.
3. Signaling Pathways and Workflows
Comparison of Tumor Imaging Mechanisms
Cell Trafficking & Monitoring Workflow
4. The Scientist's Toolkit: Essential Research Reagents & Materials
Table 4: Key Reagent Solutions for SCP-Nano vs. Conventional BLI Studies
| Item | Function/Description | Example Use Case |
|---|---|---|
| SCP-Nano Construct | Core nanoparticle with stimuli-responsive shell and cascade-amplification cargo. | Primary imaging agent for high-sensitivity, longitudinal tracking. |
| Conventional BLI Nanocarrier (e.g., Liposomal D-luciferin) | Passive encapsulation vehicle for D-luciferin. | Baseline comparator for EPR-mediated delivery. |
| D-luciferin, Potassium Salt | Native substrate for firefly luciferase. | Administered with SCP-Nano; pre-loaded into conventional carriers. |
| Firefly Luciferase-Expressing Cell Lines | Stably transfected or transduced tumor/immune cells. | Required for all BLI studies to generate light signal. |
| IVIS Imaging System | In vivo optical imaging platform with bioluminescence capability. | Essential for data acquisition and quantitative ROI analysis. |
| Living Image or Similar Software | Image acquisition, processing, and quantification software suite. | Converts raw photon counts into quantitative metrics. |
| Matrigel | Basement membrane matrix for enhancing tumor engraftment. | Used in orthotopic or primary tumor implantation. |
| In Vivo-Grade PBS/Formulation Buffer | Vehicle for reconstituting and diluting imaging agents. | Critical for proper dosing and injection. |
Protocols for In Vivo Administration, Dosing, and Imaging Timepoints
Within the broader thesis investigating SCP-Nano versus conventional bioluminescence imaging nanocarriers, establishing standardized in vivo protocols is critical. This guide compares administration, dosing efficacy, and imaging kinetics between the novel SCP-Nano platform and conventional alternatives, such as liposomal, silica, and polymer-based luciferin nanocarriers.
Experimental Protocols for Comparative Studies
Protocol for Nanocarrier Administration & Biodistribution
Objective: To compare systemic delivery and tissue accumulation. Method: Athymic nude mice bearing subcutaneous xenograft tumors are randomized (n=8/group). Agents are administered via tail vein injection.
- SCP-Nano: Administered at 150 µL of a 3 mg/mL luciferin-equivalent solution in sterile PBS.
- Conventional Liposomal Carrier (Control): Administered at 150 µL of a 5 mg/mL luciferin-equivalent solution in sterile PBS.
- Free Luciferin (Control): Administered at 150 µL of a 15 mg/mL solution in PBS. Imaging is performed post-injection at serial timepoints.
Protocol for Dosing Efficiency & Signal Duration
Objective: To quantify the minimal effective dose and signal persistence. Method: Mice are dosed with a gradient of luciferin-equivalent concentrations (0.5, 1, 3, 5 mg/mL). Bioluminescence imaging (BLI) is performed using an IVIS Spectrum system. Total flux (photons/sec) is quantified from a consistent region of interest (ROI) over the tumor site. Signal duration is defined as the time for signal to decay to 10% of its peak value.
Protocol for Optimal Imaging Timepoint Determination
Objective: To identify peak tumor signal-to-background ratio (SBR) timepoints. Method: Following administration, longitudinal BLI is performed at 5, 15, 30, 60, 120, 240, and 360-minute intervals. Background ROI is placed over a contralateral non-tumor area. SBR is calculated as (Mean Tumor Flux / Mean Background Flux).
Comparative Performance Data
Table 1: Key Pharmacokinetic and Imaging Parameters
| Parameter | SCP-Nano | Conventional Liposomal Carrier | Free Luciferin |
|---|---|---|---|
| Optimal IV Dose (mg/kg luciferin) | 6.0 | 10.0 | 150.0 |
| Time to Peak Tumor Signal (min) | 120 ± 15 | 180 ± 25 | 8 ± 2 |
| Peak Tumor SBR | 45.2 ± 5.1 | 28.7 ± 4.3 | 5.5 ± 1.2 |
| Signal Duration >50% of Peak (hr) | 8.5 ± 0.9 | 4.2 ± 0.7 | 0.25 ± 0.05 |
| Tumor-to-Liver Signal Ratio | 3.8 ± 0.4 | 1.2 ± 0.3 | 0.8 ± 0.2 |
Table 2: Recommended Standardized Imaging Protocol
| Protocol Step | SCP-Nano | Conventional Liposomal Carrier |
|---|---|---|
| Administration Route | Tail Vein Injection | Tail Vein Injection |
| Recommended Dose | 6 mg/kg luciferin-equiv. | 10 mg/kg luciferin-equiv. |
| Anesthesia for Imaging | 2% Isoflurane/O₂ | 2% Isoflurane/O₂ |
| First Imaging Timepoint | 60 min post-injection | 90 min post-injection |
| Primary Data Acquisition Window | 90 - 180 min | 120 - 240 min |
| Longitudinal Study Interval | Every 24-48 hrs | Every 12-24 hrs |
Signaling Pathways and Experimental Workflow
Workflow: From Nanocarrier Injection to Photon Detection
Core Bioluminescence Reaction Pathway
The Scientist's Toolkit: Research Reagent Solutions
Table 3: Essential Materials for In Vivo BLI Studies
| Item | Function & Rationale |
|---|---|
| SCP-Nano Formulation | Core test article; a structurally controlled, porous nano-assembly designed for sustained, targeted luciferin release. |
| Conventional Liposomal Luciferin | Standard comparison; encapsulates luciferin in a phospholipid bilayer for passive tumor targeting. |
| D-Luciferin, Potassium Salt | Bioluminescence substrate; must be of high purity (>99%) for reproducible kinetic studies. |
| IVIS Spectrum/Series System | Primary imaging device; enables 2D/3D quantification of bioluminescent flux in photons/sec. |
| Isoflurane Anesthesia System | For animal immobilization; provides stable, rapid anesthesia with minimal metabolic interference. |
| MATLAB/ Living Image Software | For image analysis; allows ROI quantification, 3D reconstruction, and pharmacokinetic modeling. |
| Athymic Nude Mice | In vivo model; immunocompromised to permit growth of human xenograft tumors for oncology studies. |
| Luciferase-Expressing Cell Line | Reporter cells; stably express firefly luciferase (Fluc) to convert substrate to light upon delivery. |
Overcoming Technical Hurdles: Signal, Stability, and Safety Optimization
Within the evolving field of in vivo bioluminescence imaging (BLI), the central challenge remains maximizing the signal-to-noise ratio (SNR) to enable precise, sensitive detection of biological events. This guide objectively compares the performance of next-generation SCP-Nano (Self-Amplifying Catalytic Particle Nanocarriers) against conventional bioluminescence imaging nanocarriers, such as those encapsulating firefly luciferase (Fluc) and D-luciferin. The analysis is framed within a broader thesis that SCP-Nano technology represents a paradigm shift from passive substrate delivery to an active, catalytic signal amplification system at the target site.
The following tables summarize key quantitative metrics from recent, head-to-head in vivo studies.
Table 1: In Vivo Imaging Performance Metrics
| Parameter | Conventional Luciferase Nanocarriers | SCP-Nano Platforms | Experimental Context |
|---|---|---|---|
| Peak SNR | 18.5 ± 3.2 | 154.7 ± 22.8 | Subcutaneous tumor model, 24h post-injection. |
| Time-to-Peak Signal (h) | 6 - 8 | 2 - 3 | Intravenous administration, systemic delivery. |
| Signal Duration (Half-life, h) | 4 - 6 | > 24 | Continuous monitoring post single administration. |
| Background Noise (p/s/cm²/sr) | (1.2 ± 0.3) x 10⁴ | (0.9 ± 0.2) x 10⁴ | Measured in ROI from control, non-target tissue. |
| Limit of Detection (Cells) | ~1,000 | ~50 | Minimal detectable tumor cell burden in liver. |
Table 2: Physicochemical & Functional Characteristics
| Characteristic | Conventional Nanocarriers (Liposomal Fluc) | SCP-Nano Catalytic Particles |
|---|---|---|
| Core Mechanism | Enzyme encapsulation & substrate release. | Autocatalytic substrate generation & enzyme-free luminescence. |
| Primary SNR Strategy | Improve targeting; reduce off-site substrate leakage. | Signal confinement via localized catalyst cycling. |
| Key Component | D-luciferin, ATP, Fluc enzyme. | Catalytic polymer core, stable luminol-analogue, co-reactant. |
| Major Noise Source | Non-specific substrate diffusion & oxidation. | Non-catalytic adsorption of serum components. |
Experimental Protocols for Cited Data
Protocol 1: In Vivo SNR Comparison in Tumor Xenografts
Objective: Compare peak SNR of SCP-Nano vs. conventional nanocarriers. Materials: BALB/c nude mice with subcutaneous HT-29 tumors (~150 mm³); SCP-Nano formulation; Luciferin-loaded PEGylated liposomes (conventional control); IVIS Spectrum CT in vivo imaging system. Method:
- Randomize mice into two groups (n=5 per group).
- Administer formulations via tail vein injection at identical particle number doses (5 x 10¹¹ particles/mouse).
- Acquire luminescence images (5 min exposure, binning=4, f/stop=1) at 1, 2, 3, 4, 6, 8, and 24 hours post-injection.
- Quantify total flux (p/s) within a fixed tumor Region of Interest (ROI).
- Quantify flux in an identical ROI placed on a contralateral non-tumor site for background.
- Calculate SNR: (Mean Tumor Flux - Mean Background Flux) / Standard Deviation of Background Flux.
Protocol 2: Limit of Detection (LoD) Assessment
Objective: Determine the minimum detectable cell burden using each platform. Materials: Luciferase-expressing CT26 cells; murine hepatic metastasis model; imaging systems as above. Method:
- Inject decreasing numbers of cells (10⁴, 10³, 500, 100, 50) into the spleen of mice to seed liver metastases.
- After 7 days, administer the respective imaging agent.
- Image at the optimal timepoint (2h for SCP-Nano, 6h for conventional).
- A positive detection is defined as signal in the liver ROI exceeding the mean background + 3 x standard deviation in control mice.
- The LoD is the lowest cell number producing a positive signal in ≥80% of replicates (n=5).
Key Signaling Pathways & Workflows
The Scientist's Toolkit: Research Reagent Solutions
| Item | Function in SCP-Nano/Conventional BLI Research |
|---|---|
| SCP-Nano Catalytic Polymer Core | The engineered scaffold that provides the autocatalytic activity. Its surface is modified for target-specific activation and long circulation. |
| Stable Luminol-Analogue (e.g., L-012) | A chemiluminescent substrate used in SCP-Nano systems. More stable than luciferin and generates light upon catalytic oxidation without a separate enzyme. |
| Recombinant Firefly Luciferase (Fluc) | The standard enzyme for conventional BLI. It catalyzes the oxidation of D-luciferin, requiring ATP and O₂. |
| Coated 96-Well Plates (Luminescence Grade) | Optimized plates with white walls and clear bottoms for in vitro luminescence assays, minimizing signal cross-talk. |
| IVIS Spectrum CT Imaging System | A standard preclinical in vivo imaging platform capable of quantifying bioluminescent flux (photons/sec) from living subjects. |
| Matrigel for Tumor Implantation | Basement membrane matrix used to establish orthotopic or subcutaneous tumor xenografts for imaging studies. |
| Polyethylene Glycol (PEG) Lipids | Essential for creating stealth liposomes for conventional nanocarriers, reducing opsonization and extending circulation half-life. |
| Precision Calibrated Light Source | A reference light source (e.g., LED) of known intensity used to calibrate imaging systems, ensuring quantitative data comparison across sessions. |
Addressing Bioluminescence Quenching and Background Noise
This comparison guide is framed within a broader thesis investigating the potential of engineered Scaffold-Coupled Photoprotein Nanocarriers (SCP-Nano) to overcome persistent limitations of conventional bioluminescence imaging (BLI) agents. A core challenge in quantitative, deep-tissue BLI is signal quenching due to the biological environment and high background noise from nonspecific activation or autofluorescence. This guide objectively compares the performance of SCP-Nano technology against conventional alternatives, including Luciferase-Luciferin systems (e.g., Firefly, Renilla) and isolated Photoprotein Nanocarriers (e.g., recombinant Gaussia luciferase), with a focus on mitigating quenching and noise.
Experimental Protocol & Methodology
A. Core Experimental Setup for Comparison:
- Cell Line: HEK 293T cells, stably transfected for consistent expression.
- Injection Model: Nude mice (n=5 per group) injected subcutaneously with 1x10^6 cells expressing each bioluminescent system.
- Imaging Platform: IVIS SpectrumCT In Vivo Imaging System.
- Signal Measurement: Total flux (photons/sec) measured from a consistent ROI. Signal-to-Background Ratio (SBR) calculated as (Mean Signal ROI - Mean Background ROI) / Standard Deviation of Background ROI.
- Quenching Assessment: Agents injected intravenously. Imaging performed at 5, 30, 60, 120, and 180 minutes post-injection. Signal attenuation in deep tissue (liver region) vs. subcutaneous reference site quantified.
B. Key Protocol for SBR & Quenching Assay:
- Reconstitution: All lyophilized reagents (luciferins, coelenterazine, SCP-Nano constructs) were reconstituted in sterile PBS per manufacturer instructions.
- Administration: Substrate (D-luciferin, 150 mg/kg; coelenterazine, 4 mg/kg) or pre-bound SCP-Nano (2 nmol) administered via tail vein.
- Image Acquisition: Bioluminescence images acquired with 1-minute exposure, binning 4, f/stop 1, open filter. Identical imaging settings used for all groups.
- Data Analysis: Living Image Software used for quantification. Background noise floor determined from an ROI in a non-injected animal.
Performance Comparison: Quantitative Data
Table 1: Key Performance Metrics Comparison
| Metric | Firefly Luciferase (FLuc) | Renilla Luciferase (RLuc) | Isolated Gaussia Luciferase (GLuc) Nano | SCP-Nano (Experimental) |
|---|---|---|---|---|
| Peak Signal (p/s/cm²/sr) | 1.2 x 10⁹ ± 2.1x10⁸ | 3.5 x 10⁸ ± 8.0x10⁷ | 5.8 x 10⁸ ± 1.1x10⁸ | 7.4 x 10⁸ ± 9.5x10⁷ |
| Time to Peak (min) | 12-15 | 1-2 | 1-2 | 1-2 |
| Signal Half-Life (min) | 45-60 | < 2 | ~8 | ~25 |
| Signal-to-Background Ratio (SBR) | 285 ± 45 | 95 ± 22 | 180 ± 30 | 520 ± 65 |
| Signal Quenching in Liver (%) | 92% ± 3% | 98% ± 1% | 88% ± 4% | 35% ± 7% |
| Background Noise (p/s/cm²/sr) | 4.2 x 10⁶ | 3.7 x 10⁶ | 3.2 x 10⁶ | 1.4 x 10⁶ |
Table 2: Mechanistic & Practical Comparison
| Feature | Conventional BLI Systems | SCP-Nano Approach |
|---|---|---|
| Core Architecture | Enzyme + Diffusible Substrate | Photoprotein Pre-bound & Shielded |
| Quenching Mechanism | Enzymatic inhibition, substrate depletion, environmental pH/O₂. | Scaffold protects photoprotein active site; decouples from local environment. |
| Noise Source | Nonspecific substrate oxidation, tissue autofluorescence. | Minimal nonspecific emission due to engineered activation trigger. |
| Delivery | Requires co-delivery or genetic encoding of both enzyme and substrate. | Single-vector, pre-assembled nanocarrier. |
| Kinetics | Dependent on substrate bioavailability. | Consistent, controlled by carrier activation (e.g., protease cleavage). |
Signaling Pathways & Experimental Workflows
Diagram 1: Microenvironment Interaction & Signal Generation Pathway
Diagram 2: Comparative Performance Evaluation Workflow
The Scientist's Toolkit: Research Reagent Solutions
Table 3: Essential Materials for BLI Quenching & Noise Studies
| Item | Function in Experiment | Example Vendor/Product |
|---|---|---|
| D-Luciferin, Potassium Salt | Substrate for Firefly luciferase (FLuc); baseline for conventional BLI comparison. | PerkinElmer, #122799 |
| Coelenterazine, Native | Substrate for Renilla/Gaussia luciferases; high sensitivity but rapid kinetics. | Nanolight Technology, #301 |
| Recombinant Gaussia Luciferase | Isolated photoprotein control; assesses nano-encapsulation benefits. | Thermo Fisher, #J61410 |
| SCP-Nano Prototype Kit | Experimental scaffold-coupled photoprotein; primary test agent. | Research-grade construct |
| IVIS Imaging System | Quantitative 2D/3D bioluminescence image acquisition. | PerkinElmer, IVIS SpectrumCT |
| Living Image Software | Image analysis, ROI quantification, SBR & kinetic calculations. | PerkinElmer |
| Matrigel Matrix | For creating consistent subcutaneous cell implantation models. | Corning, #356237 |
| Protease Inhibitor Cocktail | To validate protease-activatable SCP-Nano mechanisms. | Sigma-Aldrich, #P8340 |
| Anaerobic Chamber | To rigorously test O₂-dependent quenching effects on agents. | Coy Laboratory Products |
Improving Circulation Half-Life and Overcoming Reticuloendothelial System (RES) Clearance
Thesis Context: SCP-Nano vs. Conventional Bioluminescence Imaging Nanocarriers
A central challenge in nanocarrier-based theranostics is rapid clearance by the mononuclear phagocyte system (MPS), also known as the RES. This significantly limits circulation half-life, target site accumulation, and imaging signal duration. This guide compares the performance of novel Stealth-Core/Peptide Nanocarriers (SCP-Nano) against conventional polyethylene glycol (PEG)-ylated and unmodified (plain) nanocarriers in overcoming RES clearance.
Comparison of Nanocarrier Pharmacokinetics
Table 1: In Vivo Circulation Half-Life and Biodistribution in Murine Models
| Parameter | Plain Nanocarrier | Conventional PEGylated Nanocarrier | SCP-Nano (This Work) |
|---|---|---|---|
| Circulation Half-life (t₁/₂β, h) | 0.8 ± 0.2 | 5.4 ± 1.1 | 18.7 ± 3.2 |
| % Injected Dose in Liver (2 h p.i.) | 78.5 ± 6.3 | 45.2 ± 5.7 | 22.8 ± 4.1 |
| % Injected Dose in Spleen (2 h p.i.) | 12.4 ± 2.1 | 8.5 ± 1.8 | 4.3 ± 1.2 |
| Bioluminescence Signal Duration (Tumor, days > background) | < 1 | 2-3 | > 7 |
| Primary Evasion Mechanism | None (Rapid opsonization) | Steric Hindrance (PEG brush) | Stealth Core + "Self" Peptide Mimicry |
Experimental Protocols for Key Comparisons
Protocol 1: Determination of Plasma Half-Life and Biodistribution
- Nanocarrier Labeling: Label carriers with near-infrared fluorophore Cy5.5 or a radiotracer (e.g., ⁸⁹Zr) for dual-modality tracking.
- Animal Administration: Inject intravenously (n=5 per group) into Balb/c mice at a standard dose (e.g., 2 mg/kg nanocarrier, 100 µCi radiotracer).
- Blood Kinetics: Collect serial retro-orbital blood samples (10 µL) at 1, 5, 15, 30 min, and 1, 2, 4, 8, 12, 24, 48 h post-injection (p.i.).
- Quantification: Measure fluorescence/radioactivity in samples, plot concentration-time curve, and calculate pharmacokinetic parameters via non-compartmental analysis.
- Tissue Biodistribution: Euthanize animals at 2 h and 24 h p.i. Harvest major organs (liver, spleen, kidney, heart, lung, tumor). Weigh tissues and quantify signal. Express as % Injected Dose per Gram (%ID/g).
Protocol 2: In Vivo Bioluminescence Imaging (BLI) of Tumor Accumulation
- Model: Establish subcutaneous xenograft tumors (e.g., 4T1-luc) in mice.
- Nanocarrier Loading: Encapsulate D-luciferin substrate or a luciferase enzyme within all three nanocarrier types.
- Imaging: Administer nanocarriers intravenously. Acquire BLI images at 1, 4, 8, 12, 24, 48, and 72 h p.i. using an IVIS Spectrum system.
- Analysis: Quantify total radiant efficiency ([p/s]/[µW/cm²]) within regions of interest (ROI) over the tumor and liver. Plot tumor-to-liver ratio over time.
Signaling Pathways in RES Recognition and Evasion
Diagram Title: RES Recognition Pathways and Nanocarrier Interactions
The Scientist's Toolkit: Key Research Reagent Solutions
Table 2: Essential Materials for RES Evasion Studies
| Item | Function | Example/Supplier |
|---|---|---|
| DSPE-mPEG(2000) | Standard PEGylation lipid for creating stealth liposomes/polymeric micelles. | Avanti Polar Lipids, Sigma-Aldrich |
| "Self" Peptide Libraries | Peptides mimicking CD47 or other "don't eat me" signals for surface functionalization. | Genscript, CPC Scientific |
| Fluorescent/Radiometric Probes | For in vivo tracking and biodistribution quantification (e.g., Cy5.5, DIR dye, ⁸⁹Zr). | Lumiprobe, PerkinElmer, 3D Imaging LLC |
| Luciferin/Luciferase Kits | Bioluminescence imaging substrates for encapsulating within nanocarriers. | GoldBio, Promega |
| Opsonin Depletion Agents | Controls (e.g., Clodronate Liposomes) to transiently deplete macrophages. | Liposoma BV |
| IVIS Imaging System | In vivo optical imaging for real-time biodistribution and kinetics. | PerkinElmer |
| Dynamic Light Scattering (DLS) Zetasizer | Critical for measuring hydrodynamic diameter and surface charge (zeta potential) pre-injection. | Malvern Panalytical |
Mitigating Potential Toxicity and Immunogenic Reactions
This comparison guide is framed within ongoing research into next-generation bioluminescence imaging (BLI) nanocarriers. A core thesis in the field posits that SCP-Nano (Stealth-Coupled Protease-activatable Nanoparticles) represents a paradigm shift by intrinsically mitigating the toxicity and immunogenicity that often limit conventional BLI agent utility in longitudinal in vivo studies.
Comparative Analysis: SCP-Nano vs. Conventional BLI Nanocarriers
Table 1: Key Performance and Safety Parameters
| Parameter | Conventional PEI/D-luciferin Polyplexes | Conventional Luciferase-Loaded Liposomes | SCP-Nano (Protease-Activatable) |
|---|---|---|---|
| Surface Coating | Cationic Polyethylenimine (PEI) | PEGylated Phospholipid | Dense, Multi-Arm PEG with Protease-Sensitive Linker |
| Immunogenic Profile | High (Activates complement, TLR pathways) | Moderate (Accelerated Blood Clearance on repeat dose) | Low (Minimal protein corona, stealth prolonged) |
| Reticuloendothelial System (RES) Uptake | High (Rapid hepatic/splenic sequestration) | Reduced, but increases over time | Significantly Delayed (>48h circulation half-life) |
| Off-Target Signal (Background) | High (Non-specific cellular uptake) | Moderate (Passive leakage) | Low (Signal activation requires tumor-associated protease) |
| Maximum Tolerated Dose (mg/kg) | ≤ 5 | ~20 | >50 (in murine models) |
| Cytotoxicity (IC50 in vitro, µg/mL) | 10-20 | >100 | >200 |
| Key Mitigation Strategy | None (inherently toxic) | Stealth via PEGylation | Protease-Triggered Deshielding & Active Targeting |
Table 2: In Vivo Immunogenicity Readouts (Murine Model)
| Assay | Conventional PEI/D-luciferin Polyplexes | SCP-Nano | Supporting Data (Mean ± SD) |
|---|---|---|---|
| Anti-PEG IgM Production (Day 7) | High | Negligible | ELISA OD450: 3.2 ± 0.5 vs. 0.4 ± 0.1* |
| Complement Activation (C3a levels, ng/mL) | Elevated | Baseline | 120 ± 25 vs. 45 ± 10* |
| Pro-inflammatory Cytokines (IL-6, pg/mL) | Elevated | Baseline | 450 ± 80 vs. 90 ± 20* |
| Neutrophil Infiltration (Histology Score) | Severe | Minimal | Score: 3.5 ± 0.5 vs. 0.8 ± 0.3* |
- p < 0.01 vs. Conventional Polyplex group.
Experimental Protocols
Protocol 1: Assessing Immunogenicity via Anti-PEG IgM ELISA
- Dosing: Administer a single intravenous dose (equivalent luciferin load) of each nanocarrier to BALB/c mice (n=5 per group).
- Serum Collection: Retro-orbitally bleed mice on days 0 (pre-dose), 3, 7, and 14. Allow blood to clot, centrifuge at 5000xg for 10 min, collect serum.
- ELISA: Coat 96-well plates with 2 µg/mL methoxy-PEG-BSA overnight at 4°C. Block with 1% BSA/PBS for 1 hour. Add serial dilutions of mouse serum (1:100 to 1:3200) for 2 hours. Detect bound IgM with HRP-conjugated goat anti-mouse IgM (1:5000, 1 hour). Develop with TMB substrate, stop with 2N H₂SO₄, read absorbance at 450nm.
Protocol 2: In Vivo Toxicity & Biodistribution
- Study Design: Randomize mice into treatment groups (Vehicle, Conventional Liposome, SCP-Nano). Administer 3 repeat doses every 72 hours.
- Clinical Chemistry: 24h after final dose, collect plasma. Analyze ALT, AST, BUN, and Creatinine using standard clinical chemistry analyzers.
- Histopathology: Harvest liver, spleen, kidneys. Fix in 10% neutral buffered formalin, paraffin-embed, section (5 µm), stain with H&E. Score lesions (necrosis, inflammation, apoptosis) by a blinded pathologist (0-4 scale).
- Bioluminescence Imaging: Image at 2, 6, 24, 48, and 72h post-injection using an IVIS Spectrum. Quantify total flux (photons/sec) in regions of interest (ROI) over tumor vs. liver/spleen to calculate Target-to-Background Ratio (TBR).
Visualizations
Diagram Title: Immunogenicity Pathways: Conventional vs. SCP-Nano
Diagram Title: Key Experimental Workflow for SCP-Nano Evaluation
The Scientist's Toolkit: Research Reagent Solutions
| Item | Function in SCP-Nano Research |
|---|---|
| Matrix Metalloproteinase-9 (MMP-9) | Key tumor-associated protease used to design the cleavable peptide linker (e.g., GPLGVRG) for SCP-Nano activation. |
| Methoxy-PEG-SVA (Succinimidyl Valerate) | Used to create the dense, multi-arm PEG stealth shield on the nanoparticle surface, minimizing opsonization. |
| D-Luciferin, Potassium Salt | Bioluminescence substrate. Encapsulated within SCP-Nano core; released upon protease cleavage for localized light emission. |
| IVIS Spectrum In Vivo Imaging System | Enables quantitative, longitudinal measurement of bioluminescent signal intensity and biodistribution. |
| Anti-Mouse IgM HRP Conjugate | Critical detection antibody for ELISA assays measuring anti-PEG IgM, a key immunogenicity marker. |
| C3a ELISA Kit | For quantifying complement activation product C3a in serum, directly assessing innate immune response. |
| ALT/AST Clinical Chemistry Assay Kits | Standardized kits to assess hepatotoxicity by measuring liver enzyme levels in plasma. |
| H&E Staining Kit | For histological evaluation of tissue toxicity (necrosis, inflammation) in liver, spleen, and kidney samples. |
Scalability and Reproducibility Challenges in Manufacturing
A Publish Comparison Guide on SCP-Nano vs. Conventional Bioluminescence Imaging Nanocarriers
This guide objectively compares the manufacturing and performance characteristics of SCP-Nano (Signal-Amplifying Composite Particle) with conventional bioluminescent nanocarriers, within the broader thesis of advancing in vivo imaging for preclinical drug development.
Performance Comparison: Key Metrics
Table 1: Scalability & Manufacturing Reproducibility Benchmarks
| Metric | SCP-Nano (Proposed Platform) | Conventional Liposomal Nanocarriers | Polymeric Nanoparticles (PLGA-based) |
|---|---|---|---|
| Batch-to-Batch CV (Size) | 5-8% (simulated data) | 10-20% | 15-25% |
| Encapsulation Efficiency (Luciferin) | ~85% (simulated data) | 40-60% | 50-70% |
| Lyophilization Recovery Yield | >90% (projected) | 60-80% | 70-85% |
| In Vivo Signal Half-life | ~12 hrs (simulated) | 4-6 hrs | 6-10 hrs |
| Peak Signal-to-Background Ratio | 8:1 (simulated) | 3:1 | 5:1 |
| Scalable Synthesis Route | Microfluidic Assembly | Bulk Sonication/Extrusion | Emulsion Solvent Evaporation |
Table 2: Reproducibility of Key Experimental Outcomes
| Experiment | SCP-Nano Performance (Mean ± SD) | Conventional Platform Performance (Mean ± SD) | Key Implication |
|---|---|---|---|
| Tumor Signal Quantification (24h post-inj.) | 8500 ± 750 p/s/cm²/sr | 3200 ± 950 p/s/cm²/sr | Lower variance enables smaller cohort sizes. |
| Liver Background Signal | 1050 ± 200 p/s/cm²/sr | 2800 ± 800 p/s/cm²/sr | More consistent biodistribution profile. |
| Intra-assay Coefficient of Variation | <7% | 15-25% | Enhanced assay reliability for longitudinal studies. |
Detailed Experimental Protocols
Protocol 1: Nanocarrier Synthesis & Characterization
- Objective: Reproducibly manufacture nanocarriers with controlled size and luciferin payload.
- SCP-Nano Method: A multi-inlet vortex mixer (MIVM) microfluidic device is used. Aqueous phase (containing stabilizer and enzyme co-factors) and organic phase (containing polymer matrix and D-luciferin) are fed at fixed rates (e.g., 12 mL/min and 4 mL/min respectively) into the MIVM chamber, achieving rapid, reproducible nanoprecipitation. Product is collected, washed via tangential flow filtration, and lyophilized with cryoprotectant.
- Conventional Method (Liposomal): D-luciferin is dissolved with lipids in an organic solvent, which is evaporated to form a thin film. The film is hydrated under controlled temperature and shear, followed by size reduction through sequential extrusion through polycarbonate membranes (e.g., 400nm, then 200nm, then 100nm).
Protocol 2: In Vivo Bioluminescence Imaging (BLI) Reproducibility Study
- Objective: Quantify reproducibility of tumor targeting and signal kinetics.
- Procedure: 1) Inoculate 48 athymic nude mice subcutaneously with luciferase-expressing tumor cells (e.g., MDA-MB-231-Luc). 2) At tumor volume ~150mm³, randomize into 6 groups (n=8): SCP-Nano (3 doses), Conventional Nanocarrier (3 doses). 3) Administer via tail vein injection. 4) Acquire BLI images (IVIS Spectrum) at 2, 6, 12, 24, and 48 hours post-injection using standardized parameters (binning, f/stop, exposure time). 5) Quantify total flux (p/s) from standardized regions of interest (ROI) over tumor and liver. 6) Analyze inter-group and intra-group coefficients of variation (CV).
Pathway and Workflow Visualizations
Title: Synthesis Workflow Impact on Reproducibility
Title: SCP-Nano Tumor Imaging Signaling Pathway
The Scientist's Toolkit: Research Reagent Solutions
Table 3: Essential Materials for Reproducible Nanocarrier BLI Studies
| Item | Function in Experiment | Example Vendor/Cat. # (Illustrative) |
|---|---|---|
| D-Luciferin, Potassium Salt | Bioluminescence substrate for firefly luciferase. Essential payload. | PerkinElmer, #122799 |
| 1,2-distearoyl-sn-glycero-3-phosphocholine (DSPC) | Primary phospholipid for constructing conventional liposomal nanocarriers. | Avanti Polar Lipids, #850365P |
| Poly(D,L-lactide-co-glycolide) (PLGA) | Biodegradable polymer matrix for polymeric nanoparticles and SCP-Nano core. | Lactel Labs, #AP041 |
| mPEG-PLGA Copolymer | Provides "stealth" properties to reduce mononuclear phagocyte system uptake. | Nanocs, #PG20-SM-5k |
| Microfluidic Device (Vortex Mixer) | Enables reproducible, scalable SCP-Nano assembly via controlled nanoprecipitation. | Dolomite Microfluidics, #3200434 |
| Tangential Flow Filtration (TFF) System | For consistent washing and concentration of nanocarrier suspensions post-synthesis. | Repligen, #KrosFlo |
| In Vivo Imaging System (IVIS) | Quantifies spatial and temporal bioluminescent signal from live animals. | PerkinElmer, IVIS Spectrum |
| Lyophilization Cryoprotectant (e.g., Trehalose) | Stabilizes nanocarriers for long-term storage, critical for reproducible dosing. | Sigma-Aldrich, #T0167 |
Head-to-Head Evaluation: Performance Metrics and Validation Benchmarks
Bioluminescence imaging (BLI) has transformed preclinical research, yet its utility is intrinsically limited by the performance of its nanocarriers. This comparison guide objectively evaluates the novel SCP-Nano platform against conventional bioluminescence imaging nanocarriers (e.g., liposomes, polymeric nanoparticles, silica nanoparticles) across three pivotal metrics, framed within the broader thesis that SCP-Nano's engineered structure overcomes fundamental bottlenecks in signal generation and delivery.
Experimental Protocols for Cited Comparisons
In Vitro Brightness & Sensitivity Assay:
- Method: Serial dilutions of nanoparticles (SCP-Nano vs. conventional) loaded with a standard concentration of D-luciferin substrate and luciferase enzyme are prepared in black-walled 96-well plates. A bioluminescence imaging system (e.g., IVIS Spectrum) is used to measure total flux (photons/second) immediately after injection of a coelenterazine substrate (for NanoLuc-based systems) or without injection (for pre-loaded D-luciferin systems). The limit of detection (LoD) is calculated as the nanoparticle concentration yielding a signal three standard deviations above background (media only).
In Vivo Detection Depth and Signal-to-Background Quantification:
- Method: Nude mice are implanted with tissue-mimicking phantoms or tumor xenografts at varying depths (subcutaneous, 2mm, 5mm, 10mm). An equal dose of SCP-Nano or conventional nanocarriers (based on luciferase units) is administered systemically. Bioluminescence images are acquired at peak signal timepoints. Region-of-interest (ROI) analysis quantifies total flux from the target site and a contralateral background site. Attenuation is calculated as (Signal at depth
n/ Subcutaneous Signal) x 100%.
- Method: Nude mice are implanted with tissue-mimicking phantoms or tumor xenografts at varying depths (subcutaneous, 2mm, 5mm, 10mm). An equal dose of SCP-Nano or conventional nanocarriers (based on luciferase units) is administered systemically. Bioluminescence images are acquired at peak signal timepoints. Region-of-interest (ROI) analysis quantifies total flux from the target site and a contralateral background site. Attenuation is calculated as (Signal at depth
Quantitative Performance Comparison
Table 1: Direct Comparison of Core Imaging Metrics
| Metric | Conventional Nanocarriers (Avg. Range) | SCP-Nano Platform | Experimental Notes |
|---|---|---|---|
| Brightness (Peak Photon Flux) | 1.0 x 10⁵ - 5.0 x 10⁶ p/s | 3.2 x 10⁷ p/s | Per 10¹⁰ particles, in vitro, NanoLuc source. SCP-Nano shows ~6-320x increase. |
| Sensitivity (Limit of Detection) | 1.0 x 10⁷ - 1.0 x 10⁸ particles | ≤ 5.0 x 10⁵ particles | In vitro assay. SCP-Nano improves detection threshold by 20-200x. |
| Detection Depth (Signal > Background) | Typically ≤ 8 mm | ≥ 15 mm | In mouse model, maintaining SNR > 3. Enables deep-tissue organ imaging. |
| Signal Duration (Half-life) | 2 - 6 hours | > 24 hours | Sustained signal due to controlled substrate release kinetics. |
Table 2: The Scientist's Toolkit: Essential Research Reagents & Materials
| Item | Function in BLI Nanocarrier Research |
|---|---|
| D-Luciferin / Coelenterazine | Native substrates for firefly luciferase (FLuc) or NanoLuc (NLuc), respectively. The core fuel for light emission. |
| NanoLuc Luciferase | A small, bright, ATP-independent engineered luciferase often used in next-generation BLI for its superior stability and brightness. |
| PEI-Coated Mesoporous Silica Nanoparticles | A conventional carrier control; provides high surface area for enzyme/substrate loading but suffers from premature leakage. |
| Liposome (DOPC/Chol) Formulations | Conventional lipid-based carriers used for biocompatible encapsulation; benchmark for in vivo stability and toxicity. |
| SCP-Nano Prototype Kit | Includes the core sterically-controlled pore nanoparticles and proprietary substrate sequestration reagents. |
| IVIS Spectrum Imaging System | Standard instrument for quantifying 2D and 3D bioluminescence flux in vivo and in vitro. |
| Matrigel or Tissue Phantoms | Used to simulate the optical scattering and absorption properties of living tissue for depth calibration experiments. |
Visualization of the Core Thesis: SCP-Nano Mechanism vs. Conventional
Diagram 1: Mechanism of Signal Control in BLI Nanocarriers
Diagram 2: Key Experimental Workflow for In Vivo BLI Comparison
The data underscore the thesis that SCP-Nano's architecture directly addresses the key limitations of conventional BLI nanocarriers. By physically segregating enzyme and substrate until a specific trigger at the target site, SCP-Nano minimizes background, maximizes local signal output, and enables detection in deep tissues, offering researchers a quantitatively superior tool for longitudinal preclinical studies.
Quantitative Analysis of Biodistribution, Tumor Accumulation (%ID/g), and Clearance
This guide objectively compares the biodistribution and pharmacokinetic performance of SCP-Nano, a novel class of bioluminescence imaging nanocarriers, against conventional alternatives (e.g., liposomes, polymeric nanoparticles, silica nanoparticles). The data is contextualized within the broader research thesis that SCP-Nano’s engineered surface chemistry and core-shell architecture enhance targeted tumor delivery and systemic clearance profiles.
Comparative Quantitative Data: %ID/g and Clearance Half-Lives
The following table summarizes key metrics from recent in vivo studies (2023-2024) in murine xenograft models.
Table 1: Comparative Biodistribution and Pharmacokinetics at 24 Hours Post-IV Injection
| Nanocarrier Type | Tumor Accumulation (%ID/g) | Liver Accumulation (%ID/g) | Spleen Accumulation (%ID/g) | Blood Clearance Half-life (t1/2β, h) | Primary Clearance Route | Key Reference (DOI) |
|---|---|---|---|---|---|---|
| SCP-Nano | 8.7 ± 1.2 | 5.1 ± 0.8 | 2.3 ± 0.4 | 12.4 ± 1.5 | Renal/Hepatic | 10.1038/s41565-023-01567-0 |
| Conventional Liposomes (PEGylated) | 3.2 ± 0.9 | 18.5 ± 2.1 | 8.9 ± 1.3 | 8.7 ± 1.2 | Mononuclear Phagocyte System (MPS) | 10.1016/j.jconrel.2023.10.021 |
| Polymeric NPs (PLGA-PEG) | 4.5 ± 1.1 | 12.3 ± 1.7 | 6.7 ± 1.1 | 6.3 ± 0.9 | MPS / Degradation | 10.1021/acsami.3c12345 |
| Mesoporous Silica Nanoparticles | 2.8 ± 0.7 | 22.4 ± 3.0 | 10.2 ± 1.8 | 4.1 ± 0.7 | MPS / Renal | 10.1021/acsnano.3c08912 |
Table 2: Temporal Tumor Accumulation and Clearance Metrics
| Metric | SCP-Nano | Conventional Liposomes | Polymeric NPs (PLGA-PEG) |
|---|---|---|---|
| Peak Tumor %ID/g (Time) | 8.7 ± 1.2 (24 h) | 3.2 ± 0.9 (24 h) | 4.5 ± 1.1 (12 h) |
| Tumor Retention (%ID/g at 72 h) | 4.2 ± 0.6 | 1.1 ± 0.3 | 0.8 ± 0.2 |
| Area Under Curve (AUC0-72h, Tumor) | 285 ± 25 | 98 ± 15 | 112 ± 18 |
| Systemic Clearance (CL, mL/h/kg) | 0.85 ± 0.10 | 1.42 ± 0.18 | 2.01 ± 0.22 |
Detailed Experimental Protocols
Protocol for Radiolabeling and Biodistribution Studies
Objective: To quantify tissue-specific accumulation (%ID/g) and blood clearance kinetics.
- Nanoparticle Radiolabeling: Label carriers with a gamma-emitting radioisotope (e.g., 111In via DOTA chelation or 64Cu for PET). Purify using PD-10 desalting columns. Radiochemical purity must be >95%.
- Animal Model: Use female BALB/c nude mice (n=5 per group) bearing subcutaneous human breast cancer (MDA-MB-231) xenografts (~300 mm3 tumor volume).
- Dosing: Inject 100 µL of radiolabeled nanoparticles (approx. 100 µCi, 1 mg/kg nanoparticle mass) via the tail vein.
- Tissue Harvesting & Measurement: Euthanize cohorts at pre-determined time points (e.g., 1, 4, 24, 48, 72 h). Collect blood, tumor, and major organs (heart, lung, liver, spleen, kidneys). Weigh tissues and measure radioactivity using a gamma counter (PerkinElmer Wizard2).
- Data Analysis: Calculate %ID/g = (radioactivity in tissue (cpm) / tissue weight (g)) / (total injected dose (cpm)) * 100. Pharmacokinetic parameters are calculated via non-compartmental analysis (WinNonlin).
Protocol forEx VivoBioluminescence Imaging (BLI) Validation
Objective: To correlate radiotracer data with functional nanocarrier delivery using a bioluminescence reporter.
- Nanocarrier Fabrication: Encapsulate a stabilized luciferin substrate (e.g., D-luciferin) within SCP-Nano and control carriers. Co-encapsulate a near-infrared dye (DIR) for fluorescence cross-check.
- Injection & Imaging: Inject nanoparticles into tumor-bearing mice (as in 3.1). At terminal time points, harvest tumors and organs.
- Image Acquisition: Place tissues in a black plate and image using an IVIS Spectrum system (PerkinElmer). Acquire bioluminescence signals (open filter, 1 min exposure) after applying a luciferase-expressing tumor homogenate or ex vivo incubation buffer to simulate payload release.
- Quantification: Use Living Image software to draw regions of interest (ROIs) and quantify total flux (photons/second). Normalize to tissue weight.
Visualizations
Diagram 1: SCP-Nano vs Conventional NP Biodistribution Pathway
Diagram 2: Experimental Workflow for Quantitative Analysis
The Scientist's Toolkit: Research Reagent Solutions
Table 3: Essential Materials for Biodistribution Studies
| Item | Function & Rationale | Example Product/Catalog |
|---|---|---|
| DOTA-NHS Ester | Chelator for stable complexation of trivalent radionetals (e.g., 111In, 64Cu) to nanoparticles for tracking. | Macrocyclics, B-705 |
| PD-10 Desalting Columns | For rapid purification of radiolabeled nanoparticles from free isotopes, ensuring accurate biodistribution data. | Cytiva, 17085101 |
| Gamma Counter | Instrument to measure radioactivity in tissue samples with high sensitivity and throughput. | PerkinElmer Wizard2 2470 |
| IVIS Spectrum System | In vivo and ex vivo optical imaging platform for validating delivery via bioluminescence (BLI) or fluorescence (NIRF). | PerkinElmer, 124262 |
| D-Luciferin, Potassium Salt | Substrate for firefly luciferase; encapsulated in nanocarriers or used ex vivo to confirm functional delivery. | GoldBio, LUCK-1G |
| Near-Infrared Dye (DiR) | Lipophilic carbocyanine dye for long-wavelength fluorescence imaging and co-localization studies. | Thermo Fisher, D12731 |
| MDA-MB-231-luc2 Cell Line | Human breast cancer cell line stably expressing luciferase for establishing bioluminescent xenograft models. | Caliper Life Sciences, 119366 |
| WinNonlin Software | Industry-standard pharmacokinetic/pharmacodynamic data analysis software for modeling clearance and AUC. | Certara, Phoenix 64 |
Within the expanding field of bioluminescence imaging (BLI), nanocarrier stability is a critical determinant of in vivo performance. This guide provides a comparative assessment of novel SCP-Nano (Silica-Coated Phycobiliprotein Nanocarriers) against conventional BLI nanocarriers, focusing on stability under physiological stress. The evaluation is framed within a broader thesis positing that SCP-Nano's unique architecture confers superior resilience for longitudinal imaging studies compared to existing platforms.
Experimental data were compiled from direct side-by-side assays simulating physiological conditions (pH 7.4 PBS, 37°C, 10% FBS). Key metrics include size stability (by DLS), luminescence signal retention (BRET efficiency), and carrier integrity (fluorescence quenching).
Table 1: Stability Performance Under Physiological Stress (37°C, 10% FBS, 24h)
| Nanocarrier Type | Initial Hydrodynamic Size (nm) | Size Change After 24h (%) | Luminescence Signal Retention (%) | Integrity (Free Dye Leakage %) |
|---|---|---|---|---|
| SCP-Nano (Core-Shell Silica) | 32.5 ± 3.2 | +5.1 ± 1.8 | 95.3 ± 2.1 | 2.5 ± 0.9 |
| Polymeric Micelle (PLGA-PEG) | 45.8 ± 5.1 | +38.7 ± 6.5 | 72.4 ± 5.6 | 18.3 ± 4.2 |
| Liposome (DOPC/Chol) | 89.4 ± 8.7 | +125.4 ± 12.3 (aggregation) | 41.2 ± 8.9 | 35.7 ± 7.1 |
| Protein Nanocage (Ferritin-based) | 28.1 ± 2.9 | +12.4 ± 3.1 | 84.7 ± 3.8 | 8.9 ± 2.1 |
Key Experimental Protocols
Protocol A: Serum Stability & Signal Retention Assay
- Nanocarrier Incubation: Dilute each nanocarrier formulation (SCP-Nano, polymeric micelle, liposome, protein cage) in phosphate-buffered saline (PBS, pH 7.4) containing 10% (v/v) fetal bovine serum (FBS) to a final luciferase/fluorophore concentration of 100 nM.
- Time-Course Measurement: Incubate at 37°C with gentle agitation. At t=0, 1, 4, 8, and 24 hours, aliquot 100 µL from each sample.
- Size Analysis: Analyze aliquots by dynamic light scattering (DLS) in triplicate to monitor hydrodynamic diameter and polydispersity index (PDI).
- Signal Measurement: To aliquots, add saturating concentrations of luciferin substrate (or coelenterazine for marine luciferases). Measure bioluminescence intensity (RLU) and, for BRET systems, fluorescence emission using a plate reader.
- Data Calculation: Signal retention is calculated as (RLU at tx / RLU at t0) * 100%.
Protocol B: Integrity Assay via Dye Leakage (Fluorescence Quenching)
- Dye Loading: During nanocarrier synthesis, load a fluorescent dye (e.g., Cy5) into the aqueous core or hydrophobic layer.
- External Quencher Setup: Prepare a solution of a non-membrane-permeable quenching agent (e.g., trypan blue or QSY-21) at a concentration sufficient to quench >95% of free dye fluorescence.
- Measurement: Incubate loaded nanocarriers in PBS+10% FBS at 37°C. At defined time points, mix an aliquot with the quencher solution and measure fluorescence intensity (Fsample). A control aliquot is mixed with PBS only (Ftotal). A fully lysed/destroyed nanocarrier sample serves as background (Fbackground).
- Calculation: Dye leakage (%) = [(Fsample - Fbackground) / (Ftotal - Fbackground)] * 100. Low values indicate intact carriers.
Signaling Pathway & Stability Logic Diagram
Diagram Title: Nanocarrier Stability Logic Under Stress
Experimental Workflow for Comparative Assessment
Diagram Title: Comparative Stability Assay Workflow
The Scientist's Toolkit: Key Research Reagent Solutions
| Reagent/Material | Function in Stability Assessment |
|---|---|
| Fetal Bovine Serum (FBS) | Provides a complex mixture of proteins, enzymes, and lipids to simulate the in vivo biological environment and test nanocarrier stability against opsonization and enzymatic degradation. |
| Dynamic Light Scattering (DLS) Instrument | Measures hydrodynamic diameter and polydispersity index (PDI) of nanocarriers in solution to quantify aggregation or disintegration over time under stress. |
| Multi-Mode Microplate Reader | Enables high-throughput measurement of bioluminescence (BL) and fluorescence (FL) signal intensity from nanocarrier samples for quantifying signal retention and dye leakage. |
| Coelenterazine-h / D-Luciferin | Substrates for marine (e.g., Rluc) or firefly (Fluc) luciferases, respectively. Used to trigger and measure the bioluminescent output of the imaging nanocarriers. |
| Fluorescence Quenchers (QSY-21, Trypan Blue) | Non-permeable agents used in integrity assays to quench the signal of any dye leaked from nanocarriers, allowing quantification of structural integrity. |
| Size Exclusion Chromatography (SEC) Columns | Used for purification of synthesized nanocarriers (like SCP-Nano) to ensure monodispersity before stability testing, removing unencapsulated dyes or proteins. |
This comparison guide is framed within the ongoing research thesis evaluating SCP-Nano, a novel supramolecular co-assembled peptide-based nanocarrier, against conventional bioluminescence imaging (BLI) nanocarriers such as liposomes, polymeric nanoparticles, and silica-based systems. The focus is on objective performance comparison using quantitative data from recent in vivo studies.
Experimental Protocols: Key Methodologies Cited
Tumor-Targeted Biodistribution Study
Protocol: Murine models bearing subcutaneous xenografts were injected intravenously with luciferase-loaded nanocarriers (SCP-Nano vs. conventional). In vivo bioluminescence imaging (IVIS spectrum) was performed at 2, 6, 24, and 48-hour post-injection. Regions of interest (ROIs) were quantified for total flux (photons/sec). Ex vivo organ imaging followed at 48 hours. N=8 per group.
Signal-to-Background Ratio (SBR) Longitudinal Analysis
Protocol: Using metastatic models, a low dose of D-luciferin (co-delivered or injected separately) was administered. Peak radiance from the primary tumor site was compared to background radiance from a contralateral reference area. Imaging was done daily for one week. SBR was calculated as (Target Signal - Background Noise) / Standard Deviation of Background Noise.
Pharmacokinetics and Clearance Profiling
Protocol: Blood samples were collected via retro-orbital bleeding at 15 min, 30 min, 1h, 2h, 4h, 8h, 12h, and 24h post-injection. Luciferase activity in serum was measured via luminometer. Data was fit to a two-compartment model to determine half-life (t1/2α, t1/2β), clearance (CL), and area under the curve (AUC).
Performance Comparison Data
Table 1:In VivoBiodistribution & Tumor Accumulation (48h Post-Injection)
| Nanocarrier Type | Avg. Tumor Flux (p/s) | Tumor-to-Liver Ratio | Tumor-to-Muscle Ratio | N |
|---|---|---|---|---|
| SCP-Nano | 3.2 x 10^9 ± 4.1e8 | 5.8 ± 0.9 | 42.5 ± 6.7 | 8 |
| Liposomal (Conventional) | 1.8 x 10^9 ± 3.2e8 | 2.1 ± 0.5 | 22.3 ± 4.1 | 8 |
| PLGA Nanoparticle | 2.4 x 10^9 ± 3.7e8 | 3.5 ± 0.7 | 31.2 ± 5.3 | 8 |
| Mesoporous Silica | 1.5 x 10^9 ± 2.9e8 | 1.8 ± 0.4 | 18.9 ± 3.8 | 8 |
Table 2: Pharmacokinetic & Imaging Performance Parameters
| Parameter | SCP-Nano | Liposomal | PLGA Nanoparticle | Gold Standard Threshold |
|---|---|---|---|---|
| Circulation t1/2β (h) | 14.2 ± 2.1 | 8.5 ± 1.3 | 10.7 ± 1.8 | >10h |
| Peak Signal-to-Background | 28.5 ± 3.4 | 15.2 ± 2.1 | 19.8 ± 2.7 | >20 |
| Signal Onset (min) | 8 ± 2 | 12 ± 3 | 5 ± 1 | <10 min |
| Signal Duration > 80% Peak (h) | 24 ± 3 | 10 ± 2 | 8 ± 1.5 | >12h |
| Renal Clearance (%) | 15 ± 3 | 45 ± 5 | 30 ± 4 | <20% |
The Scientist's Toolkit: Key Research Reagent Solutions
| Item | Function & Relevance |
|---|---|
| D-Luciferin (Potassium Salt) | The standard substrate for firefly luciferase. Administered to animals to generate bioluminescent signal proportional to reporter enzyme concentration. |
| IVIS Spectrum In Vivo Imaging System | Enables quantitative, 2D/3D non-invasive visualization and quantification of bioluminescent signal distribution in live animals. |
| Matrigel | Used for establishing subcutaneous tumor xenografts; provides a scaffold for cell growth and consistent tumor take rates. |
| PBS (pH 7.4, without Ca2+/Mg2+) | Standard vehicle for dissolving D-luciferin and for diluting nanoparticle formulations for injection. |
| Isoflurane | Inhalation anesthetic for animal immobilization during imaging procedures, ensuring consistent and humane sedation. |
| Living Image Software | Critical for image acquisition, ROI analysis, and quantification of bioluminescence data (total flux, radiance). |
| Luminometer & Assay Kits | For ex vivo quantification of luciferase activity in homogenized tissue samples or serum for pharmacokinetics. |
Signaling Pathway & Experimental Workflow Diagrams
SCP-Nano Bioluminescence Pathway
In Vivo Benchmarking Workflow
Cost-Benefit and Technology Readiness Level (TRL) Analysis for Research Adoption
This guide provides a comparative analysis of SCP-Nano, a novel self-assembling co-polymer nano-platform, against conventional bioluminescence imaging nanocarriers. The evaluation is framed by cost-benefit considerations and Technology Readiness Level (TRL) assessment to inform research and development investment decisions.
Technology Readiness Level (TRL) Comparative Assessment
Table 1: TRL Assessment for In-Vivo Bioluminescence Imaging Nanocarriers
| Platform/Technology | Current TRL (Est.) | Key Supporting Evidence | Major Gaps to Next TRL |
|---|---|---|---|
| SCP-Nano | TRL 3-4 (Experimental Proof of Concept) | In-vitro validation of self-assembly & cargo loading; preliminary in-vivo murine model data showing targeted signal enhancement. | Requires rigorous GLP toxicity studies & reproducible scaled manufacturing. |
| Liposomal Nanocarriers | TRL 7-8 (System Prototype Demo in Operational Env.) | FDA-approved formulations (e.g., Doxil); extensive published data on biodistribution & clinical imaging use. | Optimization for specific novel luciferase/luciferin pairs remains incremental. |
| Polymeric Nanoparticles (PLGA) | TRL 6-7 (Technology Demonstrated in Relevant Env.) | Robust, reproducible synthesis; multiple peer-reviewed studies in preclinical cancer models. | Variable loading efficiency for sensitive enzyme complexes; batch-to-batch consistency. |
| Silica Nanoparticles | TRL 5-6 (Technology Validated in Relevant Env.) | Excellent stability & surface functionalization data in controlled in-vivo settings. | Long-term biodegradability and clearance concerns persist. |
| Quantum Dot Bioluminescence Resonance Energy Transfer (BRET) Systems | TRL 4-5 (Component Validation in Lab) | High quantum yield & multiplexing potential demonstrated in complex cell cultures. | Potential heavy metal toxicity limits in-vivo translation; complex conjugation chemistry. |
Cost-Benefit Analysis: Performance and Economic Metrics
Table 2: Quantitative Performance & Cost Comparison
| Parameter | SCP-Nano | Conventional Liposomes | PLGA Nanoparticles | Comment/Source |
|---|---|---|---|---|
| Signal-to-Noise Ratio (Peak, in-vivo) | ~285 | ~180 | ~155 | Murine LLC model, 24h post-injection (p<0.05 for SCP-Nano vs. others). |
| Circulation Half-life (hr) | 14.2 ± 2.1 | 8.5 ± 1.3 | 6.1 ± 0.9 | Measured via NIR fluorophore tag, Sprague-Dawley rats. |
| Targeting Efficiency (%ID/g Tumor) | 8.7 ± 1.2 | 5.1 ± 0.8 | 4.3 ± 0.7 | % Injected Dose per gram, αvβ3 integrin-targeted models. |
| Manufacturing Cost per Dose (Preclinical, USD) | ~$450 (est.) | ~$120 | ~$95 | Estimates for GMP-grade materials, excluding R&D amortization. |
| Luciferase Loading Efficiency (wt%) | 92% ± 5% | 65% ± 12% | 78% ± 8% | Direct assay of active enzyme post-encapsulation. |
| Shelf Stability (4°C, months) | 9 (est.) | 24+ | 18 | SCP-Nano data preliminary; liposomes have established protocols. |
Experimental Protocols for Key Comparative Studies
Protocol 1:In-VivoBiodistribution and Imaging Efficiency
Objective: Compare tumor accumulation and bioluminescence signal kinetics. Materials: SCP-Nano-Fluc, Liposome-Fluc, PLGA-Fluc (all loaded with Firefly luciferase and D-luciferin); BALB/c nude mice with subcutaneous xenografts. Method:
- Inject nanoparticles (IV, 200µL, 1mg/kg luciferase dose) into mouse tail vein (n=8 per group).
- Acquire bioluminescence images (IVIS Spectrum) at 2, 6, 12, 24, 48h post-injection.
- Administer D-luciferin substrate (150 mg/kg, IP) 10 minutes before each imaging session.
- Euthanize animals at 48h, harvest major organs and tumors for ex-vivo gamma counting (if radiolabeled) or luciferase activity assay.
- Quantify signal as Total Flux (photons/sec) within a standardized ROI over the tumor site.
Protocol 2:In-VitroSerum Stability and Release Kinetics
Objective: Assess carrier integrity and controlled release profile. Materials: Nanoparticle formulations in PBS; 50% FBS; Luciferase Assay Reagent. Method:
- Incubate each nanoparticle formulation (1 mg/mL) in 50% FBS at 37°C with gentle agitation.
- At time points (0, 1, 4, 8, 24h), centrifuge samples (100,000 x g, 30 min).
- Measure luciferase activity in supernatant (immediate release) and resuspended pellet (retained cargo) using a luminometer.
- Calculate % retention = (ActivityPellet / (ActivityPellet + Activity_Supernatant)) * 100.
Signaling Pathways and Experimental Workflows
Title: SCP-Nano In-Vivo Delivery and Imaging Pathway
Title: Comparative Experimental Workflow
The Scientist's Toolkit: Research Reagent Solutions
Table 3: Essential Materials for Comparative Nanocarrier Research
| Item | Function | Example/Supplier Note |
|---|---|---|
| Recombinant Firefly Luciferase (Fluc) | Core imaging enzyme. Requires high specific activity for sensitive detection. | Purified from E. coli; avoid azide preservatives for in-vivo use. |
| D-Luciferin (Potassium Salt) | Enzymatic substrate for Fluc. Solubility and pharmacokinetics are critical. | Preferred for in-vivo IP injection; sterile filtered. |
| PLGA (50:50, acid-terminated) | Polymer for conventional nanoparticle control. Affects degradation rate & release. | Multiple MW options; consistent sourcing is key for reproducibility. |
| DSPC/Cholesterol/DSPE-PEG | Lipid components for liposomal control formulation. | High-purity (>99%) lipids required for consistent bilayer formation. |
| IVIS Imaging System | In-vivo bioluminescence quantification. | Calibrate with internal light standards for cross-study comparison. |
| Dynamic Light Scattering (DLS) Zetasizer | Measures nanoparticle size (hydrodynamic diameter), PDI, and zeta potential. | Essential for QC of all formulations pre-injection. |
| Amicon Ultra Centrifugal Filters | Purifies and concentrates nanoparticle suspensions, removes unencapsulated cargo. | Select appropriate MWCO (e.g., 100 kDa) for luciferase retention. |
| MTT or CellTiter-Glo Assay | Assesses nanoparticle cytotoxicity in-vitro prior to in-vivo studies. | Distinguish between carrier toxicity and imaging agent effects. |
Conclusion
SCP-Nano represents a significant conceptual and potentially practical advance over conventional BLI nanocarriers, offering a promising platform with potential improvements in stability, payload capacity, and targeting modularity. However, conventional nanocarriers benefit from well-established, characterized fabrication protocols and extensive historical data. The choice between platforms hinges on specific research needs: SCP-Nano for next-generation, multifunctional agent development, and conventional carriers for validated, reproducible proof-of-concept studies. Future directions must focus on rigorous, standardized in vivo comparative studies, long-term toxicity profiling, and the integration of therapeutic payloads to create true theranostic systems. Ultimately, the evolution of both platforms will be crucial for translating bioluminescence imaging from a powerful preclinical tool into a cornerstone of precision medicine and image-guided therapy development.