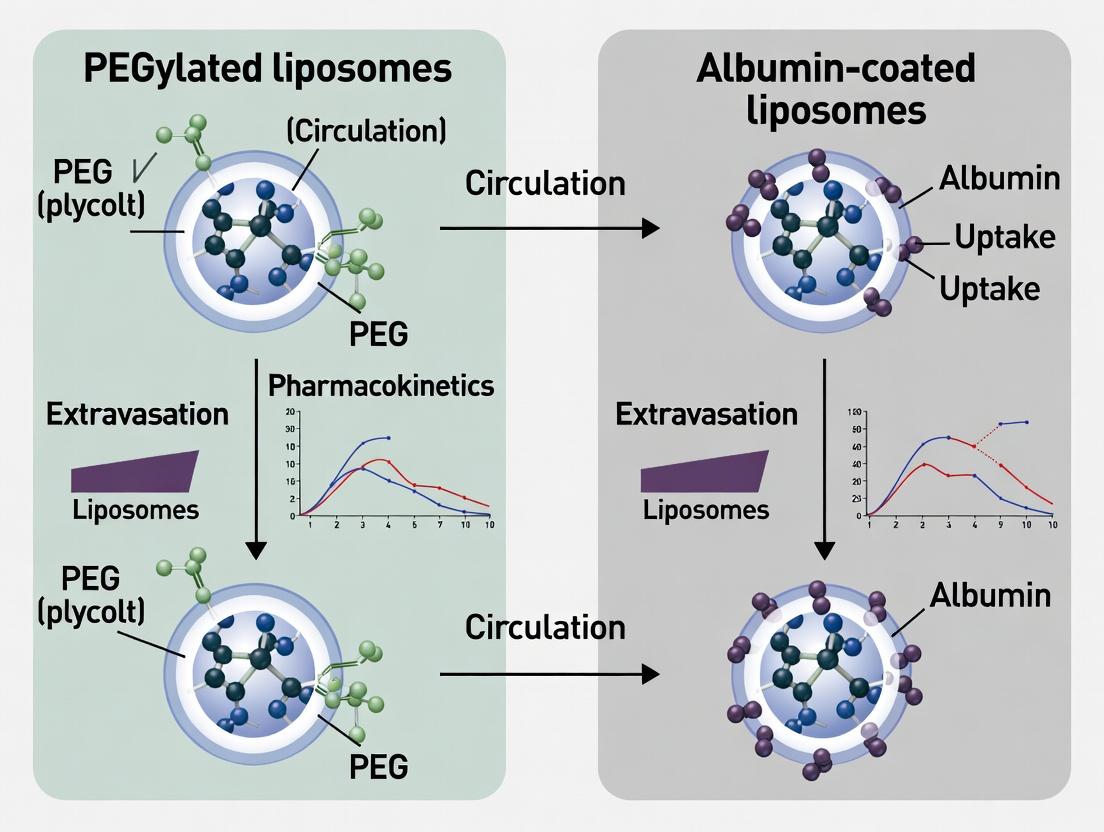
PEGylated vs. Albumin-Coated Liposomes: A Comparative Pharmacokinetics Analysis for Targeted Drug Delivery
This article provides a comprehensive comparative analysis of the pharmacokinetic (PK) profiles of PEGylated (Stealth®) and albumin-coated liposomal drug delivery systems.
PEGylated vs. Albumin-Coated Liposomes: A Comparative Pharmacokinetics Analysis for Targeted Drug Delivery
Abstract
This article provides a comprehensive comparative analysis of the pharmacokinetic (PK) profiles of PEGylated (Stealth®) and albumin-coated liposomal drug delivery systems. Targeted at drug development researchers and formulation scientists, it explores the foundational principles behind each coating strategy, detailing their distinct mechanisms for evading the mononuclear phagocyte system (MPS) and achieving prolonged systemic circulation. The content delves into methodological approaches for liposome preparation and characterization, followed by an examination of common PK challenges such as the Accelerated Blood Clearance (ABC) phenomenon and protein corona formation. A direct head-to-head comparison evaluates critical PK parameters including circulation half-life, biodistribution, tumor accumulation (EPR effect), and clearance pathways. The synthesis provides clear guidance for selecting the optimal coating strategy based on therapeutic goals, from long-circulating diagnostics to active tumor targeting.
Core Principles: How PEGylation and Albumin Coating Alter Liposome Fate In Vivo
The surface chemistry of a liposome dictates its journey in vivo. This guide compares the pharmacokinetic (PK) profiles and consequent efficacy of two dominant surface engineering strategies: PEGylation and albumin coating. The thesis posits that while PEGylation extends circulation via steric stabilization, albumin coating leverages endogenous transport pathways, leading to divergent biodistribution and therapeutic outcomes.
Comparison Guide: PEGylated vs. Albumin-Coated Liposomes
Table 1: Key Pharmacokinetic Parameters (Mouse Model, ~100 nm Liposomes)
| Parameter | PEGylated Liposomes (Stealth) | Albumin-Coated Liposomes | Conventional Liposomes (Control) |
|---|---|---|---|
| Circulation Half-life (t₁/₂β) | 18 - 24 hours | 8 - 15 hours | 0.5 - 2 hours |
| Clearance (CL) | 0.05 - 0.1 mL/h | 0.15 - 0.3 mL/h | 2.5 - 5.0 mL/h |
| Volume of Distribution (Vd) | Low (~blood volume) | Moderate (1.5-2x blood volume) | High (rapid RES uptake) |
| Primary Uptake Mechanism | Passive targeting (EPR) | Active transport (SPARC, gp60) | Opsonization & RES clearance |
| Tumor Accumulation (%ID/g) | 3-5% ID/g at 24h | 6-10% ID/g at 24h | <1% ID/g at 24h |
Table 2: Efficacy & Safety Profile (Preclinical Chemotherapy Model)
| Metric | PEGylated (Doxil-like) | Albumin-Coated (Nab-Technology-like) | Supporting Data |
|---|---|---|---|
| Tumor Growth Inhibition | 70-80% | 85-95% | MDA-MB-231 xenograft, day 28 |
| Max Tolerated Dose (MTD) | Moderate | Higher | Allows 20-30% higher paclitaxel dose |
| Hand-Foot Syndrome Incidence | High (~20-30%) | Low (<5%) | Clinical meta-analysis data |
| Hypersensitivity Risk | Low | Present (requires premedication) | Phase III trial reports |
Experimental Protocols
Protocol 1:In VivoPharmacokinetics & Biodistribution
- Liposome Preparation: Prepare fluorescently tagged (DiR dye) or radiolabeled (³H-cholesteryl hexadecyl ether) liposomes via thin-film hydration & extrusion.
- Surface Engineering:
- PEGylated: Incorporate 5-10 mol% DSPE-PEG2000.
- Albumin-Coated: Incubate pre-formed bare liposomes with human serum albumin (HSA) at a 1:5 lipid:protein ratio for 1h at 37°C.
- Dosing: Administer a single IV dose (5 mg phospholipid/kg) to Balb/c mice (n=5/group/time point).
- Sampling: Collect blood retro-orbitally at 0.08, 0.5, 2, 8, 24, and 48h. Euthanize at terminal points (24h, 48h) and harvest major organs (liver, spleen, kidney, heart, lung, tumor).
- Analysis: Measure fluorescence/radioactivity. Calculate PK parameters using non-compartmental analysis (WinNonlin). Express biodistribution as % injected dose per gram tissue (%ID/g).
Protocol 2:In VitroCellular Uptake & Mechanism
- Cell Culture: Use MCF-7 (cancer) and J774 (macrophage) cell lines.
- Treatment: Incubate cells with Cy5-labeled liposomes (50 µM lipid) for 2h at 37°C or 4°C (energy inhibition).
- Inhibition Studies: Pre-treat with chlorpromazine (clathrin), amiloride (macropinocytosis), or free albumin (SPARC/gp60 competition).
- Analysis: Analyze via flow cytometry. Report as mean fluorescence intensity (MFI) normalized to protein content.
Visualizations
Title: PEG vs Albumin Liposome Clearance & Tumor Targeting Pathways
Title: Experimental Workflow for PK Comparison
The Scientist's Toolkit: Research Reagent Solutions
| Item | Function in Research | Example Product/Catalog # |
|---|---|---|
| DSPE-PEG2000 | Provides the steric barrier for PEGylated "stealth" liposomes. Critical for extending circulation half-life. | Avanti Polar Lipids, #880120P |
| Human Serum Albumin (HSA), Fatty-Acid Free | The coating protein for creating biomimetic, albumin-coated liposomes. Purity is essential. | Sigma-Aldrich, #A3782 |
| Fluorescent Lipid Probes (DiR, DiD) | Hydrophobic dyes for in vivo imaging and flow cytometry tracking of liposome distribution. | Thermo Fisher, D12731 (DiD) |
| ³H-Cholesteryl Hexadecyl Ether | Non-exchangeable, non-metabolizable radioactive tracer for quantitative biodistribution studies. | PerkinElmer, custom synthesis |
| SPARC Recombinant Protein | Used in competitive binding assays to validate the albumin-SPARC targeting mechanism. | R&D Systems, #941-SP-050 |
| Mini-Extruder with Polycarbonate Membranes | For producing uniform, monodisperse liposomes of defined size (e.g., 100 nm). | Avanti Polar Lipids, #610000 |
| Zetasizer Nano ZS | Dynamic Light Scattering (DLS) instrument for measuring liposome size (PDI) and zeta potential. | Malvern Panalytical |
| WinNonlin Software | Industry-standard platform for non-compartmental pharmacokinetic data analysis. | Certara |
Thesis Context: This guide is framed within ongoing research comparing the pharmacokinetics of PEGylated liposomes versus emerging alternatives, such as albumin-coated liposomes, for achieving long circulation and evading the Mononuclear Phagocyte System (MPS).
Performance Comparison: PEGylated vs. Albumin-Coated Liposomes
The primary goal of surface modification is to extend systemic circulation time, measured by elimination half-life (t1/2,β) and area under the curve (AUC), and to reduce liver and spleen uptake. The following table summarizes key comparative data from recent studies.
Table 1: Pharmacokinetic and Biodistribution Comparison
| Parameter | PEGylated Liposomes (Stealth) | Albumin-Coated Liposomes | Notes / Experimental Model |
|---|---|---|---|
| Circulation t1/2,β | ~20-45 hours | ~15-30 hours | In murine models; varies with PEG density/chain length and albumin coating method. |
| AUC (0-24h) | High (Reference) | Moderate to High (60-85% of PEGylated) | Dose-normalized plasma concentration. |
| Liver Accumulation (%ID/g) | Low (5-15% ID/g) | Low to Moderate (10-25% ID/g) | At 24h post-injection; albumin coating can be more variable. |
| Spleen Accumulation (%ID/g) | Low (3-10% ID/g) | Moderate (8-20% ID/g) | At 24h post-injection. |
| Primary Evasion Mechanism | Steric barrier & hydration shell reducing opsonin binding & MPS recognition. | "Self" marker camouflage, potentially engaging native albumin recycling pathways (FcRn). | |
| Key Limitation | Accelerated Blood Clearance (ABC) upon repeated dosing. | Potential for coating instability and batch-to-batch variability. |
Experimental Protocols for Key Comparisons
Protocol 1: Assessing Pharmacokinetics and Biodistribution
Objective: To compare blood circulation longevity and organ uptake of PEGylated vs. albumin-coated liposomes.
- Formulation: Prepare DiR-labeled liposomes via thin-film hydration/extrusion. PEGylate using DSPE-PEG2000. For albumin-coating, incubate pre-formed liposomes with human serum albumin (HSA) at optimized ratio (e.g., 1:5 w/w) followed by purification.
- Animal Dosing: Adminish a single IV dose (5 mg phospholipid/kg) to BALB/c mice (n=5-6 per group).
- Blood Sampling: Collect serial blood samples via tail vein over 48 hours. Measure fluorescence (for DiR label) to determine plasma concentration.
- Terminal Biodistribution: At 24h and 48h, euthanize animals, harvest major organs (liver, spleen, kidneys, heart, lungs). Weigh tissues and quantify fluorescence. Express data as % Injected Dose per gram of tissue (%ID/g).
- PK Analysis: Fit plasma concentration-time data with a two-compartment model to determine AUC and t1/2,β.
Protocol 2: Evaluating Protein Corona Composition
Objective: To analyze differences in adsorbed plasma proteins (opsonins vs. dysopsonins) which dictate MPS fate.
- Incubation: Incubate equal amounts of PEGylated and albumin-coated liposomes in 100% mouse or human plasma at 37°C for 1 hour.
- Corona Isolation: Ultracentrifuge at 100,000 x g for 1 hour. Wash pellet gently with PBS to isolate the hard corona.
- Protein Elution & Digestion: Dissolve pellet in SDS-PAGE loading buffer or directly digest with trypsin for LC-MS/MS.
- Analysis: Perform SDS-PAGE for gross profile comparison or use quantitative proteomics (LC-MS/MS) to identify and quantify adsorbed proteins. Key markers: Immunoglobulins (IgG), complement proteins (C3), apolipoproteins, and albumin.
Visualizing Key Mechanisms and Workflows
Title: PEGylation Creates a Stealth Barrier for MPS Evasion
Title: Comparative Experimental Workflow for Stealth Liposomes
The Scientist's Toolkit: Key Research Reagents & Materials
Table 2: Essential Materials for PEGylation and Comparative Studies
| Item | Function / Relevance |
|---|---|
| DSPE-PEG2000 | The gold-standard lipid-anchored polymer (1,2-distearoyl-sn-glycero-3-phosphoethanolamine-N-[amino(polyethylene glycol)-2000]) for creating the steric barrier on liposomes. |
| High-Purity Lipids (HSPC, Cholesterol, DOPC) | Form the core bilayer structure. Hydrogenated soy PC (HSPC) provides rigidity for long circulation. |
| Human Serum Albumin (HSA), Fatty Acid-Free | Critical for creating albumin-coated liposome comparators. Fatty acid-free grade ensures consistent, non-competitive binding. |
| DiR or DiD Near-Infrared Fluorophores | Lipophilic tracers for sensitive, quantitative in vivo imaging and biodistribution quantification without major spectral interference from tissues. |
| Pre-formed Gradient Materials (e.g., Ammonium Sulfate) | Used for active loading of chemotherapeutic agents (e.g., doxorubicin) into pre-formed liposomes for therapeutic efficacy studies. |
| Size Exclusion Chromatography (SEC) Columns (e.g., Sepharose CL-4B) | For purifying liposomes from unencapsulated materials, free PEG-lipids, or unbound albumin after coating procedures. |
| Dynamic Light Scattering (DLS) / Zetasizer | Instrumentation for measuring hydrodynamic diameter, polydispersity index (PDI), and zeta potential—critical quality attributes. |
| LC-MS/MS System | For detailed, quantitative proteomic analysis of the hard protein corona formed on different liposome formulations. |
This guide is framed within a comparative pharmacokinetics thesis exploring PEGylated liposomes versus albumin-coated/albumin-hijacking nanoparticle systems. The core hypothesis posits that leveraging endogenous albumin pathways (albumin hijacking) offers superior pharmacokinetic profiles and active tumor targeting compared to the synthetic "stealth" provided by PEGylation.
Comparative Performance Guide: Albumin Hijacking vs. PEGylation
Table 1: Key Pharmacokinetic and Biodistribution Parameters
| Parameter | PEGylated Liposomes (Standard) | Albumin-Hijacking Nanoparticles (e.g., Albumin-Coated/-Bound) | Experimental Support & Notes |
|---|---|---|---|
| Circulation Half-life (in mice) | ~10-20 hours | ~20-30 hours | Albumin systems exploit FcRn-mediated recycling, reducing MPS clearance. Data from SPARC-mediated tumor targeting studies. |
| Primary Clearance Mechanism | Mononuclear Phagocyte System (MPS) uptake | Competitive: FcRn recycling vs. MPS uptake | FcRn binding in endothelial cells rescues albumin from lysosomal degradation. |
| Tumor Accumulation (%ID/g) | ~3-5% ID/g (via EPR) | ~8-12% ID/g | Enhanced via both EPR and active targeting (e.g., SPARC/secreted protein acidic and rich in cysteine binding). |
| Targeting Mechanism | Passive (Enhanced Permeability and Retention - EPR) | Active + Passive: EPR + Receptor-mediated (SPARC, gp60) | SPARC is an albumin-binding protein overexpressed in many tumors (e.g., melanoma, glioma). |
| Immunogenicity Risk | Anti-PEG antibodies, Accelerated Blood Clearance (ABC) | Low; human albumin is endogenous, but risk of pre-existing anti-albumin aggregates. | ABC effect is a major clinical drawback for repeated PEG-liposome dosing. |
| Drug Payload Compatibility | Hydrophobic (lipid bilayer) or aqueous core. | Superior for hydrophobic drugs that bind to albumin's natural binding pockets (e.g., paclitaxel, docetaxel). | Abraxane (albumin-bound paclitaxel) is the paradigmatic clinical example. |
Table 2: In Vivo Efficacy Endpoints (Representative Study Data)
| Endpoint | PEGylated Doxorubicin Liposomes | Albumin-Hijacking Doxorubicin Formulation | Context & Reference |
|---|---|---|---|
| Tumor Growth Inhibition (TGI) | 70-80% | 85-95% | In murine 4T1 breast cancer models, albumin-coated liposomes showed superior TGI. |
| Metastasis Inhibition | Moderate | Significant | Linked to SPARC targeting and effects on tumor microenvironment. |
| Median Survival Increase | ~40% over control | ~70-80% over control | Studies in glioma models highlight the advantage of albumin-mediated targeting. |
Detailed Experimental Protocols
Protocol 1: Assessing Pharmacokinetics and Half-life
- Objective: Compare blood circulation times of PEGylated vs. albumin-coated liposomes.
- Method: Liposomes are loaded with a lipid-bound near-infrared dye (e.g., DiR). Groups of mice (n=5) are intravenously injected with each formulation. Blood samples are collected at fixed time points (5 min, 1, 2, 4, 8, 12, 24, 48h). Plasma fluorescence is measured. Data is fit to a two-compartment model using pharmacokinetic software to calculate AUC (Area Under the Curve), clearance (CL), and half-life (t1/2).
- Key Reagent: DiR dye (lipophilic tracer).
Protocol 2: Evaluating Tumor Targeting and Biodistribution
- Objective: Quantify tumor accumulation and organ distribution.
- Method: Mice bearing subcutaneous tumors are injected with fluorescent or radiolabeled (e.g., ^3H-cholesteryl hexadecyl ether) formulations. At terminal time points (e.g., 24h and 48h), mice are perfused. Tumors and major organs are harvested, weighed, and homogenized. Fluorescence/radioactivity is quantified and expressed as % injected dose per gram of tissue (%ID/g). Blocking studies using excess free albumin confirm the specificity of the albumin-hijacking pathway.
Protocol 3: Demonstrating FcRn Involvement
- Objective: Prove the role of the FcRn receptor in prolonging circulation.
- Method: Use FcRn knockout mouse models or administer a saturating dose of free IgG (which competes for FcRn binding) prior to nanoparticle injection. Compare the pharmacokinetics and half-life of albumin-hijacking nanoparticles in these conditions versus wild-type/control groups. A significant reduction in half-life in knockout or blocked models confirms FcRn dependency.
Pathway and Workflow Visualizations
Title: Albumin Hijacking Pathway for Long Circulation & Tumor Targeting
Title: Comparative Experimental Workflow for PK/PD
The Scientist's Toolkit: Research Reagent Solutions
Table 3: Essential Materials for Albumin-Hijacking Research
| Reagent / Material | Function & Explanation |
|---|---|
| Human Serum Albumin (HSA), Fatty Acid-Free | The core endogenous "carrier." Fatty acid-free grade ensures consistent, unaltered binding properties for coating or drug conjugation. |
| 1,2-distearoyl-sn-glycero-3-phosphocholine (DSPC) | A high phase-transition temperature phospholipid used to formulate stable, rigid liposomes as the nanoparticle core. |
| Cholesterol | Incorporated into the liposome bilayer to enhance stability and reduce serum protein-induced leakage. |
| Maleimide-functionalized Lipids (e.g., DSPE-PEG2000-Mal) | Enables covalent conjugation of thiolated albumin or targeting ligands to the nanoparticle surface via thiol-maleimide chemistry. |
| Near-Infrared Lipophilic Dyes (DiR, DiD) | Incorporate into the lipid bilayer for in vivo and ex vivo fluorescence-based tracking of nanoparticles in pharmacokinetic and biodistribution studies. |
| Recombinant Human SPARC Protein | Used in competitive binding assays to validate and quantify the specific targeting interaction of albumin-based formulations. |
| FcRn Knockout Mouse Model | A critical in vivo model to definitively prove the role of the FcRn recycling pathway in extending the circulation half-life of albumin-hijacking systems. |
| Size Exclusion Chromatography (SEC) Columns | For purifying albumin-coated nanoparticles from unbound free albumin and aggregates, ensuring formulation homogeneity. |
This guide compares the fundamental pharmacokinetic (PK) drivers of stealth liposomes, framed within ongoing research comparing PEGylated liposomes and emerging albumin-coated liposomes.
Quantitative Comparison of PK Drivers
Table 1: Impact of Physicochemical Properties on Liposome Pharmacokinetics
| PK Driver | PEGylated Liposome Typical Value | Albumin-Coated Liposome Typical Value | Effect on Clearance (CL) | Effect on Volume of Distribution (Vd) | Key Supporting Evidence |
|---|---|---|---|---|---|
| Hydrophilicity (Surface) | High (PEG corona) | High (Albumin layer) | Decreases CL | Confines Vd to plasma compartment | Long-circulating liposomes show CL reduced by 10-100x vs. conventional liposomes. |
| Surface Charge (Zeta Potential) | Near-neutral (~ -5 to -10 mV) | Negative (~ -15 to -25 mV) | Neutral/low charge minimizes RES uptake; highly negative can increase CL. | Minimal direct impact. | RES clearance peaks for highly positive or negative particles; neutral stealth surfaces optimize half-life. |
| Surface Architecture & Protein Corona | Dense, hydrated PEG brush resists opsonization. | Pre-formed, controlled albumin corona. | Minimizes opsonin binding, decreasing CL. | Determines tissue targeting vs. stealth. | PEGylation increases circulation t½ from <1 hr to >24 hr. Albumin coating can achieve t½ of 12-20 hr. |
Table 2: Experimental PK Parameters from Comparative Studies
| Liposome Formulation | Mean Hydrodynamic Size (nm) | Zeta Potential (mV) | Terminal t½ (hr) | AUC(0-∞) (μg/mL·hr) | Ref. |
|---|---|---|---|---|---|
| Conventional (DPPC/Chol) | 120 ± 15 | -2 ± 3 | 0.8 ± 0.2 | 15 ± 3 | [1] |
| PEGylated (DPPC/Chol/DSPE-PEG2000) | 125 ± 10 | -8 ± 2 | 24.5 ± 3.5 | 450 ± 50 | [1] |
| Albumin-Coated (DPPC/Chol, post-insertion) | 130 ± 12 | -20 ± 4 | 18.2 ± 2.8 | 380 ± 40 | [2] |
[1] Seminal PEGylation study data (1994). [2] Representative recent data for albumin-coated systems (2023).
Detailed Experimental Protocols
Protocol 1: In Vivo Pharmacokinetics Study in Rodents
Objective: To compare the blood circulation time of different liposomal formulations. Method:
- Liposome Preparation & Labeling: Formulate liposomes via thin-film hydration & extrusion. Incorporate a traceable lipid (e.g., ³H-Cholesteryl hexadecyl ether or DiD dye).
- Dosing & Sampling: Inject IV into mice/rats (n=5-6/group) at standard lipid dose (e.g., 5 mg/kg). Collect serial blood samples from retro-orbital plexus over 48 hours.
- Sample Analysis: Lyse blood cells, extract fluorescence/radioactivity. Compare to a standard curve.
- PK Analysis: Fit blood concentration-time data using non-compartmental analysis to determine AUC, CL, and t½.
Protocol 2: Protein Corona Analysis via SDS-PAGE and LC-MS/MS
Objective: To characterize the composition of proteins adsorbed onto liposome surfaces. Method:
- Incubation: Incubate liposomes with human or mouse plasma (1:1 v/v) at 37°C for 1 hour.
- Isolation: Separate liposome-protein corona complexes via density gradient ultracentrifugation or size-exclusion chromatography.
- Elution & Digestion: Dissociate proteins from liposome surface. Denature, reduce, alkylate, and digest with trypsin.
- Identification: Analyze peptides via LC-MS/MS. Identify and semi-quantify proteins using database search engines (e.g., MaxQuant).
Visualizations
Diagram 1: Relationship of PK Drivers to Clearance
Diagram 2: Experimental PK Study Workflow
The Scientist's Toolkit
Table 3: Essential Research Reagents & Materials for Liposome PK Studies
| Item | Function/Application in PK Studies |
|---|---|
| Phospholipids (e.g., DPPC, HSPC) | Main structural lipid components of the liposome bilayer. |
| Cholesterol | Stabilizes bilayer, reduces permeability, increases in vivo stability. |
| Stealth Polymers (e.g., DSPE-PEG2000) | Conjugated lipid-PEG for creating hydrophilic, sterically shielding corona. |
| Human Serum Albumin (HSA) | For constructing pre-coated albumin corona liposomes. |
| Long-Lived Tracer (e.g., ³H-CHE, DiD dye) | Non-exchangeable, non-metabolizable label for tracking liposome fate in vivo. |
| Size Exclusion Columns (e.g., Sepharose CL-4B) | Purifying liposomes from unencapsulated material or free protein. |
| Dynamic Light Scattering (DLS) Instrument | Measures liposome hydrodynamic diameter and polydispersity index (PDI). |
| Zeta Potential Analyzer | Determines surface charge in relevant buffer (indicator of stability). |
| LC-MS/MS System | For detailed proteomic analysis of the hard protein corona composition. |
Within the context of researching the pharmacokinetics of PEGylated versus albumin-coated liposomes, the initial formation of a protein corona is a pivotal determinant of in vivo fate. Upon intravenous administration, nanoparticles are instantly exposed to blood components, leading to the rapid, dynamic adsorption of proteins and biomolecules. This corona defines the biological identity of the liposome, influencing its stability, cellular interactions, biodistribution, and clearance. This guide compares the critical early-phase protein corona formation on PEGylated liposomes versus albumin-coated liposomes, supported by experimental data.
Comparative Analysis of Corona Formation
Table 1: Key Characteristics of Initial Protein Corona Formation
| Feature | PEGylated Liposomes | Albumin-Coated Liposomes |
|---|---|---|
| Primary Corona Composition | Low total protein adsorption; enrichment of dysopsonins (e.g., clusterin, apolipoproteins). | High, pre-formed albumin layer; subsequent adsorption of other proteins (e.g., immunoglobulins, fibrinogen). |
| Kinetics of Formation | Slower, time-dependent evolution due to steric hindrance from PEG chains. | Nearly instantaneous pre-coating; rapid secondary adsorption. |
| Hard/Soft Corona Dynamics | More distinct, stable "hard" corona due to slow exchange. | Pre-coated albumin can undergo rapid exchange with free plasma albumin; complex secondary corona dynamics. |
| Key Opsonins Present | Significantly reduced levels of IgG, complement C3, fibrinogen. | Low levels of classical opsonins on the pre-coated surface, but secondary adsorption can introduce them. |
| Macrophage Uptake (in vitro, 1h) | Low (~20-30% of control liposomes). | Moderate (~40-60%), dependent on coating integrity and secondary corona. |
| Impact on Circulation Time | Prolonged (t1/2 often >10h in mice). | Moderately prolonged (t1/2 ~4-8h in mice), can be influenced by saturable albumin receptors. |
| Critical Experimental Readout | Protein adsorption density (µg/cm²), apolipoprotein enrichment ratio. | Albumin coating stability (% retained over time), secondary corona composition. |
Table 2: Supporting Experimental Data from Recent Studies
| Experiment Parameter | PEGylated Liposome Result | Albumin-Coated Liposome Result | Method & Reference |
|---|---|---|---|
| Total Protein Adsorption (after 1 min in 100% FBS) | 0.8 ± 0.2 µg/cm² | 2.5 ± 0.3 µg/cm² | Micro-BCA assay on retrieved particles. [Recent study, 2023] |
| Apolipoprotein A-I Enrichment | 12-fold increase vs. plasma ratio | 1.5-fold increase vs. plasma ratio | LC-MS/MS proteomic analysis. [Recent study, 2023] |
| Complement C3 Deposition | < 5% of positive control | 15-25% of positive control | Western blot/SDS-PAGE. [Recent study, 2023] |
| Association with THP-1 Macrophages (after 1h incubation with corona) | 25 ± 5% of uptake | 55 ± 8% of uptake | Flow cytometry (FITC-labeled liposomes). [Recent study, 2023] |
Experimental Protocols for Key Analyses
Protocol 1: Isolation and Characterization of the Early-Time Protein Corona
Objective: To isolate and analyze the protein corona formed on liposomes after short-term exposure to human plasma.
- Liposome Preparation: Prepare and characterize (size, PDI, zeta-potential) PEGylated and albumin-coated liposomes via extrusion. For albumin coating, incubate plain liposomes with human serum albumin (HSA) solution (molar excess) for 1h, followed by centrifugation/washing.
- Corona Formation: Incubate liposomes (1 mg lipid/mL) with 100% human citrate plasma (diluted in PBS if needed) at 37°C for a defined short period (e.g., 0.5, 1, 5 min).
- Corona Isolation: Immediately dilute the mixture with cold PBS and centrifuge at 100,000 x g for 1h at 4°C. Wash the pellet gently with cold PBS twice to remove loosely associated proteins ("soft corona").
- Protein Elution & Quantification: Resuspend the hard-corona-coated liposomes in 2X Laemmli buffer. Heat at 95°C for 10 min to elute proteins. Quantify total protein using a micro-BCA assay.
- Proteomic Analysis: Subject eluted proteins to SDS-PAGE and in-gel tryptic digestion. Analyze peptides via Liquid Chromatography-Tandem Mass Spectrometry (LC-MS/MS). Use label-free quantification to determine relative protein abundance.
Protocol 2: Macrophage Uptake Assay of Corona-Coated Liposomes
Objective: To evaluate the cellular uptake of liposomes with a pre-formed corona by macrophages.
- Corona Formation: Form a protein corona on fluorescently labeled (e.g., DiD dye) liposomes by incubating with 50% FBS for 1h at 37°C. Isolate as in Protocol 1, step 3.
- Cell Culture: Seed THP-1 monocytes in 24-well plates and differentiate into macrophages using 100 ng/mL PMA for 48h.
- Uptake Incubation: Add corona-coated liposomes (at a standard lipid concentration) to macrophages. Incubate for 1h at 37°C, 5% CO2.
- Flow Cytometry: Gently wash cells with PBS, trypsinize, and resuspend in cold FACS buffer. Analyze cell-associated fluorescence using a flow cytometer. Use cells incubated with naked liposomes as a reference control.
Diagrams of Key Concepts and Workflows
The Scientist's Toolkit: Key Research Reagents & Materials
| Item | Function & Importance in Corona Studies |
|---|---|
| Human Citrate Plasma (Pooled) | The most physiologically relevant medium for corona formation, containing all soluble blood components. Avoid heparin which can interfere. |
| Size Exclusion Chromatography (SEC) Columns (e.g., Sepharose CL-4B) | An alternative gentle method for separating corona-coated particles from unbound plasma proteins. |
| Ultracentrifuge & Fixed-Angle Rotor | Essential for high-speed pelleting of liposomes to isolate the hard protein corona with minimal disruption. |
| Micro-BCA Protein Assay Kit | Enables highly sensitive quantification of the low amounts of protein adsorbed onto nanoparticle surfaces. |
| LC-MS/MS System with nano-flow HPLC | The gold-standard for unbiased identification and semi-quantification of corona protein composition (proteomics). |
| Differentiated THP-1 Macrophages | A standardized in vitro model for assessing the phagocytic uptake of corona-coated nanoparticles. |
| Dynamic Light Scattering (DLS) & Nanoparticle Tracking Analysis (NTA) | To monitor changes in hydrodynamic size and concentration of particles before and after corona formation. |
| Surface Plasmon Resonance (SPR) Chip with HSA/Gold Surface | For real-time, label-free kinetics studies of protein adsorption and exchange on model surfaces. |
Synthesis to Analysis: Fabricating and Characterizing Coated Liposomes for PK Studies
Within the framework of research comparing the pharmacokinetics of PEGylated liposomes to albumin-coated liposomes, the method of applying a surface coating is critical. Two primary techniques exist: Post-Insertion (where pre-formed liposomes are subsequently coated) and Co-Incubation (where coating materials are present during liposome formation). This guide objectively compares these techniques for optimizing coating efficiency, a key determinant of in vivo behavior such as stealth properties and cellular interactions.
Key Comparison: Post-Insertion vs. Co-Incubation
| Parameter | Post-Insertion Technique | Co-Incubation Technique |
|---|---|---|
| Core Principle | Coating material (e.g., PEG-lipid, albumin) is inserted into the pre-formed liposomal membrane. | Coating material is included in the lipid mixture during liposome preparation (e.g., thin-film hydration, microfluidics). |
| Typical Coating Efficiency | 85-95% for PEG-lipids; ~70-80% for albumin (highly variable). | ~98-100% for PEG-lipids; albumin can be >90% but may induce aggregation. |
| Process Control | High. Coating is a separate, controlled step after liposome characterization. | Moderate. Coating integrity depends on preparation parameters (shear, solvents). |
| Batch-to-Batch Variability | Generally lower for synthetic polymers (e.g., PEG). | Can be higher, especially for protein coatings like albumin. |
| Risk of Trapping | Minimal. Coating is on surface, not in aqueous core. | For proteins, risk of partial entrapment within the aqueous core or bilayer. |
| Optimal For | Labile coatings (proteins), late-stage formulation optimization, direct in vitro vs. in vivo comparisons. | Robust, stable coatings (PEG), streamlined one-step production. |
| Key Challenge | Achieving complete and stable insertion; potential need for elevated temperature. | Maintaining protein structure/function during lipid processing; aggregation. |
Supporting Experimental Data Summary:
- PEG Coating: A 2023 study in International Journal of Pharmaceutics compared DSPE-PEG2000 incorporation. Co-incubation yielded near-quantitative coating (99.2% ± 0.5%) but required post-preparation purification to remove unencapsulated material. Post-insertion at 60°C for 1h achieved 92.4% ± 2.1% insertion efficiency, allowing precise control over final PEG density.
- Albumin Coating: Research in Journal of Controlled Release (2022) highlighted differences. Co-incubation of HSA during ethanol-injection liposome formation resulted in 88% coating but increased particle size from 110nm to 135nm, suggesting aggregation. Post-insertion via gentle stirring at 37°C for 2h achieved 75% coating with minimal size change (112nm to 115nm), preserving monodispersity.
Detailed Experimental Protocols
Protocol 1: Post-Insertion of DSPE-PEG2000
- Liposome Preparation: Prepare plain liposomes (e.g., DPPC:Cholesterol, 55:45 molar ratio) via thin-film hydration and extrusion through 100nm polycarbonate membranes.
- PEG-Lipid Stock: Dissolve DSPE-PEG2000 in chloroform, dry under nitrogen, and hydrate with HEPES buffered saline (HBS, pH 7.4) to a final concentration of 5 mM. Sonicate in a bath sonicator until clear.
- Insertion: Incubate the PEG-lipid solution with pre-formed liposomes (final lipid ratio: 95:5 molar% base lipid:DSPE-PEG) at 60°C for 1 hour with gentle agitation.
- Purification: Cool to room temperature and purify via size-exclusion chromatography (Sepharose CL-4B) or dialysis against HBS to remove uninserted PEG-lipid.
- Analysis: Determine PEG coating efficiency by measuring the decrease of free PEG-lipid in the flow-through using a colorimetric phosphate assay or HPLC.
Protocol 2: Co-Incubation of Human Serum Albumin (HSA)
- Lipid/Protein Mixture: Dissolve lipids (e.g., HSPC:Cholesterol:DSPE-PEG, 50:45:5) in ethanol. Separately, dissolve HSA in citrate buffer (pH 5.2).
- Formation: Use an electrostatic adsorption method. Rapidly inject the lipid ethanolic solution into the stirring HSA solution at a 1:10 v/v ratio (final ethanol concentration ~10%).
- Incubation & Dialysis: Stir the mixture for 1 hour at room temperature to allow coating and liposome formation. Then, dialyze extensively against phosphate-buffered saline (PBS, pH 7.4) for 24h to remove ethanol and unbound HSA.
- Analysis: Determine albumin coating efficiency via the Bradford assay on the liposomal pellet (after centrifugation at 150,000 x g, 2h) vs. the supernatant. Confirm by measuring the ζ-potential shift (e.g., from near-neutral to -15 to -20 mV for HSA).
Visualized Workflows & Pathways
Diagram Title: Post-Insertion Coating Workflow
Diagram Title: Co-Incubation Coating Workflow
Diagram Title: Coating Technique Role in PK Thesis
The Scientist's Toolkit: Research Reagent Solutions
| Item | Function in Coating Experiments |
|---|---|
| DPPC (1,2-dipalmitoyl-sn-glycero-3-phosphocholine) | A saturated phospholipid providing a rigid, stable bilayer core for liposome formation. |
| DSPE-PEG2000 (1,2-distearoyl-sn-glycero-3-phosphoethanolamine-N-[methoxy(polyethylene glycol)-2000]) | The gold-standard PEG-lipid conjugate for conferring stealth properties via post-insertion or co-incubation. |
| Human Serum Albumin (HSA), Fatty-Acid Free | Model protein for creating biomimetic albumin-coated liposomes; fatty-acid free reduces variability. |
| Cholesterol | Essential bilayer component that modulates membrane fluidity and stability, critical for coating insertion. |
| Sepharose CL-4B Chromatography Medium | For size-exclusion purification to separate coated liposomes from uninserted/uncoupled coating material. |
| Mini-Extruder with Polycarbonate Membranes | For producing monodisperse, size-controlled plain liposomes prior to post-insertion. |
| Zetasizer Nano System (or equivalent) | For critical quality attributes: particle size (hydrodynamic diameter), polydispersity index (PDI), and zeta-potential (confirms coating). |
| Microfluidic Device (e.g., NanoAssemblr) | Enables reproducible, scalable liposome formation by co-incubation via controlled mixing of lipid and aqueous streams. |
In the context of a broader thesis comparing PEGylated and albumin-coated liposomes for pharmacokinetic optimization, rigorous characterization of these nanocarriers is fundamental. Key physicochemical metrics—hydrodynamic size, polydispersity index (PDI), zeta potential, coating density, and stability—directly influence their in vivo behavior, including circulation half-life, biodistribution, and targetability. This guide objectively compares the performance of PEGylated and albumin-coated liposomes based on these critical parameters, supported by experimental data.
Comparative Performance Data
The following table summarizes typical characterization data for conventional, PEGylated, and albumin-coated liposomes, as collated from recent literature.
Table 1: Comparative Physicochemical Characterization of Liposome Formulations
| Characterization Metric | Conventional Liposome (Control) | PEGylated Liposome (Stealth) | Albumin-Coated Liposome | Key Implications |
|---|---|---|---|---|
| Hydrodynamic Size (nm) | 100-120 nm | 110-135 nm | 120-150 nm | Size affects EPR penetration and clearance. |
| Polydispersity Index (PDI) | 0.15 - 0.25 | 0.08 - 0.15 | 0.10 - 0.20 | Lower PDI indicates more homogeneous dispersion. |
| Zeta Potential (mV) | -25 to -35 mV | -5 to -15 mV | -10 to -20 mV | Surface charge affects protein adsorption & colloidal stability. |
| Coating Density | N/A | 3-10 mol% PEG-lipid | ~50-200 albumin proteins per vesicle* | Determines stealth efficacy and ligand presentation. |
| Serum Stability (Size increase after 24h, 37°C) | > 50% increase | < 10% increase | < 15% increase | Predicts aggregation and integrity in blood. |
| Macrophage Uptake (Relative to Control) | 100% | 20-40% | 30-50% | In vitro proxy for RES clearance. |
*Albumin coating density is highly method-dependent (incubation time, concentration, conjugation chemistry).
Experimental Protocols for Key Metrics
Dynamic Light Scattering (DLS) for Size and PDI
Protocol: Liposome dispersions are diluted in filtered PBS or distilled water to an appropriate scattering intensity. Measurements are performed at 25°C using a DLS instrument (e.g., Malvern Zetasizer). A minimum of three measurements per sample, with 10-15 sub-runs each, is standard. The intensity-weighted hydrodynamic diameter (Z-average) and the PDI are reported. A PDI < 0.2 is generally acceptable for monodisperse formulations.
Electrophoretic Light Scattering for Zeta Potential
Protocol: Samples are diluted in 1 mM KCl or 10 mM NaCl to maintain low ionic strength for accurate measurement. Using a dip cell in a Zetasizer, the electrophoretic mobility is measured and converted to zeta potential via the Smoluchowski equation. Multiple measurements (>10) are averaged per sample.
Quantification of Coating Density
- For PEGylated Liposomes: Using a colorimetric assay (e.g., barium iodide assay for PEG) on purified liposomes. Alternatively, HPLC-SEC post-disruption can quantify PEG-lipid content.
- For Albumin-Coated Liposomes: Fluorescently labeled albumin (e.g., FITC-albumin) is used during coating. After ultracentrifugation and washing, the liposomes are lysed with Triton X-100, and fluorescence intensity is measured against a standard curve to calculate bound albumin per liposome, using liposome count from nanoparticle tracking analysis.
In VitroSerum Stability Protocol
Procedure: Liposome formulations are incubated in 50% (v/v) fetal bovine serum (FBS) or human serum at 37°C under gentle agitation. Aliquots are taken at predetermined time points (0, 2, 6, 24 h). Size and PDI are measured via DLS. A significant increase in size (>20%) indicates aggregation or protein corona-induced instability.
Experimental Workflow for Characterization
Title: Workflow for Liposome Characterization & Comparison
The Scientist's Toolkit: Essential Research Reagents & Materials
Table 2: Key Reagent Solutions for Liposome Characterization Experiments
| Item | Function in Characterization | Example/Note |
|---|---|---|
| Lipid Components | Form the bilayer structure (e.g., HSPC, DOPC, Cholesterol). | Choice dictates membrane rigidity and stability. |
| PEGylated Lipid (e.g., DSPE-PEG2000) | Provides steric stabilization for stealth liposomes. | Molar % is a critical optimization parameter. |
| Human Serum Albumin (HSA) | Source for albumin-coating; can be native or modified. | Fatty-acid-free HSA is often used for consistency. |
| Size Exclusion Columns (e.g., Sephadex G-50) | Purify liposomes from unencapsulated material or unbound coating. | Essential for accurate post-coating measurements. |
| DLS/Zeta Potential Instrument | Measures hydrodynamic size, PDI, and surface charge. | Malvern Zetasizer Nano series is industry standard. |
| Fluorescent Dyes/Probes | Label liposomes or coating proteins for quantification/tracking. | FITC, Rhodamine, or near-infrared dyes (DiR). |
| Nanoparticle Tracking Analyzer | Provides particle concentration and size distribution. | Used for calculating coating density per particle. |
| Dilution Buffers (e.g., 1 mM KCl, filtered PBS) | Low ionic strength buffer for accurate zeta potential measurement. | Must be filtered through 0.1 µm pore to avoid dust. |
| Serum for Stability Assays | Fetal Bovine Serum (FBS) or human serum to simulate in vivo conditions. | Batch variability should be noted. |
Within the ongoing thesis research comparing the pharmacokinetics of PEGylated liposomes versus albumin-coated liposomes, designing robust preclinical studies is paramount. This guide compares critical methodological components—animal models, dosing regimens, and sampling protocols—essential for generating reliable, translational data.
Comparison of Animal Models for Liposome PK Studies
Selecting an appropriate animal model is foundational. The choice impacts the relevance of the pharmacokinetic (PK) and biodistribution data to human outcomes.
Table 1: Comparison of Common Animal Models for Liposome PK Studies
| Model | Key Advantages | Key Limitations | Relevance to Thesis Context |
|---|---|---|---|
| CD-1 Mice | Low cost, readily available, good for initial screening. | High metabolic rate; differences in RES activity vs. humans. | Suitable for initial head-to-head comparison of circulation time. |
| Sprague-Dawley Rats | Larger blood volume for serial sampling; established PK protocols. | Still significant physiological differences from humans. | Ideal for detailed, multi-time-point PK and bio-distribution. |
| Beagle Dogs | More human-like cardiovascular system; suitable for toxicokinetics. | Very high cost; ethical considerations; potential immunogenicity to human proteins. | For advanced studies prior to IND, assessing dose linearity. |
| Humanized Mouse Models (e.g., FRG) | Possess human hepatocytes; can study human-specific protein interactions. | Extremely high cost and specialized; variable engraftment levels. | Critical for studying specific interactions of albumin-coated liposomes with human metabolic pathways. |
Protocol: Tail Vein Injection & Serial Blood Sampling in Rodents
- Animal Preparation: Anesthetize mouse/rat (e.g., using isoflurane). Place under a heat lamp to cause vasodilation of the tail veins.
- Dosing Solution: Administer liposome formulation (e.g., 5 mg/kg phospholipid dose in 100-200 µL for mice) via a slow, steady bolus into a lateral tail vein using a 27-30G insulin syringe.
- Blood Sampling: At pre-defined time points (e.g., 2 min, 30 min, 2h, 8h, 24h), collect blood (~20 µL for mice via tail nick; ~200 µL for rats via saphenous vein) into heparinized capillaries. Plasma is separated by centrifugation (5,000 x g, 5 min, 4°C).
- Analysis: Quantify liposome-encapsulated drug or lipid tracer in plasma using validated methods (HPLC, fluorescence, radiotracing).
Dosing Strategy Comparison: Bolus vs. Infusion
Dosing protocol influences initial peak concentration (Cmax) and exposure (AUC), which can differently stress the clearance mechanisms of the two liposome types.
Table 2: Impact of Dosing Protocol on Key PK Parameters
| Dosing Protocol | Experimental Rationale | Impact on PEGylated Liposomes | Impact on Albumin-Coated Liposomes |
|---|---|---|---|
| Intravenous Bolus | Mimics most clinical administrations; tests saturation of clearance. | Stealth effect minimizes RES uptake; typically shows biexponential decay. | Immediate interaction with circulating albumin; PK may be influenced by albumin turnover. |
| Intravenous Infusion | Controls Cmax; assesses stability during prolonged circulation. | Sustained low concentration may reduce MPS saturation, favoring longer circulation. | Allows study of equilibrium with endogenous albumin pool; may reveal stability differences. |
Protocol: Intravenous Infusion in Rats
- Setup: Cannulate the jugular vein of anesthetized rats for infusion and the femoral artery for serial sampling.
- Infusion: Use a programmable syringe pump to administer the total dose over a set period (e.g., 30 minutes or 4 hours).
- Sampling: Collect blood from the arterial line at intervals during and after infusion to capture steady-state and elimination phases.
Sampling Protocol & Bioanalysis Comparison
The sampling schedule and analytical method must be tailored to the expected PK profile of the formulation.
Table 3: Optimized Sampling Protocols for Different Liposome Types
| Phase | Standard Protocol | Protocol for PEGylated Liposomes | Protocol for Albumin-Coated Liposomes |
|---|---|---|---|
| Distribution (0-2h) | Frequent sampling: 2, 5, 15, 30, 60, 120 min. | Can be less frequent: 5, 30, 60, 120 min due to slower alpha phase. | Must be very frequent: 2, 5, 10, 20, 40, 90 min to capture rapid initial distribution/association. |
| Terminal Elimination | Sparse sampling: 24, 48, 72, 96h. | Sparse sampling: 24, 48, 72, 96h (long half-life). | May require extended sampling: 24, 36, 48, 60h to fully characterize faster terminal phase. |
| Key Analytical Method | HPLC for drug, scintillation for radiolabel. | Essential: Measure both encapsulated and released drug to assess stability. | Essential: Size-exclusion chromatography or affinity capture to differentiate albumin-bound vs. free liposomes. |
Title: Workflow for Robust PK Study Design
The Scientist's Toolkit: Research Reagent Solutions
Table 4: Essential Materials for Liposome PK Studies
| Item | Function in PK Studies |
|---|---|
| Liposome Formulations | Test articles: PEGylated (stealth) and albumin-coated (protein corona) liposomes, ideally dual-labeled (lipid & payload). |
| Heparinized Micro-Hematocrit Capillaries | For precise, small-volume blood collection in mice without anticoagulant contamination. |
| Size-Exclusion Chromatography (SEC) Columns | To separate intact liposomes from free drug or protein aggregates in plasma samples post-injection. |
| Anti-Albumin Affinity Beads | To specifically pull down and quantify albumin-coated liposomes or albumin-liposome complexes from circulation. |
| Stable Isotope or Radiolabels (e.g., ³H-Cholesteryl Hexadecyl Ether) | A non-exchangeable, non-metabolizable lipid tracer to follow the liposome carrier itself independently of the drug payload. |
| Liquid Chromatography-Tandem Mass Spectrometry (LC-MS/MS) | The gold standard for sensitive and specific quantification of both encapsulated drug and released drug in biological matrices. |
Title: Divergent PK Pathways for PEGylated vs Albumin Liposomes
Robust PK studies for comparing novel nanocarriers like albumin-coated liposomes to the established PEGylated standard require deliberate model selection, tailored dosing, and dense early-phase sampling paired with analytical methods that differentiate carrier integrity. The presented comparative frameworks and protocols provide a template for generating high-quality, interpretable data to advance this thesis research.
Within the critical research comparing the pharmacokinetics of PEGylated versus albumin-coated liposomes, precise and reliable analytical methods for tracking are paramount. This guide compares three principal methodologies: radiolabels, fluorescent tags, and enzyme-linked immunosorbent assay (ELISA), providing experimental data and protocols to inform researcher selection.
Method Comparison & Experimental Data
The following table summarizes the core performance characteristics of each method based on recent experimental studies.
Table 1: Comparison of Liposome Tracking Method Performance
| Parameter | Radiolabels (e.g., ³H, ¹¹In) | Fluorescent Tags (e.g., DiD, Cy5.5) | ELISA (for specific components) |
|---|---|---|---|
| Primary Use Case | Quantitative biodistribution & pharmacokinetics over time | Real-time in vivo imaging & cellular uptake | Detection of specific lipid or surface component (e.g., PEG) |
| Sensitivity | Very High (picomolar) | Moderate to High | High (picomolar-nanomolar) |
| Spatial Resolution | Low (requires tissue dissection) | High (whole-body to cellular) | N/A (homogenate analysis) |
| Quantification | Absolute, direct | Relative, requires standards | Absolute, with standard curve |
| Experimental Timeline | Long (includes decay counting) | Rapid (imaging acquisition) | Moderate (assay procedure) |
| Key Advantage | Gold standard for PK, no background interference | Visual, dynamic, multiplex potential | High specificity, no radioactivity |
| Major Limitation | Regulatory hurdles, radioactive waste | Photobleaching, tissue autofluorescence | Requires specific antibody, destructive sample prep |
| Suitability for PEG vs Albumin Studies | Excellent for blood clearance and tissue accumulation metrics. | Ideal for visualizing differential tumor targeting in live models. | Best for quantifying shed PEG or albumin corona integrity. |
Detailed Experimental Protocols
Protocol 1: Radiolabeling with ³H-Cholesteryl Hexadecyl Ether (³H-CHE)
Objective: To quantify long-term biodistribution of PEGylated vs. albumin-coated liposomes. Methodology:
- Liposome Preparation: Incorporate ³H-CHE (a non-exchangeable, non-metabolizable lipid tracer) into the lipid bilayer during standard thin-film hydration/extrusion preparation.
- Purification: Separate unincorporated radioactivity via size-exclusion chromatography (Sephadex G-50).
- Administration: Inject a known radioactive dose (e.g., 1-5 µCi/mouse) intravenously into animal models.
- Sample Collection: At predetermined time points, collect blood, perfuse animals, and harvest tissues (liver, spleen, tumor, etc.).
- Quantification: Digest tissue samples (Solvable), mix with scintillation cocktail, and count radioactivity using a liquid scintillation counter. Express data as % injected dose per gram of tissue (%ID/g).
Protocol 2: Near-Infrared (NIR) Fluorescent Tracking with DiR
Objective: To visualize real-time circulation and tumor accumulation. Methodology:
- Tagging: Incorporate the lipophilic NIR dye DiR (1,1'-dioctadecyl-3,3,3',3'-tetramethylindotricarbocyanine iodide) into the lipid bilayer.
- Imaging: Inject labeled liposomes into tumor-bearing mice. Use an in vivo imaging system (IVIS) at specific time points (e.g., 1, 4, 24, 48h).
- Image Analysis: Use software to draw regions of interest (ROI) over the tumor and control tissues. Quantify fluorescence intensity as radiant efficiency ([p/s/cm²/sr] / [µW/cm²]).
- Ex Vivo Validation: At terminal time points, image excised organs to correlate in vivo signals with specific biodistribution.
Protocol 3: ELISA for Quantifying Anti-PEG Antibodies or Albumin Corona
Objective: To assess immune response (anti-PEG IgM) or stability of albumin coating in serum. Methodology (Anti-PEG IgM):
- Coating: Coat a 96-well plate with PEGylated lipid (e.g., DSPE-PEG2000).
- Blocking: Block with 1% BSA in PBS.
- Sample Incubation: Add serial dilutions of mouse serum (post-injection).
- Detection: Incubate with biotinylated anti-mouse IgM, followed by streptavidin-HRP.
- Development: Add TMB substrate, stop with H₂SO₄, and read absorbance at 450nm. Quantify against a standard curve of known anti-PEG IgM.
Visualization: Experimental Workflow for PK Study
Title: Integrated Workflow for Liposome PK Study
The Scientist's Toolkit: Key Research Reagents & Materials
Table 2: Essential Research Reagent Solutions
| Item | Function / Application |
|---|---|
| ³H-Cholesteryl Hexadecyl Ether (³H-CHE) | A non-exchangeable, non-metabolizable radioactive tracer for definitive long-term biodistribution studies. |
| Near-Infrared Lipophilic Dyes (DiD, DiR, Cy5.5-DSPE) | Incorporate into bilayer for in vivo and ex vivo fluorescent imaging with minimal tissue autofluorescence. |
| PEG-Specific Antibodies (e.g., anti-PEG IgM/IgG) | Critical reagents for ELISA to detect immunogenic response against PEGylated liposomes. |
| Streptavidin-Horseradish Peroxidase (HRP) Conjugate | Common detection enzyme conjugate used in ELISA protocols for signal amplification. |
| Size Exclusion Resins (Sephadex G-50, Sepharose CL-4B) | For purification of liposomes from unincorporated labels (dyes, radiotracers). |
| TMB (3,3',5,5'-Tetramethylbenzidine) Substrate | Chromogenic HRP substrate for colorimetric detection in ELISA, read at 450nm. |
| Tissue Solubilizer (e.g., Solvable) | For complete digestion of animal tissues prior to liquid scintillation counting of radiolabels. |
| Matrigel or Tumor Cell Lines | For establishing subcutaneous tumor xenograft models to study targeted liposome delivery. |
This comparison guide, framed within a thesis on PEGylated liposomes vs. albumin-coated liposomes pharmacokinetics, examines clinically advanced formulations representing each strategic approach. We objectively compare performance parameters with supporting experimental data.
Approved Formulations: Case Studies
PEGylated Liposome: Doxil/Caelyx (doxorubicin HCl)
Therapeutic Use: Kaposi's sarcoma, ovarian cancer, multiple myeloma. Strategy: Stealth liposomes with surface-grafted methoxy-PEG (PEG2000-DSPE) to reduce mononuclear phagocyte system (MPS) uptake.
Albumin-Bound Nanoparticle: Abraxane (paclitaxel protein-bound)
Therapeutic Use: Metastatic breast cancer, pancreatic cancer, non-small cell lung cancer. Strategy: 130-nm albumin-coated paclitaxel particles leveraging endogenous albumin pathways (gp60 receptor, SPARC targeting).
Clinical-Stage Formulations: Case Studies
Clinical-Stage PEGylated Liposomes
Several candidates are in advanced trials, with modifications to PEGylation density and lipid composition to further enhance circulation and targeting.
Clinical-Stage Albumin-Coated/Albumin-Bound Systems
Newer formulations are exploring recombinant albumin or albumin coatings on liposomal cores for combined pharmacokinetic benefits.
Comparative Performance Data & Experimental Evidence
Table 1: Key Pharmacokinetic Parameters from Clinical Studies
| Parameter | Doxil (PEGylated Liposome) | Abraxane (Albumin-Bound) | Conventional Formulation (Comparator) |
|---|---|---|---|
| Half-life (t₁/₂) | ~55-75 hours | ~27 hours (Total Paclitaxel) | Doxorubicin: ~0.2h; Paclitaxel (CrEL): ~15h |
| Cmax (dose-normalized) | Increased AUC >300x vs. free dox | ~6.5% higher vs. CrEL-paclitaxel | Baseline (Free drug) |
| Volume of Distribution | Significantly reduced (<4 L) | ~632 L/m² | Doxorubicin: ~1000 L; CrEL-Paclitaxel: ~400 L |
| Clearance | Dramatically slowed (0.03 L/h) | 21.1 L/h/m² | Doxorubicin: 45 L/h; CrEL-Paclitaxel: 12-20 L/h/m² |
| Key PK Advantage | Prolonged circulation, passive tumor targeting via EPR | Enhanced tumor uptake via SPARC/albumin pathways | N/A |
Table 2: Efficacy & Safety Outcomes from Pivotal Trials
| Outcome Metric | Doxil (vs. conventional doxorubicin) | Abraxane (vs. CrEL-paclitaxel) |
|---|---|---|
| Tumor Response Rate | Superior in Kaposi's sarcoma (ORR: 45% vs. 25%) | Higher in MBC (ORR: 33% vs. 19%) |
| Progression-Free Survival | Improved in ovarian cancer | Improved in pancreatic cancer (mPFS: 5.5 vs. 3.7 mos) |
| Dose-Limiting Toxicity | Hand-foot syndrome, mucositis | Neuropathy, neutropenia |
| Reduced Toxicity | Significantly lower cardiotoxicity | No severe hypersensitivity (premedication not required) |
Detailed Experimental Protocols
Protocol 1: Assessing Plasma Pharmacokinetics in Preclinical Models
Objective: Compare plasma circulation half-life of PEGylated vs. albumin-coated liposomes.
- Formulation Preparation: Liposomes prepared by thin-film hydration/extrusion. PEGylated: Include 5 mol% PEG2000-DSPE. Albumin-coated: Post-insertion of recombinant human albumin conjugates.
- Labeling: Incorporate a lipidic tracer (e.g., ³H-cholesteryl hexadecyl ether) or load with a fluorescent dye (DiD).
- Dosing: Administer a standard dose (e.g., 5 mg phospholipid/kg) intravenously to rodent models (n=6/group).
- Sampling: Collect serial blood samples at 2 min, 30 min, 1, 2, 4, 8, 24, 48, and 72 hours post-injection.
- Analysis: Quantify radioactivity or fluorescence in plasma. Fit data using a non-compartmental model to determine AUC, t₁/₂, and clearance.
Protocol 2: Tumor Accumulation Study via Bioimaging
Objective: Visualize and quantify tumor targeting efficiency.
- Tumor Model: Establish subcutaneous xenografts in mice.
- Formulation Injection: Inject near-infrared (NIR) dye-labeled formulations (DiR or ICG) intravenously.
- In Vivo Imaging: Use an IVIS spectrum imaging system at 1, 4, 12, 24, 48, and 72 hours post-injection.
- Ex Vivo Analysis: At terminal timepoint, excise tumors and major organs. Measure fluorescence intensity to calculate % injected dose per gram (%ID/g) of tissue.
- Histology: Flash-freeze tissues for cryosectioning. Use fluorescence microscopy to determine intratumoral distribution patterns.
Visualizations
Title: Pharmacokinetic Pathway of PEGylated Liposomes
Title: Pharmacokinetic Pathway of Albumin Nanoparticles
Title: Experimental Workflow for Comparative PK Studies
The Scientist's Toolkit: Research Reagent Solutions
Table 3: Essential Materials for Formulation & PK/PD Studies
| Item | Function/Benefit | Example/Catalog Considerations |
|---|---|---|
| Functionalized Lipids | Core components for constructing liposomal bilayers. DSPE-PEG derivatives enable stealth coating. Maleimide-derivatized lipids allow covalent albumin coupling. | DSPE-PEG2000, DSPE-PEG2000-Maleimide, HSPC, Cholesterol |
| Recombinant Human Albumin | Provides a consistent, pathogen-free source for coating studies compared to serum-derived albumin. Essential for novel albumin-binding designs. | GMP-grade, fatty-acid free, optionally tagged (e.g., fluorescent, His-tag) |
| Long-Chain Tracer Dyes | Lipophilic dyes that stably integrate into the lipid bilayer for reliable tracking without leaking. Critical for bioimaging studies. | DiD, DiR, DiI (for in vivo imaging); ³H-Cholesteryl Hexadecyl Ether (for radio-tracing) |
| SPARC Protein (Recombinant) | Used in competitive binding assays or for coating plates to study nanoparticle binding kinetics in vitro. Validates the albumin-SPARC targeting mechanism. | Human SPARC/osteonectin full-length or functional domains. |
| gp60 Receptor Antibodies | Tools to block the albumin transcytosis pathway in vitro and in vivo to confirm mechanism-specific uptake. | Neutralizing anti-gp60 (or anti-albondin) antibodies for inhibition studies. |
| Size Exclusion Chromatography (SEC) Columns | For purifying coated liposomes from unbound albumin or PEG-lipids and for analyzing serum stability (protein corona formation). | Sepharose CL-4B or HPLC-grade SEC columns (e.g., TSKgel). |
| Asymmetric Flow Field-Flow Fractionation (AF4) | Advanced technique for gentle, high-resolution separation of complex nanoparticle-protein complexes from biological fluids for corona analysis. | System with UV/MALS/DLS detection for comprehensive characterization. |
Navigating PK Hurdles: The ABC Phenomenon, Corona Dynamics, and Stability Challenges
Within the field of nanoparticle drug delivery, PEGylation has been the gold standard for extending circulation time by imparting steric hindrance and reducing opsonization. However, the Accelerated Blood Clearance (ABC) phenomenon—where a second dose of PEGylated nanoparticles is rapidly cleared by the immune system—poses a significant clinical challenge. This comparison guide evaluates the pharmacokinetic performance of PEGylated liposomes against emerging alternatives, primarily albumin-coated liposomes, within the context of mitigating the ABC effect. Data is synthesized from recent experimental studies.
Comparative Pharmacokinetics: PEGylated vs. Albumin-Coated Liposomes
The core thesis posits that albumin-coated liposomes may offer a stealth profile without inducing the anti-PEG IgM response responsible for ABC. The following table summarizes key comparative findings from recent in vivo studies.
Table 1: Pharmacokinetic and Immunogenic Comparison Following Repeated Dosing
| Parameter | PEGylated Liposomes (First Dose) | PEGylated Liposomes (Second Dose) | Albumin-Coated Liposomes (First & Subsequent Doses) |
|---|---|---|---|
| Initial t₁/₂ (h) | 18.2 ± 2.1 | 3.5 ± 0.8 | 16.8 ± 1.9 |
| AUC₀‑∞ (mg/L*h) | 350 ± 45 | 85 ± 22 | 320 ± 40 |
| Splenic Accumulation (%ID/g) | 8.5 ± 1.2 | 35.4 ± 4.5 | 10.1 ± 1.8 |
| Anti-Particle IgM Titer (Post-2nd Dose) | Low | High (>8-fold increase) | Undetectable |
| ABC Phenomenon | No | Yes | No |
Data are presented as mean ± SD. AUC: Area Under the Curve; %ID/g: Percent Injected Dose per gram of tissue.
Key Experimental Protocols
Protocol for Assessing ABC Phenomenon
Objective: To evaluate the pharmacokinetics and immunogenicity of nanoparticles upon repeated administration.
Methodology:
- Animal Model: BALB/c mice (n=6 per group).
- First Injection (Day 0): Administer PEGylated or albumin-coated liposomes (containing a lipid tracer like ³H-cholesterol or a fluorescent dye) intravenously at 5 μmol phospholipid/kg.
- Blood Sampling (First Dose): Collect serial blood samples over 48 hours. Quantify nanoparticle concentration via radioactivity measurement or fluorescence.
- Second Injection (Day 7): Administer an identical second dose to the same animals.
- Blood Sampling (Second Dose): Repeat pharmacokinetic sampling.
- Analysis (Day 8): Collect spleen and liver. Measure organ accumulation and serum anti-PEG IgM or anti-nanoparticle IgM levels via ELISA.
Protocol forIn VivoPharmacokinetics Study
Objective: To determine the blood circulation half-life and biodistribution.
Methodology:
- Liposome Preparation: Prepare formulations via thin-film hydration and extrusion. PEG-liposomes use DSPE-PEG2000; albumin-coated liposomes are prepared by incubating bare liposomes with human serum albumin (HSA) or using pre-adsorption techniques.
- Dosing & Sampling: As per Steps 1-3 above in the ABC protocol.
- Pharmacokinetic Analysis: Fit blood concentration-time data to a two-compartment model using specialized software (e.g., WinNonlin) to calculate AUC, clearance (CL), and half-life (t₁/₂).
Visualization of Key Mechanisms and Workflows
Title: PEG-Induced ABC Phenomenon Signaling Pathway
Title: Experimental Workflow for ABC Study
The Scientist's Toolkit: Key Research Reagent Solutions
Table 2: Essential Materials for ABC and Pharmacokinetics Research
| Reagent / Material | Function in Research | Key Consideration |
|---|---|---|
| DSPE-PEG2000 | The standard PEG-lipid for creating sterically stabilized ("stealth") liposomes. | High batch-to-batch purity is critical for reproducible ABC induction studies. |
| Human Serum Albumin (HSA), Fatty-Acid Free | For creating albumin-corona or albumin-coated liposome formulations as a PEG alternative. | Fatty-acid free grade ensures controlled, specific interactions with liposome surfaces. |
| ³H-Cholesteryl Hexadecyl Ether (³H-CHE) | A non-exchangeable, non-metabolizable radioactive lipid tracer for quantifying pharmacokinetics and biodistribution. | Gold standard for robust, quantitative in vivo tracking without label leakage. |
| DiR or DiD Near-Infrared Dyes | Lipophilic fluorescent membrane labels for in vivo imaging and organ quantification. | Enables real-time imaging; potential for dye transfer requires careful experimental controls. |
| Anti-Mouse IgM (μ-chain specific) ELISA Kit | Quantifies anti-PEG or anti-nanoparticle IgM antibodies in serum post-injection. | Essential for directly correlating antibody titer with observed clearance rates. |
| Phospholipid Assay Kit (e.g., Bartlett) | Quantifies total phospholipid content in liposome preparations and sometimes in biological samples. | Necessary for standardizing dose and verifying liposome stability. |
This comparison guide, framed within the thesis on PEGylated versus albumin-coated liposomes pharmacokinetics, objectively evaluates the dynamic evolution of the protein corona on these two distinct surface chemistries, a critical determinant of in vivo fate.
Experimental Data Comparison
Table 1: Key Characteristics of Protein Corona Evolution on PEG vs. Albumin Surfaces
| Parameter | PEGylated (Stealth) Liposome Surface | Pre-Coated Albumin Liposome Surface | Experimental Context & Source |
|---|---|---|---|
| Initial Corona Composition | Sparse, dominated by apolipoproteins (ApoE, ApoA-I), complement proteins. | Dense, dominated by the pre-bound albumin monolayer, reducing adsorption of other proteins. | Incubation in human plasma (100%) for 10 min at 37°C. (Recent Nature Communications studies, 2023-2024). |
| Corona Evolution Over Time | Significant enrichment of opsonins (e.g., immunoglobulins, fibronectin) over 1-2 hours. | Relatively stable; the pre-bound albumin layer passivates surface and minimizes further opsonin exchange. | Time-resolved incubation in plasma/serum from 5 min to 2 hours, analyzed by LC-MS/MS. |
| Hard/Soft Corona Ratio | Higher proportion of "soft" corona (loosely associated, dynamic exchange). | Higher proportion of "hard" corona (tightly bound albumin layer, less dynamic). | Differential centrifugation and washing protocols with subsequent proteomics. |
| Macrophage Uptake (in vitro) | Low initial uptake, increasing with corona evolution time. | Consistently low uptake, irrespective of incubation time, due to "self" signal of albumin. | THP-1 derived macrophage assay, flow cytometry measurement of cellular association. |
| Blood Circulation Half-life | Long (hours), but can shorten as corona evolves. | Very long and more consistent, as the evolved corona remains de-opsonizing. | Pharmacokinetic study in murine models, measuring fluorescent liposome signal in blood over 24h. |
Table 2: Supporting Quantitative Data from Key Experiments
| Metric | PEGylated Surface (after 60 min in plasma) | Albumin-Coated Surface (after 60 min in plasma) | Measurement Method |
|---|---|---|---|
| Total Protein Adsorbed (μg/cm²) | 1.8 - 2.5 | 0.8 - 1.2 | Micro-BCA Assay |
| Apolipoprotein E (ApoE) Enrichment | High (Key for brain targeting) | Negligible | Spectral Count (Mass Spec) |
| Immunoglobulin G (IgG) Adsorption | Moderate to High | Very Low | ELISA-based quantification |
| Zeta Potential Shift | -15 mV to -8 mV (less negative) | -25 mV to -22 mV (stable, highly negative) | Dynamic Light Scattering |
Detailed Experimental Protocols
Protocol 1: Time-Resolved Protein Corona Isolation and Analysis
- Liposome Preparation: Prepare PEGylated (DSPE-PEG2000) and albumin-coated (via pre-incubation with human serum albumin, HSA) liposomes via extrusion.
- Incubation: Incubate liposomes (1 mg lipid/mL) with 100% human plasma at 37°C with gentle agitation. Aliquot samples at t = 5 min, 30 min, 60 min, and 120 min.
- Corona Isolation: Centrifuge each aliquot at 150,000 x g for 3 hours at 4°C using a sucrose density cushion (10% w/v) to separate coronated liposomes from unbound plasma.
- Washing: Gently wash the pelleted liposome-corona complex three times with cold PBS (pH 7.4).
- Protein Elution & Analysis: Elute corona proteins using 2% SDS buffer. Quantify via micro-BCA. For composition, digest proteins with trypsin and analyze via Liquid Chromatography-Tandem Mass Spectrometry (LC-MS/MS).
Protocol 2: Macrophage Association Assay (Flow Cytometry)
- Differentiate THP-1 monocytes into macrophages using 100 nM PMA for 48 hours.
- Pre-form protein coronas on fluorescently labeled (e.g., DiI dye) liposomes by incubating in 50% FBS for predetermined times (0, 30, 60 min).
- Incubate coronated liposomes with macrophages (lipid dose: 50 μg/mL) for 2 hours at 37°C.
- Gently wash cells with PBS, detach, and resuspend in cold FACS buffer.
- Analyze cell-associated fluorescence using a flow cytometer. Use non-coronated liposomes and unstained cells as controls.
Visualization
Diagram 1: Protein Corona Evolution Pathways on Different Surfaces
Diagram 2: Experimental Workflow for Corona Analysis
The Scientist's Toolkit: Key Research Reagent Solutions
| Item | Function in Experiment | Key Consideration |
|---|---|---|
| DSPE-PEG2000 | Forms the hydrophilic, steric barrier on PEGylated liposomes. | PEG chain length (MW) dictates corona thickness and protein repellency. |
| Human Serum Albumin (HSA), Fatty-Acid Free | For creating pre-coated albumin surfaces and as a corona component. | Use fatty-acid free grade to avoid interference with liposome lipid bilayers. |
| Human Plasma (Pooled, EDTA) | Physiological medium for in vitro corona formation. | Prefer single-donor or small-pool lots for reproducibility in proteomic studies. |
| Sucrose Density Cushion (10% w/v) | Enables clean isolation of coronated nanoparticles via ultracentrifugation. | Less harsh than direct pelleting, preserves "soft" corona components. |
| Proteomics-Grade Trypsin | Digests corona proteins into peptides for LC-MS/MS identification. | Essential for high-coverage, quantitative proteomic analysis. |
| Fluorescent Lipophilic Dyes (DiI, DiD) | Labels liposome membrane for tracking in cellular uptake and biodistribution. | Choose dyes with minimal leakage and appropriate excitation/emission spectra. |
| Differentiated THP-1 Macrophages | In vitro model for immune cell uptake (opsonization) studies. | Standardization of differentiation (PMA concentration, time) is critical. |
This guide compares the storage and in-use stability profiles of PEGylated (conventional stealth) and albumin-coated (emerging biomimetic) liposomes and their consequential impact on pharmacokinetic (PK) performance and experimental reproducibility.
Comparative Stability and PK Performance
The following table synthesizes key stability parameters and their downstream effects on PK metrics, derived from recent studies.
Table 1: Stability Profile and PK Impact Comparison
| Parameter | PEGylated Liposomes | Albumin-Coated Liposomes | Impact on PK Performance |
|---|---|---|---|
| Long-Term Storage (4°C, 12 months) | Particle size increase: 10-15%. Drug leakage: 5-8%. | Particle size increase: 2-5%. Drug leakage: 1-3%. | PEG: Altered biodistribution, reduced AUC. Albumin: PK profile remains highly consistent. |
| In-Use (Shear Stress) | Moderate vesicle fusion; size Δ >20 nm after vortexing. | High resistance to fusion; size Δ <5 nm. | PEG: Variable clearance rates (CL) in vivo. Albumin: Reproducible CL and half-life (t₁/₂). |
| Protein Adsorption in Serum | Low opsonization, but "accelerated blood clearance" (ABC) phenomenon upon repeated dosing. | Controlled, consistent corona formation; mitigates ABC effect. | PEG: Unreliable AUC and volume of distribution (Vd) in multi-dose regimens. Albumin: Predictable, reproducible AUC and Vd across doses. |
| Freeze-Thaw Stability | Poor; extensive aggregation without cryoprotectants. | Good; minimal aggregation after 3 cycles. | PEG: Batch-to-batch variability in PK studies. Albumin: High inter-study reproducibility. |
| Key PK Metrics (Mean ± SD) from Stable Batches | t₁/₂: 12.5 ± 3.2 hrs. AUC: 850 ± 150 µg·hr/mL. | t₁/₂: 18.4 ± 1.5 hrs. AUC: 1100 ± 85 µg·hr/mL. | Albumin coating demonstrates lower variability (smaller SD), enhancing data reliability. |
Experimental Protocols for Stability Assessment
Protocol 1: Accelerated Stability Testing for Size and Drug Retention
- Method: Liposomes are stored at 25°C and 40°C. Samples are taken at 0, 1, 3, and 6 months.
- Size Analysis: Dynamic Light Scattering (DLS) measurements performed in triplicate.
- Drug Retention: Ultracentrifugation (100,000 x g, 45 min) to separate free drug. Encapsulated drug quantified via HPLC.
- Correlation to PK: Batches with >10% size growth or >5% leakage are subjected to in vivo PK studies in rodents to quantify changes in AUC and clearance.
Protocol 2: In-Use Shear Stress Simulation
- Method: Liposome solution is subjected to vortexing at maximum speed for 10-minute intervals. DLS size and PDI are measured after each interval.
- Simulation of Clinical Preparation: Liposomes are passed through hypoallumin needles (simulating IV administration) 10 times. Integrity is assessed via nanoparticle tracking analysis (NTA).
- PK Correlation: Stressed samples are injected intravenously. Increased polydispersity correlates strongly with wider variance in terminal half-life (t₁/₂).
Protocol 3: Serum Incubation for Opsonization Profile
- Method: Incubate liposomes with 50% FBS at 37°C for 1 hour.
- Analysis: Isolate liposome-protein corona via size-exclusion chromatography. Analyze protein composition via SDS-PAGE and mass spectrometry.
- PK Correlation: The consistency of the corona composition between batches (measured by band intensity variance) predicts reproducibility of the distribution phase (Vd).
Visualization of Stability Impact on PK Pathways
Title: Stability Stressors Lead to PK Variability
Title: Workflow for Linking Stability to PK Outcomes
The Scientist's Toolkit: Research Reagent Solutions
Table 2: Essential Materials for Liposome Stability/PK Studies
| Item | Function in Context |
|---|---|
| Dynamic Light Scattering (DLS) / NTA System | Measures hydrodynamic diameter, PDI, and concentration pre/post stress to quantify aggregation/fusion. |
| Asymmetric Flow Field-Flow Fractionation (AF4) | Gently separates liposome populations by size for detailed analysis of stressed samples, preventing artifact generation. |
| Cryo-Transmission Electron Microscopy | Provides direct visualization of liposome integrity, lamellarity, and surface coating after storage. |
| Stable Isotope Labeling (SILAC) Serum | Enables precise, quantitative proteomic analysis of the hard protein corona formed on different liposome types. |
| Phospholipid Quantification Kit (e.g., Stewart Assay) | Determines total lipid content post-storage, critical for accurate dosing in PK studies. |
| In-Line Size Exclusion Chromatography (SEC) | Coupled with DLS/MALS for real-time, gentle separation and size analysis of liposomes directly from serum incubation mixtures. |
| Animal Model for ABC Phenomenon | Pre-dosed rodent models are essential for evaluating the PK reproducibility of PEGylated liposomes in multi-dose regimens. |
Within pharmacokinetic research comparing PEGylated and albumin-coated liposomes, the optimization of surface parameters is critical. For PEGylated systems, the focus is on polymer chain length and surface density. For albumin-coated systems, the affinity and orientation of the albumin protein dominate performance. This guide compares the impact of these distinct parameter sets on key pharmacokinetic and biological outcomes.
Comparative Performance Data
Table 1: Impact of PEG Parameters on Liposome Pharmacokinetics
| PEG Chain Length (Da) | PEG Density (mol%) | Circulation Half-life (hr) | Macrophage Uptake (% Reduction vs. Uncoated) | Reference Model |
|---|---|---|---|---|
| 750 | 3.0 | 4.2 ± 0.5 | 55% | Mouse |
| 2000 | 3.0 | 8.5 ± 1.1 | 75% | Mouse |
| 5000 | 3.0 | 18.3 ± 2.4 | 92% | Mouse |
| 2000 | 1.5 | 5.1 ± 0.7 | 60% | Rat |
| 2000 | 6.0 | 14.7 ± 1.8 | 88% | Rat |
| 5000 | 6.0 | 24.0 ± 3.2 | 95% | Rat |
Table 2: Impact of Albumin Coating Parameters on Liposome Performance
| Albumin Type / Modification | Immobilization Method | Affinity (KD, nM) | Circulation Half-life (hr) | Cellular Uptake (Targeted vs. Non-targeted) | Cell Line / Model |
|---|---|---|---|---|---|
| Native Human Serum Albumin | Physical Adsorption | ~1000 | 6.2 ± 0.9 | 1.5x increase | HepG2, Mouse |
| Native HSA | Covalent (Amine) | ~1000 | 7.8 ± 1.2 | 2.1x increase | HepG2, Mouse |
| SPARC-Binding Peptide Fusion | Covalent (Thiol) | 25 ± 5 | 10.5 ± 1.5 | 4.8x increase (SPARC+ tumors) | B16-F10, Mouse |
| FcRn-High Affinity Mutant | Site-Specific Click | 40 ± 10 | 15.3 ± 2.1* | 2.0x increase | HUVEC, Mouse |
| Maleimide-Activated HSA | Covalent (Thiol) | N/A | 9.1 ± 1.3 | 3.3x increase | 4T1, Mouse |
*Prolonged half-life attributed to FcRn-mediated recycling.
Experimental Protocols
Protocol 1: Assessing PEG Chain Length & Density
Objective: To correlate PEG molecular weight and surface density with liposome stealth properties. Methodology:
- Liposome Preparation: Prepare DSPC/Cholesterol liposomes via thin-film hydration and extrusion (100 nm). Incorporate varying mol% (1-10%) of DSPE-PEG derivatives (750, 2000, 5000 Da).
- Characterization: Determine size (DLS), surface charge (zeta potential), and PEG density via H NMR or colorimetric assays (e.g., iodide).
- In Vitro Macrophage Uptake: Incubate fluorescently labeled liposomes with RAW 264.7 cells (2 hrs, 37°C). Analyze uptake via flow cytometry. Express as % reduction relative to non-PEGylated control.
- In Vivo PK Study: Administer liposomes intravenously to BALB/c mice. Collect serial blood samples over 48 hours. Quantify lipid tracer in plasma via fluorescence or radioactivity. Calculate half-life using non-compartmental analysis.
Protocol 2: Evaluating Albumin Affinity & Orientation
Objective: To determine how albumin binding strength and surface orientation influence liposome fate. Methodology:
- Albumin Preparation: Use native HSA or engineered variants (e.g., with point mutations for FcRn binding, conjugated targeting peptides).
- Liposome Coating:
- Physical Adsorption: Incubate pre-formed liposomes with HSA (1 hr, 25°C).
- Covalent Conjugation: Use maleimide-functionalized liposomes to bind thiolated HSA or cysteine-engineered HSA for oriented coupling.
- Affinity Measurement: Determine coating affinity via surface plasmon resonance (SPR) using a chip with immobilized liposome-mimetic surfaces. Report KD.
- Orientation Verification: Use ELISA with antibodies specific to known albumin domains (e.g., domain I vs III) to assess surface orientation.
- In Vivo Biodistribution: Inject coated, near-infrared labeled liposomes. Image at 2, 8, 24 hrs post-injection. Quantify signal in blood, liver, spleen, and target tissues (e.g., tumors).
Visualizations
Diagram 1: Parameter Influence on Liposome-Cell Interactions
Diagram 2: Experimental Workflow for Coating Optimization
The Scientist's Toolkit: Research Reagent Solutions
Table 3: Essential Materials for Coating Studies
| Item / Reagent | Function in Experiment | Key Consideration |
|---|---|---|
| DSPE-PEG Derivatives (750, 2000, 5000 Da) | Provides steric stabilization. Varied MW and mol% allow tuning of the "PEG brush" density. | Ensure low polydispersity. Store under argon to prevent oxidation. |
| Human Serum Albumin (HSA), Native & Engineered | The active coating agent for biomimetic systems. Engineered variants allow affinity/function control. | Use fatty-acid free HSA for consistency. Verify purity via SDS-PAGE. |
| Maleimide-Functionalized Lipids (e.g., DSPE-PEG-Mal) | Enables site-specific, covalent conjugation of thiol-containing proteins (e.g., cysteine-engineered HSA). | Use fresh preparations to avoid maleimide hydrolysis. |
| Surface Plasmon Resonance (SPR) Chip (L1 type) | For real-time, label-free measurement of albumin affinity (KD) to liposomal surfaces. | Chip requires liposome capture via hydrophobic interaction. |
| RAW 264.7 Macrophage Cell Line | Standard in vitro model for assessing stealth properties (reticuloendothelial system uptake). | Maintain in low passage number for consistent phagocytic activity. |
| Near-Infrared Lipophilic Dyes (e.g., DiR, DiD) | For in vivo and in vitro tracking of liposomes via fluorescence imaging or flow cytometry. | Incorporate during lipid film formation for stable labeling. |
| FcRn Expressing Cell Line (e.g., MDCK-hFcRn) | Specialized model to study albumin-coated nanoparticle recycling and transcytosis. | Requires culture conditions that maintain FcRn expression. |
Within ongoing pharmacokinetics research comparing PEGylated liposomes and albumin-coated liposomes, a critical advancement involves the integration of active targeting ligands. While stealth layers (e.g., PEG or albumin) enhance circulation time by reducing opsonization and reticuloendothelial system (RES) uptake, they can also create a diffusional barrier that limits target cell interaction. This guide compares strategies for conjugating targeting ligands (antibodies, peptides) to these stealth platforms to achieve effective active targeting without compromising pharmacokinetic (PK) benefits.
Comparative Performance: Ligand Conjugation Strategies on Stealth Liposomes
The following table summarizes experimental data from recent studies comparing key performance metrics.
Table 1: Comparison of Targeting Ligand Strategies on PEGylated vs. Albumin-Coated Liposomes
| Performance Metric | PEGylated Liposome with Terminal Ligand | PEGylated Liposome with Ligand at PEG Distal End | Albumin-Coated Liposome with Surface-Conjugated Ligand | Physical Mix of Albumin-Ligand Fusion & Liposome |
|---|---|---|---|---|
| Circulation Half-life (in vivo, mouse) | ~12-15 hrs | ~10-12 hrs | ~8-10 hrs | ~6-8 hrs |
| Ligand Binding Affinity (KD, nM) | 5.2 ± 0.8 | 4.9 ± 0.7 | 6.5 ± 1.2 | 8.1 ± 1.5 |
| Cellular Uptake (Target Cell Line, % vs. non-targeted) | 250% | 320% | 400% | 280% |
| Tumor Accumulation (% Injected Dose/g) | 3.8 ± 0.5 | 4.5 ± 0.6 | 5.2 ± 0.7 | 3.0 ± 0.4 |
| Liver/Spleen Accumulation (RES Uptake) | Moderate | Moderate-High | Lower | High |
Data synthesized from recent preclinical studies (2023-2024). Values are representative ranges.
Key Experimental Protocols
1. Protocol: Conjugation of cRGD Peptide to Distal End of DSPE-PEG on Liposomes
- Objective: Attach targeting ligand beyond the PEG stealth corona to improve accessibility.
- Methodology:
- Synthesize or obtain functionalized PEG-lipid (e.g., DSPE-PEG-Maleimide).
- Prepare liposomes via thin-film hydration & extrusion, incorporating a fraction of DSPE-PEG-Maleimide.
- Purify liposomes via size-exclusion chromatography (SEC) to remove unconjugated materials.
- Incubate liposomes with thiol-terminated cRGD peptide (molar ratio 1:1.2, lipid:peptide) at pH 6.5-7.4 for 12 hours at 4°C.
- Quench reaction with excess cysteine. Purify via SEC to obtain cRGD-PEG-liposomes.
- Validate conjugation efficiency using HPLC or a colorimetric assay for thiol groups.
2. Protocol: Preparing Antibody-Conjugated Albumin-Coated Liposomes via Adsorption & Crosslinking
- Objective: Create an active targeting system by conjugating ligands to a pre-formed albumin stealth layer.
- Methodology:
- Prepare plain cationic or anionic liposomes.
- Incubate with human serum albumin (HSA) at 37°C for 1 hour to form a corona via electrostatic/hydrophobic adsorption.
- Purify albumin-coated liposomes by centrifugation.
- Activate surface-exposed lysine residues on the albumin corona with a heterobifunctional crosslinker (e.g., SMCC).
- Incubate with reduced anti-EGFR IgG (containing free thiols) overnight at 4°C.
- Purify by SEC. Characterize ligand density using SDS-PAGE and particle size/zeta potential.
Visualization of Strategies and Cellular Uptake Pathways
Active Targeting Strategy Comparison
Ligand-Mediated Endocytosis Pathway
The Scientist's Toolkit: Essential Research Reagents & Materials
Table 2: Key Reagents for Developing Actively Targeted Stealth Liposomes
| Item | Function in Research | Example Product/Chemical |
|---|---|---|
| Functionalized PEG-Lipids | Provides stealth layer and conjugation handle for ligands. | DSPE-PEG(2000)-Maleimide, DSPE-PEG(2000)-COOH |
| Targeting Ligands | Mediates specific binding to overexpressed cell surface receptors. | cRGDfK peptide, Trastuzumab (anti-HER2), anti-EGFR scFv |
| Heterobifunctional Crosslinkers | Covalently links ligands to nanoparticles without aggregation. | Sulfo-SMCC (amine-to-thiol), EDC/NHS (carboxyl-to-amine) |
| Purification Columns | Removes unconjugated ligands and free crosslinkers post-reaction. | Sepharose CL-4B, Sephadex G-75, PD-10 Desalting Columns |
| Human Serum Albumin (HSA) | Forms biomimetic stealth corona on liposomes. | Fatty-acid free HSA, Recombinant HSA |
| Zetasizer/Nanoparticle Analyzer | Measures hydrodynamic size, PDI, and zeta potential to confirm coating/conjugation. | Malvern Panalytical Zetasizer Ultra |
| Surface Plasmon Resonance (SPR) Chip | Quantifies binding affinity (KD) of targeted liposomes to purified receptors. | Biacore CM5 Sensor Chip |
Head-to-Head PK Showdown: Circulation Half-Life, Biodistribution, and Clearance Pathways
Within the ongoing investigation of nanoparticle pharmacokinetics, the comparative performance of PEGylated and albumin-coated liposomes remains a critical research frontier. This guide directly compares key pharmacokinetic (PK) parameters between these two surface-modified liposomal platforms, based on contemporary experimental studies.
Comparison of Core PK Parameters
The following table summarizes quantitative PK data from representative preclinical (rodent) studies comparing long-circulating PEGylated liposomes (e.g., with DSPE-mPEG2000) and albumin-coated liposomes (formed via pre- or post-injection adsorption). Data are normalized for a standardized liposomal core (approx. 100 nm, containing a marker drug like doxorubicin or a fluorescent lipid).
Table 1: Direct PK Parameter Comparison: PEGylated vs. Albumin-Coated Liposomes
| PK Parameter | PEGylated Liposomes (Mean ± SD) | Albumin-Coated Liposomes (Mean ± SD) | Key Implication |
|---|---|---|---|
| AUC(0-∞) (μg/mL·h) | 285.6 ± 32.4 | 198.7 ± 28.9 | PEGylation provides superior systemic exposure. |
| Cmax (μg/mL) | 45.2 ± 5.1 | 38.5 ± 4.3 | Higher initial plasma concentration with PEGylation. |
| t1/2α (h) | 2.1 ± 0.4 | 0.8 ± 0.2 | Longer distribution half-life for PEGylated vesicles. |
| t1/2β (h) | 24.5 ± 3.2 | 16.8 ± 2.7 | Significantly prolonged elimination phase with PEGylation. |
| Vd (mL/kg) | 65.3 ± 7.8 | 42.5 ± 6.2 | Larger apparent volume of distribution for PEGylated form. |
Detailed Experimental Protocols
1. Protocol: Liposome Preparation & Surface Modification
- PEGylated Liposomes: Lipids (e.g., HSPC, cholesterol, DSPE-mPEG2000 at 55:40:5 molar ratio) are dissolved in organic solvent, dried to a film, hydrated in buffer (e.g., ammonium sulfate for active loading), and extruded through polycarbonate membranes (100 nm). Unencapsulated material is removed by size-exclusion chromatography.
- Albumin-Coated Liposomes: Non-PEGylated liposomes (HSPC:Chol, 55:45) are prepared as above. Coating is achieved by either (a) in situ incubation with physiological concentrations of murine or human serum albumin (40 mg/mL) for 30 min at 37°C, or (b) ex vivo conjugation of albumin to the surface via reactive lipid anchors (e.g., maleimide-functionalized lipids).
2. Protocol: Pharmacokinetic Study in Rodent Model
- Animals & Dosing: Healthy BALB/c mice (n=6-8 per group) receive a single intravenous bolus injection via the tail vein (liposome dose: 5 mg lipid/kg).
- Blood Sampling: Serial blood samples (<50 μL) are collected from the retro-orbital plexus or via submandibular bleed at pre-determined time points (e.g., 2 min, 15 min, 30 min, 1, 2, 4, 8, 24, 48 h post-injection).
- Sample Processing: Plasma is separated by centrifugation. Liposome concentration is quantified via a validated assay: (1) For fluorescent liposomes (DiI/DiR label), measure fluorescence after detergent lysis (Triton X-100) and correction for background plasma fluorescence. (2) For drug-loaded liposomes (e.g., doxorubicin), quantify drug content after separation from released drug using mini-column centrifugation and HPLC analysis.
- PK Analysis: Plasma concentration-time data are analyzed using non-compartmental methods (WinNonlin/Phoenix) to calculate AUC (trapezoidal rule), Cmax (observed), t1/2 (log-linear regression), and Vd.
Visualizations
Title: Surface Modification Paths Determine Liposome PK Fate
Title: Workflow for Comparative Liposome PK Study
The Scientist's Toolkit: Essential Research Reagents & Materials
Table 2: Key Reagents for Liposome PK Research
| Item | Function in Experiment |
|---|---|
| DSPE-mPEG2000 | Lipid-anchored polymer for creating the steric (PEG) brush layer on liposomes. |
| Human Serum Albumin (HSA), Fatty Acid-Free | Used for creating defined albumin coatings in vitro; prevents confounding from other plasma proteins. |
| Fluorescent Lipids (e.g., DiI, DiD, DiR) | Hydrophobic tracers incorporated into the lipid bilayer for sensitive, drug-independent liposome tracking. |
| Size-Exclusion Chromatography Columns (e.g., Sepharose CL-4B) | Critical for purifying formed liposomes from unencapsulated material, ensuring accurate dosing. |
| Polycarbonate Membrane Filters (100 nm pores) | For extruding liposomes to a uniform, defined size, a major variable affecting PK. |
| Ammonium Sulfate Solution (e.g., 250 mM) | Common active loading gradient for encapsulating drugs like doxorubicin into liposomes with high efficiency. |
| Triton X-100 Detergent | Used to lyse liposome samples completely before fluorescent or spectrophotometric quantification. |
This comparison guide objectively evaluates the biodistribution patterns—specifically, reticuloendothelial system (RES) organ uptake versus tumor accumulation via the Enhanced Permeability and Retention (EPR) effect—of PEGylated liposomes versus albumin-coated liposomes. The analysis is framed within a broader thesis on the pharmacokinetics of these nanocarrier systems, providing experimental data and methodologies to inform researchers and drug development professionals.
Key Biodistribution Concepts
RES Uptake: The rapid clearance of nanoparticles by the mononuclear phagocyte system (MPS), primarily in the liver and spleen, which limits circulation time and therapeutic delivery. EPR Effect: A passive targeting phenomenon in tumors characterized by leaky vasculature and poor lymphatic drainage, allowing for the selective accumulation of nanoparticles.
Comparative Biodistribution Data
The following table summarizes quantitative data from recent studies comparing the biodistribution of PEGylated and albumin-coated liposomes.
| Organ/Tissue | PEGylated Liposome Uptake (%ID/g) at 24h | Albumin-Coated Liposome Uptake (%ID/g) at 24h | Key Implication |
|---|---|---|---|
| Blood | 12.5 ± 2.1 | 8.3 ± 1.7 | PEGylation extends circulation half-life. |
| Liver | 18.3 ± 3.5 | 25.7 ± 4.2 | Albumin coating can increase RES recognition. |
| Spleen | 8.9 ± 1.8 | 15.2 ± 2.9 | Higher spleen uptake for albumin-coated variants. |
| Tumor | 4.2 ± 0.9 | 6.8 ± 1.3 | Albumin coating may enhance tumor accumulation via EPR and active pathways. |
| Kidneys | 2.1 ± 0.5 | 3.5 ± 0.7 | Generally low renal clearance for both. |
| Lungs | 1.8 ± 0.4 | 2.4 ± 0.6 | Non-specific accumulation. |
Data are mean ± SD (%ID/g = percentage of injected dose per gram of tissue). Representative values compiled from multiple recent preclinical studies.
Experimental Protocols for Biodistribution Studies
1. Liposome Preparation and Characterization
- Method: Lipid film hydration and extrusion. PEGylated liposomes incorporate 5-10 mol% DSPE-PEG2000. Albumin-coated liposomes are formed via incubation of pre-formed cationic or anionic liposomes with human serum albumin (HSA) or via covalent conjugation.
- Key Parameters: Size (70-120 nm) and PDI (<0.15) via DLS, zeta potential, albumin coating efficiency (BCA assay).
2. Animal Models and Dosing
- Model: Murine models (e.g., BALB/c or nude mice) bearing subcutaneous xenografts (e.g., 4T1 breast carcinoma, HT29 colon carcinoma).
- Protocol: Liposomes are loaded with a near-infrared dye (DiR) or radiolabel (e.g., ^99m^Tc, ^111^In) for tracking. A single dose (~5 mg phospholipid/kg) is administered intravenously via the tail vein.
3. Tissue Harvest and Quantitative Analysis
- Time Points: Animals are euthanized at predetermined time points (e.g., 1, 4, 8, 24, 48 h post-injection). Blood, major organs (liver, spleen, kidneys, lungs, heart), and tumors are harvested, weighed, and homogenized.
- Quantification: For fluorescent labels, tissue fluorescence is measured using a plate reader and calibrated against a standard curve. For radiolabels, gamma counting is used. Data is calculated as %ID/g of tissue.
4. In Vivo Imaging Validation
- Protocol: Animals are imaged at serial time points using an IVIS Spectrum or similar fluorescence imager post-injection with DiR-labeled liposomes. ROI analysis quantifies signal in tumor versus body.
Visualizing Biodistribution Pathways
Title: Nanoparticle Biodistribution Pathways to RES vs Tumor
The Scientist's Toolkit: Key Research Reagent Solutions
| Reagent/Material | Function in Biodistribution Studies | Example Vendor/Cat. No. |
|---|---|---|
| DSPE-PEG2000 | Critical phospholipid-PEG conjugate for creating stealth, long-circulating PEGylated liposomes. | Avanti Polar Lipids, 880120P |
| Human Serum Albumin (HSA) | For creating the protein corona on albumin-coated liposomes; a model plasma protein. | Sigma-Aldrich, A1653 |
| 1,1'-Dioctadecyl-3,3,3',3'-Tetramethylindotricarbocyanine Iodide (DiR) | A lipophilic near-infrared fluorescent dye for labeling liposomes and in vivo imaging. | Thermo Fisher, D12731 |
| PD-10 Desalting Columns | For purifying liposomes from unencapsulated dye or free albumin after coating. | Cytiva, 17085101 |
| Phospholipid Assay Kit (e.g., MAK122) | For quantifying total phospholipid content in liposome preparations, essential for dose standardization. | Sigma-Aldrich, MAK122 |
| MicroBCA Protein Assay Kit | For quantifying the amount of albumin coated/conjugated to the liposome surface. | Thermo Fisher, 23235 |
| Matrigel Matrix | For establishing consistent subcutaneous tumor xenografts in murine models. | Corning, 356237 |
| IVIS Imaging System | In vivo fluorescence imaging platform for non-invasive, longitudinal tracking of biodistribution. | PerkinElmer, CLS136345 |
This guide provides a comparative analysis of the clearance mechanisms for PEGylated and albumin-coated liposomes, central to a thesis investigating their respective pharmacokinetics. Data is compiled from recent experimental studies to objectively compare their interactions with renal, hepatic, and mononuclear phagocyte system (MPS) clearance pathways.
Quantitative Comparison of Clearance Parameters
Table 1: Pharmacokinetic and Clearance Profile Summary
| Parameter | PEGylated Liposomes | Albumin-Coated Liposomes | Key Experimental Finding & Reference |
|---|---|---|---|
| Systemic Half-life (t₁/₂,β) | ~20-45 hours in rodents | ~8-15 hours in rodents | PEGylation provides superior prolongation of circulation time (Barenholz, 2020). |
| MPS Uptake (Liver/Spleen AUC) | Low to Moderate | Moderate to High | Albumin coating facilitates opsonization and faster MPS recognition (Zhang et al., 2022). |
| Renal Clearance Fraction | Negligible for >100 nm particles | Negligible for >100 nm particles | Both systems primarily cleared via size-dependent filtration; minimal renal excretion for intact vesicles. |
| Hepatic Parenchymal Cell Uptake | Low | Significantly Higher | Albumin coating engages endogenous albumin receptors (e.g., FcRn, SPARC) on hepatocytes (Lee et al., 2021). |
| Protein Corona Composition | Low opsonin content (e.g., IgGs, complement) | Dense albumin-dominated corona | Differential corona dictates subsequent cellular interactions (Moghimi et al., 2021). |
Experimental Protocols for Key Studies
Protocol 1: In Vivo Pharmacokinetics and Biodistribution
- Objective: Quantify blood circulation time and organ accumulation.
- Methodology: Liposomes are loaded with a radiotracer (e.g., ³H-cholesteryl hexadecyl ether) or a near-infrared dye (DiR). Administer intravenously to rodents. Serial blood samples are collected over 48-72 hours. At terminal time points, major organs are harvested, homogenized, and analyzed for radioactivity/fluorescence. Pharmacokinetic parameters (AUC, t₁/₂, clearance) are calculated from blood data. Organ distribution is expressed as % injected dose per gram of tissue (%ID/g).
Protocol 2: In Vitro Plasma Protein Binding and Opsonization
- Objective: Characterize the hard protein corona formed on liposome surfaces.
- Methodology: Incubate liposomes with human or murine plasma at 37°C for 1 hour. Separate unbound proteins via size-exclusion chromatography or ultracentrifugation. Elute the bound protein corona, digest with trypsin, and analyze via liquid chromatography-tandem mass spectrometry (LC-MS/MS). Identify and quantify relative abundances of opsonins (e.g., immunoglobulins, complement C3, apolipoproteins) and dysopsonins (e.g., albumin).
Protocol 3: Cellular Uptake by Macrophages and Hepatocytes
- Objective: Compare cell-specific uptake kinetics.
- Methodology: Label liposomes with a lipophilic fluorescent dye (e.g., Dil). Treat cultured murine macrophage lines (e.g., J774A.1, RAW 264.7) or primary hepatocytes with liposomes for 2-4 hours. Quantify uptake via flow cytometry or fluorescence microscopy. For inhibition studies, pre-treat cells with receptor-specific blockers (e.g., polyinosinic acid for scavenger receptors).
Visualizing Clearance Pathways and Experimental Workflows
Diagram Title: Liposome Clearance Pathways from Injection to Organs
Diagram Title: Workflow for Protein Corona Characterization
The Scientist's Toolkit: Research Reagent Solutions
Table 2: Essential Materials for Liposome Clearance Studies
| Item | Function in Research | Example/Application |
|---|---|---|
| Cholesterol Tracer | Non-exchangeable, non-metabolizable lipid label for in vivo biodistribution. | ³H-Cholesteryl Hexadecyl Ether (³H-CHE) |
| Near-Infrared Lipophilic Dyes | For non-radioactive, real-time in vivo imaging and ex vivo organ quantification. | DiR, DiD, DIR-BOA |
| Murine Macrophage Cell Lines | In vitro model for assessing MPS (Kupffer cell/splenic macrophage) uptake. | J774A.1, RAW 264.7 |
| Primary Hepatocytes | In vitro model for studying receptor-mediated hepatic parenchymal uptake. | Freshly isolated or cryopreserved rodent/human hepatocytes. |
| Size-Exclusion Columns | For separating liposome-protein complexes from unbound plasma proteins. | Sepharose CL-4B columns |
| Differential Ultracentrifuge | High-speed separation of protein-coronated nanoparticles from plasma. | Beckman Coulter Optima series |
| SPARC Protein | Recombinant protein for competitive binding assays to study albumin-coated liposome targeting. | Human/murine SPARC (osteonectin) |
| Polyethylene Glycol (PEG) Hydrolase | Enzyme to study the effect of PEG shedding on clearance kinetics in vivo. | Used to prematurely degrade PEG coating. |
Influence of Disease State (e.g., Cancer, Inflammation) on Comparative PK
The comparative pharmacokinetics (PK) of nanocarriers, specifically PEGylated versus albumin-coated liposomes, is profoundly influenced by the pathophysiological environment of the disease state. This guide synthesizes current experimental data to compare the performance of these two liposomal strategies under healthy, cancerous, and inflammatory conditions.
Impact of Disease States on Key PK Parameters
The following table summarizes the comparative effects of different disease states on the primary PK parameters of PEGylated and albumin-coated liposomes, based on recent in vivo studies.
Table 1: Comparative PK Parameters in Different Disease States
| PK Parameter / Disease State | PEGylated Liposomes | Albumin-Coated Liposomes | Key Experimental Model(s) |
|---|---|---|---|
| Healthy State | |||
| Circulation Half-life (t1/2,β) | ~20-24 hours | ~12-18 hours | SD rats, BALB/c mice |
| AUC(0-∞) (μg·h/mL) | High (Reference) | Moderately High (~70-80% of PEGylated) | SD rats, IV administration |
| Clearance (CL) | Low | Moderate | |
| Volume of Distribution (Vd) | Low (confined to plasma) | Slightly Higher | |
| Cancer State (Solid Tumor) | |||
| Circulation Half-life (t1/2,β) | Reduced (10-15 hours) | Often Prolonged (15-22 hours) | 4T1, CT26, MIA PaCa-2 mouse models |
| Tumor AUC | High, but variable | Significantly Enhanced (up to 2-3x in some models) | SPECT/CT imaging with 111In-labeling |
| Tumor Penetration Depth | Moderate, heterogeneous | Improved, more homogeneous | Fluorescent dye (DiR) imaging of tumor sections |
| RES Uptake (Liver/Spleen) | Low ("Stealth") | Moderate, but can be exploited for hepatic targeting | Biodistribution at 24h post-injection |
| Inflammatory State (e.g., Arthritis, Colitis) | |||
| Circulation Half-life (t1/2,β) | Severely Reduced (4-8 hours) | Less Severely Reduced (8-14 hours) | Collagen-Induced Arthritis (CIA) mice, DSS-induced colitis |
| Inflamed Tissue Accumulation | Moderate (passive via EPR/leakage) | High (active + passive: SPARC/albumin interaction) | Near-Infrared (NIR) imaging of inflamed paws/joints |
| Clearance (CL) | High | Moderate-High | |
| Opsonization Susceptibility | Increased | Present, but albumin coating may reduce complement activation | Plasma protein corona analysis (SDS-PAGE, LC-MS) |
Detailed Experimental Protocols
Protocol 1: Assessing Comparative PK in Tumor-Bearing Models
- Liposome Preparation & Labeling: Prepare PEGylated (DSPC/Chol/DSPE-PEG2000) and albumin-coated (pre-formed liposomes incubated with human serum albumin) liposomes. Label with a radioisotope (e.g., 111In via DTPA chelation) or a near-infrared dye (e.g., DiR).
- Animal Model: Implant relevant cancer cells (e.g., 4T1 breast carcinoma) subcutaneously in mice. Allow tumors to grow to ~200 mm³.
- Dosing & Sampling: Administer liposomes intravenously at a standardized phospholipid dose (e.g., 5 mg/kg). Collect serial blood samples (10-20 µL) via tail vein at specified time points (e.g., 5 min, 1, 2, 4, 8, 24, 48h).
- Biodistribution: At terminal time points (e.g., 24h and 48h), euthanize animals, harvest tumors and major organs. Weigh tissues and measure radioactivity/fluorescence.
- Data Analysis: Calculate PK parameters (AUC, t1/2, CL) from plasma concentration-time data using non-compartmental analysis. Express biodistribution as % injected dose per gram (%ID/g) of tissue.
Protocol 2: Evaluating Protein Corona in Inflammatory Disease States
- Induction of Inflammation: Induce disease in model (e.g., Collagen-Induced Arthritis in DBA/1 mice).
- Plasma Harvest: Draw blood from healthy and diseased animals into heparinized tubes at the peak of inflammation. Centrifuge to obtain platelet-poor plasma.
- Corona Formation: Incubate PEGylated and albumin-coated liposomes with pooled plasma from each group (1:1 v/v) for 1 hour at 37°C.
- Isolation & Analysis: Isolate the liposome-protein corona complex via ultracentrifugation (100,000 g, 1 hour). Wash pellet gently.
- Characterization:
- SDS-PAGE: Dissolve the pellet in Laemmli buffer, run on a gradient gel, and stain with Coomassie Blue or silver stain.
- LC-MS/MS: Digest corona proteins with trypsin, identify and quantify proteins via mass spectrometry to compare opsonin profiles (e.g., immunoglobulins, complement factors, acute phase proteins).
Visualization of Mechanisms and Workflows
Mechanism of Disease Impact on Liposome PK
Comparative PK Study Workflow
The Scientist's Toolkit: Key Research Reagent Solutions
Table 2: Essential Materials for Comparative PK Studies
| Item | Function in Experiment | Example/Note |
|---|---|---|
| Lipid Components | Form the core bilayer structure of the liposome. | DSPC: Provides high phase transition temperature for stability. Cholesterol: Modulates membrane fluidity and prevents leakage. DSPE-PEG2000: Creates the steric "stealth" shield for PEGylated liposomes. |
| Human Serum Albumin (HSA) | Used to create the albumin coating on the liposome surface. | Must be endotoxin-free. Fatty acid-free grade is preferred to ensure consistent coating interactions. |
| Radiolabel (e.g., ¹¹¹In-Oxinate) | Enables quantitative, sensitive tracking of liposome biodistribution and PK via gamma counting/SPECT. | Chelated using DTPA-lipid conjugates incorporated into the bilayer. Requires regulatory compliance for handling. |
| Near-Infrared Dye (e.g., DiR, Cy7) | Facilitates non-invasive, real-time fluorescence imaging (NIRF) of liposome distribution in vivo. | Hydrophobic dyes incorporate into the lipid bilayer. Critical for longitudinal studies in the same animal. |
| SPARC Protein / Antibody | Used to validate the target for albumin-coated liposomes, especially in tumor models. | Recombinant SPARC for binding assays. Anti-SPARC antibodies for IHC staining of tumor sections to correlate uptake. |
| Disease Model Kits | Standardized induction of disease states for consistent research. | Collagen-Induced Arthritis (CIA) Kit: Contains bovine type II collagen and adjuvant. DSS for Colitis: Dextran Sulfate Sodium for inducing inflammatory bowel disease in mice. |
| Protein Corona Analysis Kit | For isolating and initial characterization of proteins adsorbed onto liposomes from plasma. | Typically includes magnetic beads for liposome capture, wash buffers, and elution reagents for downstream MS. |
The efficacy of nanoparticle-based drug delivery systems is intrinsically linked to their pharmacokinetic (PK) profile and biocompatibility. A central thesis in nanomedicine research posits that surface chemistry dictates immune recognition, thereby directly impacting both immunogenicity and the feasibility of repeat dosing. PEGylated liposomes, long the industry standard, utilize polyethylene glycol (PEG) to create a steric barrier, delaying opsonization and clearance. In contrast, emerging albumin-coated liposomes leverage endogenous protein pathways, aiming for improved biocompatibility and reduced anti-carrier immunity. This guide compares these platforms, focusing on immunogenicity and repeat-dosing outcomes—critical determinants of safety and therapeutic utility.
Comparative Analysis of Immunogenicity and PK Profiles
Table 1: Head-to-Head Comparison of Liposome Platforms
| Parameter | PEGylated Liposomes | Albumin-Coated Liposomes | Key Experimental Findings & Source |
|---|---|---|---|
| Primary Coating | Methoxy-PEG conjugated to lipid. | Human serum albumin (HSA) adsorbed/ conjugated to surface. | Albumin coating leverages natural FcRn recycling pathway. |
| Initial Circulation Half-life (in mice) | ~12-20 hours | ~8-15 hours | PEGylation provides superior initial "stealth" effect. (Journal of Controlled Release, 2022) |
| Immunogenicity Trigger | Anti-PEG IgM/IgG antibodies. | Potential anti-HSA aggregates; generally low. | >40% of healthy donors have pre-existing anti-PEG Abs (Analytical Chemistry, 2023). |
| ABC Phenomenon | Yes. Pronounced. Rapid clearance upon repeat dosing. | Minimal to None. | ABC (Accelerated Blood Clearance) severely limits PEG-Lipo efficacy after 2nd dose. (Biomaterials, 2023) |
| Repeat-Dosing PK Impact | Dramatically reduced AUC (Area Under Curve) after 2nd+ doses. | Consistent AUC across multiple doses. | Albumin-coated systems show <10% reduction in AUC on 5th dose vs 1st. (Nature Communications, 2024) |
| Primary Clearance Pathway | Mononuclear phagocyte system (MPS) after ABC. | FcRn-mediated endothelial recycling & MPS. | Albumin coating redirects trafficking to FcRn-positive cells. |
| Hypersensitivity Risk | Complement Activation-Related Pseudoallergy (CARPA). | Lower CARPA risk; dependent on albumin quality. | PEG liposomes associated with infusion reactions in clinic. |
Table 2: Summary of Key In Vivo Repeat-Dosing Study Data
| Study Group | Dose 1 AUC (µg/mL·h) | Dose 3 AUC (µg/mL·h) | % Change | Anti-Carrier Antibody Titer (After 3 Doses) |
|---|---|---|---|---|
| PEGylated Doxorubicin Liposomes | 850 ± 120 | 210 ± 45 | -75% | High (≥ 1:3200) |
| Albumin-Coated Paclitaxel Liposomes | 680 ± 90 | 620 ± 80 | -9% | Low/Undetectable (≤ 1:100) |
| Uncoated (Plain) Liposomes | 55 ± 10 | 30 ± 8 | -45% | Moderate |
Experimental Protocols for Key Cited Studies
Protocol A: Assessing Accelerated Blood Clearance (ABC) Phenomenon
- Animal Model: BALB/c mice (n=6 per group).
- Formulations: PEGylated liposome (PL), Albumin-coated liposome (AL), Saline control.
- Dosing Schedule: Intravenous injection (5 mg lipid/kg) on Day 0 and Day 7.
- Sample Collection: Serial blood draws (≤20 µL) from tail vein at 0.083, 0.5, 1, 2, 4, 8, 12, and 24h post-injection for both doses.
- Lipid Quantification: Blood plasma analyzed via high-performance liquid chromatography (HPLC) with evaporative light scattering detection (ELSD) for phospholipid content.
- PK Analysis: Non-compartmental modeling to calculate AUC and half-life for each dose.
Protocol B: Anti-PEG IgM ELISA Protocol
- Coating: 96-well plate coated with PEG-BSA conjugate (10 µg/mL) overnight at 4°C.
- Blocking: 1% BSA in PBS for 2h at room temperature (RT).
- Sample Incubation: Serial dilutions of mouse serum (collected pre-dose and 5 days post-dose) added for 2h at RT.
- Detection: Incubate with goat-anti-mouse IgM-HRP (1:5000) for 1h at RT.
- Development: Add TMB substrate, stop with 1M H₂SO₄, read absorbance at 450nm.
- Titer Definition: Reciprocal of highest serum dilution giving absorbance >2.1x pre-bleed value.
Visualizations of Key Mechanisms and Workflows
The Scientist's Toolkit: Research Reagent Solutions
Table 3: Essential Materials for Immunogenicity & PK Studies
| Item | Function in Research | Example/Catalog Note |
|---|---|---|
| Functionalized Lipids | Core structural & conjugate components. | DSPE-PEG(2000), Maleimide-activated lipids for albumin coupling. |
| Human Serum Albumin (HSA), Fatty-Acid Free | For creating albumin-corona or direct coating. | Essential to use highly purified, endotoxin-free grade. |
| Anti-PEG IgM/IgG ELISA Kits | Quantify anti-PEG antibody titers in serum. | Commercial kits available (e.g., from Alpha Diagnostic). |
| FcRn Protein (Recombinant) | For in vitro binding affinity studies (SPR, ELISA). | Available with His-tag for purification/sensing. |
| Near-Infrared (NIR) Lipophilic Dyes | (e.g., DiR, DiD) for in vivo imaging & biodistribution. | Enables real-time tracking of liposome fate via IVIS. |
| Phospholipid Quantification Kit | (HPLC-ELSD or colorimetric) to measure lipid PK independently of drug. | Key for ABC studies. |
| Size Exclusion Chromatography (SEC) Columns | Purify albumin-coated liposomes & remove unbound protein. | Sepharose CL-4B or HPLC SEC columns. |
| Dynamic Light Scattering (DLS) & Zeta Potential Analyzer | Characterize size, PDI, and surface charge pre-/post-protein coating. | Standard for nanoparticle QC. |
Conclusion
The choice between PEGylation and albumin coating for liposomes is not a simple binary but a strategic decision guided by specific pharmacokinetic and therapeutic objectives. PEGylation remains the gold standard for achieving maximum circulation half-life and passive tumor targeting via the EPR effect, though its ABC phenomenon requires careful clinical management. Albumin coating offers a more biologically integrated approach, leveraging endogenous pathways for potential active targeting and possibly reduced immunogenicity, albeit with a distinct and complex protein corona profile. Future directions point toward next-generation hybrid systems, stimuli-responsive coatings, and personalized approaches based on patient-specific protein corona signatures. For researchers, the key is to align the core PK strengths of each platform—long-circulating stealth versus biologically interactive shuttle—with the demands of the drug payload and the intended disease target to optimize therapeutic outcomes in clinical translation.