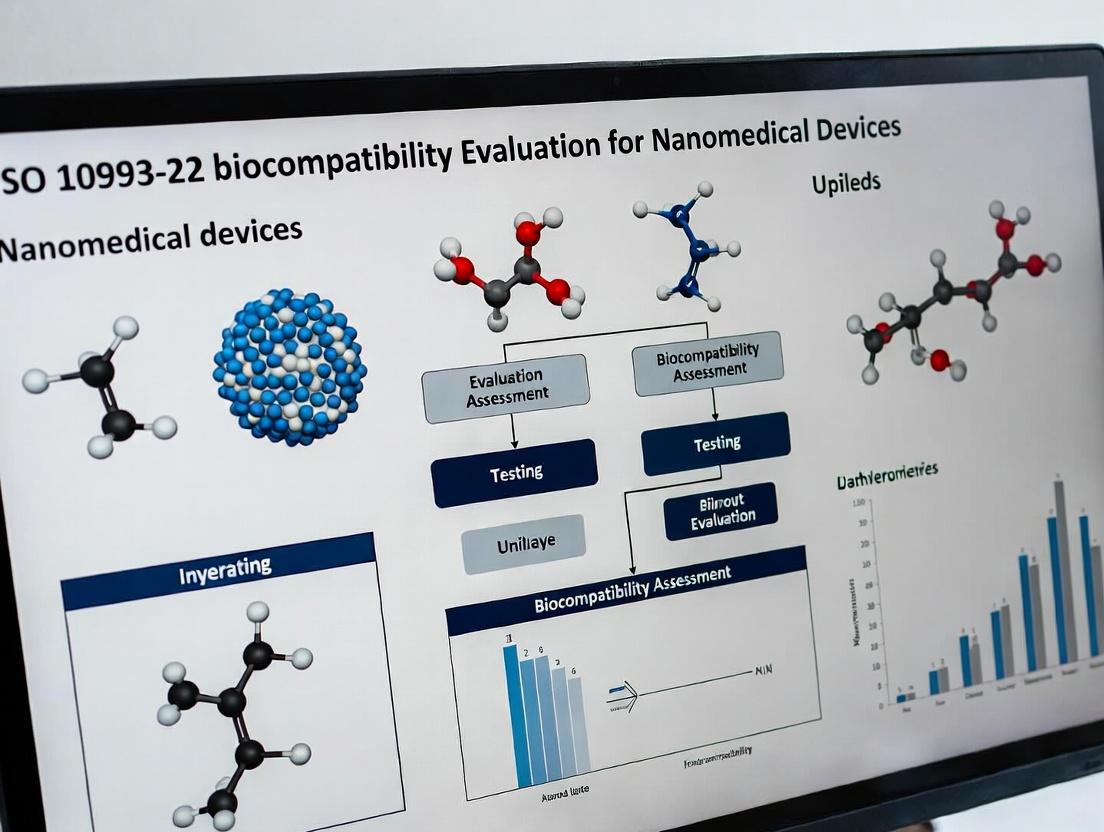
Navigating ISO 10993-22: A Complete Guide to Nanomaterial Biocompatibility Testing for Medical Devices
This comprehensive guide examines the application of ISO 10993-22:2017 for evaluating the biocompatibility of nanomaterial-based medical devices and drug delivery systems.
Navigating ISO 10993-22: A Complete Guide to Nanomaterial Biocompatibility Testing for Medical Devices
Abstract
This comprehensive guide examines the application of ISO 10993-22:2017 for evaluating the biocompatibility of nanomaterial-based medical devices and drug delivery systems. It provides researchers and development professionals with foundational knowledge of nanomaterial-specific risks, detailed methodologies for physicochemical characterization and toxicological assessment, strategies to overcome common testing challenges, and frameworks for validating and comparing data against traditional materials. The article synthesizes current standards, best practices, and emerging considerations to support regulatory strategy and safe innovation in nanomedicine.
Understanding the Nano-Specific Paradigm: Why ISO 10993-22 is Essential for Nanomedical Devices
The classification of a nanomaterial as a 'medical device' is pivotal for determining the appropriate regulatory pathway for its biocompatibility evaluation under the ISO 10993 series. ISO 10993-22:2022, "Guidance on nanomaterials," specifically addresses this challenge. A nanomaterial intended for medical use can be classified as a medical device, a drug-device combination, or a medicinal product, depending on its primary mode of action (PMOA). According to ISO 10993-22, a nanomaterial is considered a medical device if its principal intended action, as defined by the manufacturer, is achieved by physical or mechanical means, including physical barrier, nanostructural topography, or mechanical action at the nanoscale, and not by pharmacological, immunological, or metabolic means.
This application note provides a structured framework and experimental protocols for researchers to systematically determine if a nanomedical product falls under the medical device scope of ISO 10993-22.
Table 1: Key Differentiators Between Nanomaterial-Based Medical Devices and Medicinal Products
| Criteria | Nanomaterial Medical Device | Nanomaterial Medicinal Product |
|---|---|---|
| Primary Mode of Action (PMOA) | Physical/Mechanical (e.g., structural support, mechanical reinforcement, surface-guided tissue growth) | Pharmacological/Immunological/Metabolic (e.g., drug delivery, gene silencing, enzyme replacement) |
| Regulatory Focus (ISO 10993-22) | Biocompatibility of the nanostructure: particle shedding, durability, physicochemical characterization. | Safety and efficacy of the active substance; nanocarrier is often considered an excipient. |
| Key Risk | Long-term tissue response, particulate wear debris, nanoscale wear and degradation. | Toxicity, immunogenicity, biodistribution, pharmacokinetics of the nanocarrier and payload. |
| Example | Nanostructured titanium dental implant (osteointegration via surface topography). | Liposomal doxorubicin (chemotherapy via intracellular drug release). |
Application Note: Establishing the PMOA for Scope Definition
A stepwise assessment is required to define the scope.
Step 1: Intended Purpose Analysis. Clearly define the manufacturer's intended purpose from the product labeling and claims. Step 2: PMOA Identification. Conduct a critical review of available scientific data (in vitro, in vivo, computational) to identify the mechanism by which the product achieves its intended purpose. The central question is: "Is the therapeutic/diagnostic effect primarily due to the nanomaterial's physical presence/interaction or due to a chemical/biochemical interaction it facilitates?" Step 3: Boundary Analysis. For combination products, determine if the device and drug components are integral or separate. An integral combination product where the action is inseparable requires a unified assessment, often led by the PMOA.
Table 2: Quantitative Physicochemical Characterization Requirements per ISO 10993-22
| Parameter | Method (Example) | Relevance to Device Scope |
|---|---|---|
| Particle Size & Distribution | Dynamic Light Scattering (DLS), TEM. | Determines if material is a nanomaterial (1-100 nm). Affects biological interaction. |
| Surface Area (BET) | Gas adsorption (BET method). | Critical for assessing dose and reactivity; high surface area increases interaction potential. |
| Surface Chemistry & Charge | XPS, Zeta Potential. | Influences protein adsorption, cellular adhesion, and biocompatibility. |
| Degree of Agglomeration | SEM, DLS with sonication protocols. | Agglomerates behave differently from primary particles; impacts biological response. |
| Particle Release/Shedding | ICP-MS, ELISA in simulated body fluids. | Key for device safety: quantifies potentially hazardous debris. |
Title: Decision Flowchart for Nanomaterial Product Classification
Experimental Protocols for PMOA Determination
Protocol 1: Differentiating Surface-Topography Mediated Action (Device) from Biochemical Signaling (Drug)
Aim: To determine if cellular response (e.g., osteoblast adhesion) is due to nanostructured surface topography (physical device action) or a bioactive coating (pharmacological action).
Materials:
- Test Article: Nanostructured surface (e.g., TiO2 nanotubes).
- Control 1: Smooth surface of identical material.
- Control 2: Nanostructured surface with a pharmacological inhibitor of a key signaling pathway (e.g., RGD peptide inhibitor for integrin signaling).
- Cells: Relevant cell line (e.g., MC3T3-E1 osteoblasts).
Method:
- Characterization: Quantify surface roughness (AFM), nanotube diameter (SEM), and chemistry (XPS) for test and control surfaces.
- Cell Seeding: Seed cells at standardized density on all surfaces in serum-free medium for a defined period (e.g., 4h).
- Functional Assay: Measure early adhesion events: a. Quantitative Cell Adhesion: Fix cells and count via crystal violet assay or automated imaging. b. Focal Adhesion Analysis: Immunofluorescence staining for vinculin/paxillin. Analyze number and size of focal adhesions. c. Signaling Pathway Activation: Perform Western Blot on lysates for phosphorylated vs. total FAK, ERK.
- Data Interpretation:
- If cell adhesion/activation is significantly higher on the nanostructured surface vs. smooth control, AND is not inhibited by the pharmacological inhibitor, the PMOA is likely physical (device).
- If the enhanced response on the nanostructured surface is abolished by the inhibitor, the response is dependent on that biochemical pathway, suggesting a pharmacological component may be primary.
Protocol 2: Assessing Particulate Release from a Nanostructured Device
Aim: To quantify the release of nanoparticles/nanomaterial debris from a device under simulated physiological conditions, as required by ISO 10993-22 for risk assessment.
Materials:
- Test Device: Nanostructured medical device (e.g., nanocomposite bone cement).
- Extraction Media: Simulated body fluid (SBF) or relevant biological fluid analog (e.g., synovial fluid for joint implants).
- Analytical Equipment: Ultracentrifuge, ICP-MS, Nanoparticle Tracking Analysis (NTA) system, TEM grids.
Method:
- Dynamic Extraction: Immerse the device in extraction media in a sealed container. Agitate in an incubator (37°C) at physiologically relevant cycles (e.g., 1 Hz for 30 days for a joint implant).
- Sampling: Withdraw aliquots at defined time points (e.g., 1, 7, 14, 30 days). Perform serial centrifugation/ultrafiltration to separate particles by size.
- Quantification & Characterization: a. Mass Concentration: Use ICP-MS to quantify the total mass of released elemental material. b. Particle Number & Size: Use NTA or DLS on the sub-1000 nm fraction to determine particle size distribution and concentration. c. Morphology: Deposit particles from suspension onto TEM grids for imaging.
- Data Reporting: Report cumulative release profiles (mass and particle number over time). Compare release kinetics to biocompatibility thresholds derived from toxicological assessments.
Title: Protocol for Assessing Nanoparticle Release from Devices
The Scientist's Toolkit: Key Research Reagent Solutions
Table 3: Essential Materials for Nanomaterial Medical Device Evaluation
| Item / Reagent Solution | Function in Evaluation | Example & Rationale |
|---|---|---|
| Simulated Body Fluids (SBF) | Provides physiologically relevant ionic environment for extraction and degradation studies. | Kokubo's SBF: Mimics human blood plasma ion concentration; used to test bioactivity and particle release. |
| Protein Adsorption Assay Kits | Quantifies the protein corona formed on nanomaterial surfaces, critical for understanding biological identity. | Micro-BCA Assay: After exposure to serum or plasma, measures total adsorbed protein. Affects cell-material interaction. |
| Integrin Pathway Inhibitors | Pharmacological tools to dissect physical vs. biochemical cell adhesion mechanisms. | Cilengitide (RGD mimetic): Inhibits αvβ3/αvβ5 integrins. If cell response to nanostructure is inhibited, PMOA may be biochemical. |
| ROS Detection Probes | Measures reactive oxygen species generation, a key nanotoxicity mechanism for particulates. | DCFH-DA: Cell-permeable probe that fluoresces upon oxidation. High ROS may indicate a toxicological risk from debris. |
| Standard Reference Nanomaterials | Positive/Negative controls for analytical methods and biological assays. | NIST Gold Nanoparticles (e.g., RM 8011): Provide known size, shape, and concentration for calibrating NTA, DLS, and biological response assays. |
Introduction Within the framework of ISO 10993-22:2022 (“Biological evaluation of medical devices - Part 22: Guidance on nanomaterials”), the assessment of biocompatibility is fundamentally rooted in understanding the biointeractions initiated by a nanomaterial’s physicochemical properties. This document outlines the core principles governing these interactions and provides detailed protocols for their characterization, which is critical for the safety evaluation of nanomedical devices and drug delivery systems.
1. Core Properties and Biointeraction Summary The primary physicochemical properties of nanomaterials dictate their biological identity, distribution, clearance, and toxicity. The key relationships are summarized in the table below.
Table 1: Core Physicochemical Properties and Their Primary Biointeractions
| Property | Typical Measurement Range | Key Biological Consequence (ISO 10993-22 Context) | Associated Endpoint |
|---|---|---|---|
| Size (Hydrodynamic Diameter) | 1 nm - 1000 nm | Cellular uptake mechanism, biodistribution, renal clearance (< ~8 nm). | Pharmacokinetics, distribution, elimination. |
| Surface Charge (Zeta Potential) | -50 mV to +50 mV | Plasma protein corona composition, membrane interaction, cytotoxicity. | Hemocompatibility, systemic toxicity. |
| Surface Chemistry/Functionalization | N/A (Qualitative) | Stealth properties (e.g., PEGylation), targeting (e.g., RGD peptides), catalytic activity. | Immunotoxicity, thrombogenicity, intended therapeutic effect. |
| Aspect Ratio | 1 (spherical) to >100 (fibers) | Macrophage frustrated phagocytosis, membrane perturbation, fiber pathogenicity. | Chronic inflammation, granuloma formation. |
| Dissolution Rate / Ion Release | Variable (e.g., µg/mL/day) | Chemical species-specific toxicity (e.g., Ag⁺, Zn²⁺), reactive oxygen species (ROS) generation. | Systemic toxicity, genotoxicity, local tissue damage. |
2. Key Experimental Protocols
Protocol 2.1: Comprehensive Characterization of Nanoparticle Dispersions (Prior to Biological Testing) This protocol aligns with ISO 10993-22 clauses on material characterization.
- Sample Preparation: Disperse the nanomaterial in the relevant biological medium (e.g., cell culture medium with 10% serum) at 10x the intended test concentration. Sonicate using a bath or probe sonicator (e.g., 50 J/mL energy input) to achieve a monodisperse suspension.
- Hydrodynamic Size & Zeta Potential (DLS): Using a dynamic light scattering (DLS) instrument, dilute the sonicated dispersion 1:10 in the same medium. Equilibrate at 25°C for 2 min. Measure size (Z-average, PDI) and zeta potential via phase analysis light scattering (M3-PALS). Perform minimum triplicate measurements.
- Nanoparticle Tracking Analysis (NTA): Dilute dispersion in filtered PBS to achieve 20-100 particles per frame. Inject sample into NTA chamber. Capture 60-second videos (5 repeats) with camera level set to visualize individual particle scattering. Analyze to determine particle concentration (particles/mL) and size distribution profile.
- Protein Corona Analysis: Incubate nanoparticle dispersion (1 mg/mL) in 100% human plasma at 37°C for 1 hour. Centrifuge at 100,000 x g for 1 hour. Wash pellet gently 3x with PBS. Elute proteins from pellet with Laemmli buffer for SDS-PAGE, or use trypsin digestion for LC-MS/MS identification.
Protocol 2.2: In Vitro Assessment of Cellular Uptake and Intracellular Fate This protocol supports evaluation of biological interactions per ISO 10993-22.
- Cell Seeding: Seed relevant cell line (e.g., THP-1 derived macrophages, HepG2) in 24-well plates at 1x10⁵ cells/well. Culture for 24 hours.
- Nanoparticle Exposure: Prepare serial dilutions of nanoparticles in complete medium. Replace cell medium with nanoparticle-containing medium. Include a negative control (medium only).
- Internalization Quantification (ICP-MS): After exposure (e.g., 4h, 24h), wash cells 3x with EDTA-containing PBS (5 mM) to remove membrane-bound particles. Lyse cells with concentrated nitric acid. Digest overnight at 65°C. Dilute and analyze for nanoparticle core element (e.g., Ag, Si, Ti) via ICP-MS. Normalize to total cellular protein.
- Intracellular Localization (CLSM): Use fluorescently-labeled nanoparticles or stain lysosomes with LysoTracker. After exposure, fix cells with 4% PFA, permeabilize with 0.1% Triton X-100, and stain actin cytoskeleton with phalloidin. Image using a confocal laser scanning microscope (CLSM) with appropriate laser lines and sequential scanning to avoid bleed-through.
Protocol 2.3: Assessment of ROS Generation A key protocol for evaluating oxidative stress, a precursor to many toxicological outcomes.
- Reagent Preparation: Prepare 10 mM DCFH-DA stock in DMSO. Prepare working solution in serum-free medium at 10 µM.
- Cell Loading: Wash cells (e.g., in a 96-well black plate) with PBS. Add DCFH-DA working solution. Incubate 45 min at 37°C.
- Nanoparticle Challenge & Measurement: Remove DCFH-DA solution. Add nanoparticle dispersions in phenol-free medium. Immediately measure fluorescence (Ex: 485 nm, Em: 535 nm) kinetically every 30 minutes for 6 hours using a plate reader. Include a positive control (e.g., 100 µM tert-butyl hydroperoxide) and blank (nanoparticles in medium without cells).
- Data Analysis: Calculate area under the curve (AUC) for fluorescence vs. time for each treatment. Express as fold-change relative to untreated control.
3. Visualizations
Title: Nanomaterial Properties Dictate Biological Fate
Title: Dissolution-Dependent Apoptotic Pathway
4. The Scientist's Toolkit: Key Research Reagent Solutions
| Item / Reagent | Function in Nanomaterial Biointeraction Studies |
|---|---|
| Dispersants (e.g., BSA, Pluronic F-127) | Provides stable, monodisperse nanoparticle suspensions in biological media, preventing aggregation for consistent dosing. |
| DCFH-DA / CellROX Assays | Cell-permeable fluorescent probes for detecting and quantifying intracellular reactive oxygen species (ROS) generation. |
| LysoTracker Dyes | Fluorescent weak-base probes that accumulate in acidic compartments (lysosomes) for co-localization studies with nanoparticles. |
| ICP-MS Standard Solutions | Certified reference materials for calibrating inductively coupled plasma mass spectrometry, enabling precise quantification of metal-based nanoparticle uptake or dissolution. |
| Protease Inhibitor Cocktails | Added during protein corona isolation to prevent degradation and preserve the authentic corona profile for mass spectrometry analysis. |
| Defined Serum/Plasma (e.g., Human AB Serum) | Standardized biological fluid for protein corona formation studies, reducing batch-to-batch variability compared to fetal bovine serum (FBS). |
Within the framework of ISO 10993-22, "Biological evaluation of medical devices — Part 22: Guidance on nanomaterials," the biocompatibility evaluation of nanomedical devices necessitates a detailed understanding of specific physico-chemical (PC) properties. These properties are not merely characteristics but are pivotal risk factors that dictate the nanomaterial's interactions with biological systems. This application note details protocols for characterizing these key risk factors—size, surface charge (zeta potential), shape, agglomeration state, and degradation kinetics—as critical prerequisites for a scientifically rigorous biological safety assessment.
Risk Factor: Size & Agglomeration/Aggregation State
Rationale: Size directly influences cellular uptake, biodistribution, clearance pathways, and intrinsic toxicity. The primary particle size, hydrodynamic diameter in relevant biological media (e.g., ISO 10993-5 extractants), and agglomeration state are mandatory determinations per ISO 10993-22.
Protocol 1.1: Dynamic Light Scattering (DLS) for Hydrodynamic Size & PDI
Objective: To determine the intensity-weighted mean hydrodynamic diameter (Z-average) and polydispersity index (PDI) of nanoparticles in suspension, simulating conditions of biological evaluation.
Materials:
- Nanoparticle suspension (in water and in relevant extract media: e.g., saline, cell culture medium with 10% serum).
- Disposable cuvettes (low volume, polystyrene).
- DLS instrument (e.g., Malvern Zetasizer Nano ZS).
Procedure:
- Sample Preparation: Dilute the nanoparticle stock to an appropriate concentration (e.g., 0.1-1 mg/mL) to avoid multiple scattering. Prepare samples in triplicate: (a) in deionized water, (b) in 0.9% NaCl, (c) in complete cell culture medium (DMEM + 10% FBS).
- Equilibration: Allow samples to incubate at 25°C for 15 minutes prior to measurement.
- Measurement: Transfer ~1 mL of sample to a cuvette. Place in instrument.
- Settings: Set temperature to 25°C (or 37°C for physiologically relevant data). Set number of runs to 3-5 measurements per sample.
- Data Acquisition: Run measurement. Record Z-average diameter (d.nm) and PDI.
- Analysis: Use the instrument software to view size distribution by intensity. A PDI < 0.2 indicates a monodisperse sample; >0.7 indicates a very broad distribution.
Protocol 1.2: Transmission Electron Microscopy (TEM) for Primary Particle Size & Shape
Objective: To obtain direct, high-resolution images for primary particle size distribution, shape, and core morphology.
Materials:
- Nanoparticle suspension (in ethanol or water, ~10 µg/mL).
- Carbon-coated copper TEM grids.
- Negative stain (e.g., 2% uranyl acetate) if required.
- TEM instrument.
Procedure:
- Grid Preparation: Glow-discharge TEM grids to make them hydrophilic.
- Sample Deposition: Apply 5-10 µL of diluted nanoparticle suspension onto the grid. Allow to adsorb for 1-2 minutes.
- Washing/Staining: Wick away excess liquid with filter paper. For biological coatings, apply a negative stain (e.g., 5 µL of 2% uranyl acetate for 30 seconds), then wick away and air dry.
- Imaging: Insert grid into TEM. Acquire images at various magnifications (e.g., 50kX, 100kX) from multiple grid squares.
- Image Analysis: Use software (e.g., ImageJ) to measure the diameter of at least 200 individual particles from multiple images. Calculate mean, standard deviation, and plot histogram.
Table 1: Representative Size & Agglomeration Data for Model Nanoparticles
| Material & Coating | Primary Size (TEM, nm) | Z-Ave in Water (DLS, nm) | Z-Ave in DMEM+10%FBS (DLS, nm) | PDI in Media | Inferred Agglomeration State |
|---|---|---|---|---|---|
| SiO2 (Plain) | 25 ± 3 | 28 ± 2 | 1250 ± 350 | 0.45 | Severe agglomeration |
| SiO2 (PEGylated) | 27 ± 4 | 35 ± 5 | 40 ± 8 | 0.15 | Stable, monodisperse |
| PLGA (Plain) | 105 ± 15 | 115 ± 10 | 450 ± 120 | 0.30 | Moderate aggregation |
| Gold Nanorods (CTAB) | 50 x 15 (L x W) | 55 ± 8 | >1000 | 0.60 | Severe agglomeration |
Diagram Title: Workflow for Nanoparticle Size & Agglomeration Risk Assessment
Risk Factor: Surface Charge (Zeta Potential)
Rationale: Zeta potential indicates colloidal stability and predicts interaction with charged biological components (e.g., cell membranes, proteins). Near-neutral charges may reduce non-specific interactions.
Protocol 2: Zeta Potential Measurement via Phase Analysis Light Scattering (PALS)
Objective: To measure the electrophoretic mobility and calculate zeta potential of nanoparticles in relevant dispersants.
Materials:
- As per Protocol 1.1.
- Folded capillary zeta cell.
Procedure:
- Sample Prep: Use the same triplicate samples prepared for DLS (water, saline, media).
- Cell Loading: Rinse the folded capillary cell with the sample, then fill it completely, ensuring no air bubbles.
- Instrument Settings: Set temperature to 25°C. Select the appropriate dispersant viscosity and dielectric constant model (e.g., water, saline). Set number of runs to 10-15.
- Measurement: The instrument applies a voltage, and the particle motion is measured via laser Doppler velocimetry.
- Analysis: Report the zeta potential (ζ) in millivolts (mV) as the mean and standard deviation of the measured runs. Smoluchowski model is typically used for calculation.
Table 2: Zeta Potential as a Stability & Risk Indicator
| Material & Coating | ζ in Water (mV) | ζ in DMEM+10%FBS (mV) | Colloidal Stability (in water) | Predicted Protein Interaction |
|---|---|---|---|---|
| Citrate-capped AuNP | -42 ± 3 | -12 ± 2 | High (Strong repulsion) | Moderate (Corona formation) |
| PEI-coated SiO2 | +35 ± 5 | -5 ± 1 | Moderate | High (Strong cationic attraction) |
| PEGylated Lipid NP | -3 ± 1 | -4 ± 1 | Steric stability | Very Low (Stealth property) |
| Plain PLGA | -28 ± 4 | -10 ± 3 | Moderate | High |
Risk Factor: Shape & Aspect Ratio
Rationale: Shape influences cellular internalization mechanisms, flow dynamics, and macrophage uptake. High-aspect-ratio materials may pose unique risks (e.g., fiber pathogenicity).
Protocol 3: Quantitative Shape Analysis from TEM/SEM
Objective: To quantify shape descriptors (aspect ratio, circularity) from electron microscopy images.
Procedure:
- Image Acquisition: Obtain high-contrast TEM/SEM images as in Protocol 1.2.
- Thresholding: Using ImageJ, convert images to binary (black/white) to isolate particles.
- Particle Analysis: Run "Analyze Particles" function. Set appropriate size limits to exclude debris.
- Data Export: Ensure measurements include: Area, Perimeter, Major Axis, Minor Axis, Circularity (4π*Area/Perimeter²).
- Calculations: Aspect Ratio = Major Axis / Minor Axis. Calculate mean and distribution for >200 particles.
Table 3: Shape Characterization Data
| Material | Predominant Shape | Mean Aspect Ratio ± SD | Circularity (Mean) | Relevant Biological Implication |
|---|---|---|---|---|
| Gold Nanospheres | Sphere | 1.1 ± 0.1 | 0.95 | Conventional endocytosis |
| Gold Nanorods | Rod | 3.5 ± 0.6 | 0.35 | Potential for altered uptake kinetics |
| Cellulose Nanocrystals | Needle | 15 ± 5 | 0.20 | High-aspect-ratio particle (HARP) risk |
| Mesoporous SiO2 | Irregular Sphere | 1.3 ± 0.2 | 0.85 | High surface area for drug load |
Risk Factor: Degradation Kinetics
Rationale: Understanding dissolution rate and byproduct generation is critical for subacute/chronic toxicity evaluation (ISO 10993-11, -13). It informs test duration and analyte choice.
Protocol 4: Accelerated Degradation Study in Simulated Biological Fluids
Objective: To quantify the mass loss or ion release over time under physiologically relevant conditions.
Materials:
- Nanoparticle powder.
- Simulated body fluid (SBF, pH 7.4) or acidic lysosomal fluid simulant (pH 5.0).
- Centrifugal filter units (e.g., 10 kDa MWCO).
- ICP-MS or spectrophotometer.
Procedure:
- Incubation: Disperse nanoparticles at 1 mg/mL in pre-warmed (37°C) degradation medium (SBF and pH 5.0 buffer). Use sealed vials placed in a shaking incubator (37°C, 100 rpm).
- Sampling: At predetermined time points (e.g., 1h, 24h, 7d, 14d, 30d), withdraw 1 mL aliquots in triplicate.
- Separation: Centrifuge samples aggressively (e.g., 50,000 x g, 30 min) or use ultrafiltration to separate undegraded particles from soluble degradation products.
- Analysis:
- For metal/metal oxide NPs (e.g., Fe3O4, ZnO): Acidify filtrate and measure metal ion concentration via ICP-MS.
- For polymer NPs (e.g., PLGA): Analyze filtrate for monomer (lactic/glycolic acid) via HPLC or monitor pH change.
- For silica NPs: Measure soluble silicic acid via molybdenum blue assay (spectrophotometry).
- Kinetics Modeling: Plot % mass dissolved or ion concentration vs. time. Fit data to appropriate model (e.g., zero-order, first-order, Higuchi).
Table 4: Degradation Kinetics of Model Nanomaterials
| Material | Medium (pH) | Degradation Half-life (t½) | Key Degradation Product | Analytical Method |
|---|---|---|---|---|
| ZnO Nanoparticles | PBS (7.4) | ~2 hours | Zn²⁺ ions | ICP-MS |
| PLGA (50:50) | PBS (7.4) | ~14 days | Lactic & Glycolic Acid | HPLC |
| Mesoporous SiO2 | SBF (7.4) | >60 days | Silicic Acid | Spectrophotometry |
| Fe3O4 (Magnetite) | Lysosomal Simulant (5.0) | ~30 days | Fe²⁺/Fe³⁺ ions | ICP-MS |
Diagram Title: Degradation Pathway & Biological Implications
The Scientist's Toolkit: Research Reagent Solutions
Table 5: Essential Materials for Nanomaterial Risk Factor Characterization
| Item | Function & Relevance to ISO 10993-22 |
|---|---|
| Simulated Body Fluid (SBF) | A solution with ionic concentration similar to human blood plasma, used for in vitro degradation and bioactivity studies (ISO 23317). |
| Dispersants for Stock Suspensions | Stable, biocompatible dispersants (e.g., 0.1% BSA, 1 mM citrate buffer) for creating reproducible nanoparticle stock per ISO/TR 10993-22 guidance. |
| Serum-Containing Cell Culture Media | Essential medium for DLS/zeta potential measurements to predict the formation of the "protein corona," which defines the biological identity of the NP. |
| Certified Reference Nanoparticles | (e.g., NIST Au NPs, JRC silica NPs) Used for method validation and instrument calibration to ensure data reliability. |
| Ultrafiltration Centrifugal Units (e.g., 10-100 kDa MWCO) | For efficient separation of nanoparticles from soluble degradation products or proteins in corona studies. |
| ICP-MS Standard Solutions | For accurate quantification of metal ion release from degradable nanomaterials (e.g., Ag, Zn, Fe ions) in toxicity assays. |
| Uranyl Acetate (2%) or Phosphotungstic Acid | Common negative stains for TEM sample preparation, providing contrast for imaging polymer coatings or biological corona. |
The integration of nanomaterials into medical devices presents unique biocompatibility challenges. This application note provides a detailed framework for aligning the specialized requirements of ISO 10993-22:2017, "Biological evaluation of medical devices — Part 22: Guidance on nanomaterials," with the broader regulatory expectations of the U.S. Food and Drug Administration (FDA) and the European Union's Medical Device Regulation (EU MDR 2017/745). The objective is to establish a cohesive testing strategy that satisfies chemical and biological safety evaluations for nanomedical devices within a thesis research context.
Core Regulatory Comparison
The table below summarizes key quantitative and qualitative requirements from each regulatory source, highlighting areas for strategic bridging in a testing program.
Table 1: Comparison of Key Regulatory Requirements for Nanomaterial Evaluation
| Evaluation Aspect | ISO 10993-22:2017 (Nanomaterials-Specific) | FDA Guidance (e.g., "Use of ISO 10993-1", 2020) | EU MDR (2017/745) Annex I GSPRs |
|---|---|---|---|
| Risk Management Starting Point | Mandatory. Chemical characterization (ISO 10993-18) is critical first step. | Aligns with ISO 14971. Chemical characterization is foundational. | Required per Article 10(2). Chemical, physical, biological properties must be considered. |
| Sample Preparation (Key Concern) | Emphasizes testing under relevant dispersion states (agglomerated vs. dispersed). Use of relevant biological fluids/mechanical perturbation. | Expects justification for sample preparation method. Must reflect clinical use conditions. | Requires demonstration of safety under normal conditions of use. |
| Toxicokinetics | Assessment of absorption, distribution, metabolism, excretion (ADME) specifically for nano-forms is emphasized. | Systemic toxicity endpoints (e.g., subacute, chronic) require consideration of toxicokinetics. | General Safety Requirement: "…reduce as far as possible… risks linked to… traces of residues…" |
| Endotoxin Testing | Notes potential interference of nanomaterials with LAL or recombinant cascade tests. Recommishes validation of method. | Requires pyrogenicity testing per ISO 10993-11. LAL test (Bacterial Endotoxins Test) is standard. | Requires devices to be designed and manufactured to minimize risk of contamination. |
| Specific Endpoints for Nano | Explicitly calls for investigation of: Genotoxicity (with validated methods for nano), Hemolysis (surface-dependent), and Immunotoxicity. | Endpoints determined by nature and body contact (ISO 10993-1 matrix). No nano-specific list, but "new" materials scrutinized. | General requirements for freedom from unacceptable toxicity (Annex I, 10.4.1). |
| Test Article Justification | Requires thorough justification for the form of nanomaterial tested (e.g., pristine, coated, integrated into device). | Expects test articles to be final, finished devices or representative samples. | Requires testing on devices in their final state or representative samples. |
Integrated Experimental Protocols
Protocol 1: Sample Preparation & Physicochemical Characterization (Prerequisite)
Objective: To generate a stable, biologically relevant dispersion of the nanomaterial from the medical device for in vitro or in vivo testing, and characterize its key properties. Workflow:
- Extraction: Obtain nanomaterial via simulated use extraction per ISO 10993-12 and 10993-22. Use relevant physiological dispersants (e.g., PBS with 0.1% BSA, cell culture medium).
- Dispersion: Subject the extract to controlled, reproducible sonication (e.g., probe sonicator, 10-100 J/mL energy input). Validate method by dispersion stability over 24h.
- Characterization: Characterize the dispersed test article immediately before biological assays.
- Size Distribution: Dynamic Light Scattering (DLS) for hydrodynamic diameter (Z-average, PDI).
- Surface Charge: Zeta potential in relevant biological fluid (e.g., cell culture medium).
- Morphology: Transmission Electron Microscopy (TEM) on a dried aliquot.
- Chemical Identity: Inductively Coupled Plasma Mass Spectrometry (ICP-MS) for elemental concentration; FTIR for surface chemistry. Data Recording: Document all parameters (sonication time/energy, dispersant, concentration, storage conditions).
Protocol 2:In VitroCytotoxicity & Genotoxicity Assessment with Nano-Adaptations
Objective: To evaluate cell viability and genotoxic potential using methods validated for nanomaterial interference. Materials:
- Cell Lines: Recommended: L929 mouse fibroblasts (ISO 10993-5), TK6 human lymphoblastoid cells (OECD 487 for in vitro micronucleus).
- Assay Interference Controls: Include interference controls for assay-specific readouts (e.g., centrifugation steps to remove nanomaterials before absorbance/fluorescence measurement). Procedure (Cytotoxicity - MTT Assay Adaptation):
- Seed cells in 96-well plates and incubate for 24h.
- Prepare Test Concentrations: Use serially diluted nanomaterial dispersions from Protocol 1. Include a "nanomaterial-only" control (no cells) for each concentration to assess background interference.
- Exposure: Replace medium with test dispersions. Incubate for 24-72h.
- Mitigation of Interference: After exposure, carefully remove medium, wash monolayer gently with PBS twice to remove non-internalized particles.
- Add fresh medium containing MTT reagent. Incubate. Terminate and add solubilization buffer.
- Centrifugation: Centrifuge plate at 2000 x g for 10 minutes to pellet any suspended nanomaterials that could interfere with absorbance.
- Transfer supernatant to a new plate and measure absorbance at 570 nm.
- Calculate cell viability relative to vehicle control, correcting for background from "nanomaterial-only" wells. Procedure (Genotoxicity - In Vitro Micronucleus Assay Adaptation):
- Follow OECD TG 487 using TK6 cells.
- Include cytochalasin-B to block cytokinesis.
- Critical Wash Step: After exposure, wash cells thoroughly (minimum 2x) with fresh medium before further incubation to remove extracellular particles that could cause false-positive DNA damage during harvesting.
- Proceed to cell harvesting, hypotonic treatment, fixation, and staining.
- Score micronuclei in binucleated cells using automated imaging systems validated to distinguish micronuclei from internalized nanoparticle aggregates.
Protocol 3: Hemocompatibility Testing for Nanomaterials
Objective: To assess the potential for nanomaterial-induced hemolysis and platelet activation, considering high surface area. Procedure (Hemolysis - ASTM E2524-08 Adaptation):
- Collect fresh human whole blood in anticoagulant (heparin or citrate).
- Prepare test material dispersions in PBS. Use PBS as negative control (0% hemolysis) and 1% Triton X-100 as positive control (100% hemolysis).
- Mix 0.1 mL of whole blood with 0.9 mL of each test dispersion. Incubate at 37°C for 3h with gentle agitation.
- Centrifuge: Centrifuge tubes at 1500 x g for 10 min to separate blood cells and nanomaterials.
- Carefully aspirate supernatant. Measure absorbance of hemoglobin at 540 nm.
- Calculate % hemolysis: [(Abstest - Absnegative)/(Abspositive - Absnegative)] * 100.
- Interpretation: Per ISO 10993-4, materials with <2% hemolysis are generally considered non-hemolytic. Note: Nanomaterials may cause artifactual hemolysis if centrifugation is insufficient; validate pellet integrity.
The Scientist's Toolkit: Key Research Reagent Solutions
Table 2: Essential Materials for Nanomaterial Biocompatibility Testing
| Item / Reagent | Function / Rationale |
|---|---|
| Protein-containing Dispersant (e.g., 0.1% BSA in PBS) | Provides a physiologically relevant corona and stabilizes nanomaterial dispersions for biological testing, preventing agglomeration. |
| Dimethyl Sulfoxide (DMSO) USP Grade | High-purity solvent for preparing positive controls for genotoxicity assays (e.g., Mitomycin C, Ethyl Methanesulfonate). |
| LAL Endotoxin Test Kit (Chromogenic, Kinetic) | Quantifies bacterial endotoxin levels. Must be validated for use with nanomaterials to rule out interference (per ISO 10993-22). |
| Cryopreserved Human Whole Blood | Essential for hemocompatibility testing. Provides consistent, ethically sourced material for hemolysis, coagulation, and platelet tests. |
| Cell Lines with Metabolic Competence (e.g., HepaRG) | For advanced toxicokinetics studies (ADME). Useful for investigating potential metabolism of nanomaterials or their coatings. |
| Reference Nanomaterials (e.g., NIST Gold Nanoparticles, JRCNM-010a ZnO) | Critical positive/negative controls for method validation. Provide benchmark data for size, surface charge, and biological responses. |
| Probe Sonicator with Calorimetric Calibration | Ensures reproducible and quantifiable energy input during nanomaterial dispersion, a critical step per ISO 10993-22. |
Integrated Testing Strategy & Decision Logic
The following diagram outlines the logical flow for designing a biocompatibility testing plan that bridges ISO 10993-22 with FDA/EU MDR expectations.
Diagram Title: Integrated Testing Strategy Decision Logic
A successful biocompatibility evaluation for a nanomedical device requires a hybrid approach. Researchers must rigorously apply the nano-specific adaptations and sample preparation science mandated by ISO 10993-22, while ensuring the overall testing battery and rationale fully address the safety principles and general requirements of the FDA and EU MDR. The protocols and framework provided herein offer a concrete pathway to bridge these documents, forming a robust foundation for thesis research and eventual regulatory submission.
Within the framework of ISO 10993-22, "Biological evaluation of medical devices — Part 22: Guidance on nanomaterials," precise characterization of nanomaterial physico-chemical properties is a fundamental prerequisite for biocompatibility evaluation. The NOAA terminology (Nano-Object, their Aggregates and Agglomerates) is critical for nanomedical device research as it directly influences the material's interaction with biological systems—impacting fate, transport, protein corona formation, cellular uptake, and toxicity. Accurate identification and quantification of NOAA states are essential for establishing a valid dose metric, designing relevant tests, and interpreting biological response data, thereby moving beyond mass-based dosing to more predictive particle-number or surface-area-based assessments.
Critical Definitions and Quantitative Data
Table 1: Core NOAA Definitions and Key Characteristics
| Term | ISO Definition (ISO/TS 80004-2:2015) | Primary Bond Type | Reversibility (in biological media) | Typical Size Range | Impact on Biocompatibility (ISO 10993-22 Context) |
|---|---|---|---|---|---|
| Nano-Object | A material with one, two, or three external dimensions in the nanoscale (approx. 1–100 nm). | Covalent/Ionic | Not Applicable | 1 – 100 nm (in at least one dimension) | Primary unit of interaction; size & shape dictate initial protein binding and cellular recognition. |
| Aggregate | A particle comprising strongly bonded or fused nano-objects. Bonds are formed during synthesis or processing. | Strong (Covalent, Metallic, Fusion) | Generally irreversible under biological conditions. | >100 nm | Alters effective particle number, surface area, and dissolution kinetics. Treated as a single rigid unit in toxicological assessment. |
| Agglomerate | A collection of weakly bound nano-objects or aggregates. The binding forces can be weak (van der Waals, electrostatic). | Weak (van der Waals, electrostatic, capillary) | Often reversible (can de-agglomerate) under changing biological conditions (e.g., pH, protein adsorption). | >100 nm | Dynamic state; can dissociate, increasing bioavailability of primary units. Critical for dose extrapolation and particle transport studies. |
Table 2: Common Techniques for NOAA Characterization in Regulatory Science
| Technique | Primary Measurable Parameter(s) | Applicable NOAA State | Typical Data Output | Relevance to ISO 10993-22 |
|---|---|---|---|---|
| Dynamic Light Scattering (DLS) | Hydrodynamic diameter size distribution, polydispersity index (PDI). | Agglomerates/Aggregates in suspension. | Intensity-weighted mean size (Z-Avg), PDI. | Assessing particle behavior in liquid media; critical for in vitro test dispersion preparation. |
| Electron Microscopy (TEM/SEM) | Primary particle size, morphology, aggregation/agglomeration state. | All (with sample preparation artifacts). | Visual image, size distribution via manual/software analysis. | Gold standard for direct visualization; required for definitive classification of aggregates vs. agglomerates. |
| Centrifugal Liquid Sedimentation (CLS) | Particle size distribution based on sedimentation velocity. | All states in suspension. | Mass- or intensity-based size distribution. | High-resolution size data; effective for detecting sub-populations in polydisperse samples. |
| BET Gas Adsorption | Specific surface area (SSA). | Nano-objects, porous aggregates. | SSA (m²/g). | Key dose metric; surface area correlates with reactivity and often biological activity. |
| Asymmetric Flow Field-Flow Fractionation (AF4) | Separation by hydrodynamic size, coupled to detectors (MALS, DLS, UV). | Resolves populations of aggregates/agglomerates from primary objects. | Fractograms, size distributions. | Monitoring changes in NOAA distribution in biological fluids (protein corona studies). |
Experimental Protocols
Protocol 1: Preparation of Representative Nanomaterial Dispersions for In Vitro Testing (Based on OECD TG 412)
Objective: To generate a stable and reproducible dispersion of a nanomaterial that accurately represents its NOAA state for biocompatibility assays (e.g., cytotoxicity, genotoxicity).
Materials: See "The Scientist's Toolkit" below.
Procedure:
- Pre-wetting: Weigh the nanomaterial (e.g., 10 mg) into a clean glass vial. Add 1-2 mL of a pre-determined wetting agent (e.g., 0.05% bovine serum albumin in water) and let it sit for 1-2 hours to penetrate the powder.
- Primary Dispersion: Add the pre-wetted material to the main volume of dispersion medium (e.g., cell culture medium with serum, PBS with 0.05% BSA) to achieve a high concentration stock (e.g., 1 mg/mL). The presence of a biological dispersant is critical to mimic physiological conditions.
- Energy Input (Probe Sonication): a. Place the sample vial in an ice-water bath to prevent heating. b. Insert a titanium probe sonicator tip (~3 mm diameter) into the suspension, ensuring it is centered and immersed. c. Sonicate using a controlled protocol: e.g., 30% amplitude, 10 minutes total sonication time, with a pulse cycle of 10 seconds on, 20 seconds off. d. Record all parameters (amplitude, time, cycle, energy delivered).
- Characterization (Immediately Post-Dispersion): a. Measure the hydrodynamic diameter and PDI via DLS. b. Measure the zeta potential in the specific dispersion medium. c. Critical Step: Remove an aliquot for TEM grid preparation (negative staining) to visually confirm the NOAA state created by the dispersion protocol.
- Dilution: Dilute the characterized stock dispersion to desired test concentrations using the same dispersion medium. Vortex thoroughly before each dilution.
Protocol 2: Microscopic Differentiation Between Aggregates and Agglomerates
Objective: To use Transmission Electron Microscopy (TEM) to visually classify and quantify the NOAA state of a nanomaterial sample.
Procedure:
- Sample Preparation (Negative Stain): a. Dilute the nanomaterial dispersion (from Protocol 1) to a very low concentration (typically optical density < 0.1) using particle-free water or buffer. b. Glow-discharge a carbon-coated TEM grid for 30 seconds to make it hydrophilic. c. Pipette 5-10 µL of the diluted suspension onto the grid. Let adsorb for 1 minute. d. Wick away excess liquid with filter paper. e. Immediately apply 5-10 µL of a 1-2% aqueous solution of uranyl acetate or phosphotungstic acid (negative stain). Let sit for 30 seconds. f. Wick away the stain and allow the grid to air-dry completely.
- TEM Imaging: a. Image the grid at accelerating voltages of 80-120 kV. b. Systematically acquire images at multiple magnifications (e.g., low mag: 5,000-10,000x for large agglomerates; high mag: 50,000-200,000x for primary particles and aggregate boundaries).
- Image Analysis: a. Identify Primary Nano-Objects: Measure the dimensions of individual, distinct particles. b. Classify Aggregates: Look for particles sharing continuous, dense boundaries with no visible gap, indicating fusion or strong bonding. The outline is often angular or faceted. c. Classify Agglomerates: Look for clusters where individual particles or aggregates are in close proximity but separated by a thin, clear space (filled with stain), indicating a weak boundary. The overall shape is often irregular and fractal-like. d. Quantification: Report the percentage of particles existing as primary objects, within aggregates, or within agglomerates from a count of >500 particles across multiple images.
Visualization Diagrams
Title: NOAA States Influence Biological Pathway & ISO Assessment
Title: Protocol for Preparing NOAA Dispersions for Biocompatibility Tests
The Scientist's Toolkit: Essential Research Reagents & Materials
Table 3: Key Materials for NOAA Characterization & Dispersion
| Item | Function in NOAA Research | Example Product/Catalog |
|---|---|---|
| Bovine Serum Albumin (BSA), Low Endotoxin | Biological dispersant; mimics protein corona formation, stabilizes dispersions in physiological media. | Sigma-Aldrich, A9418 |
| Phosphate Buffered Saline (PBS), Particle-Free | Standard physiological buffer for washing and dispersion, filtered through 0.02 µm membrane. | Gibco, 10010023 |
| Uranyl Acetate, 2% Solution | Negative stain for TEM; provides high contrast for visualizing gaps in agglomerates. | Electron Microscopy Sciences, 22400 |
| Certified Reference Nanomaterials | Positive controls for size and shape (e.g., Au nanoparticles, SiO₂). Essential for protocol validation. | NIST RM 8011 (Au NPs), JRC NM-200 (SiO₂) |
| Disposable Probe Sonicator Tips (Titanium) | For applying controlled energy to break apart weak agglomerates without fracturing aggregates. | Qsonica, 4412 |
| Zeta Potential Calibration Standard | Verifies instrument performance for surface charge measurements. | Malvern Panalytical, DT50012 |
| Whatman Anodisc Inorganic Membrane Filters | For preparing TEM samples via filtration for fragile or low-concentration agglomerates. | Cytiva, 6809-6022 |
| Size Exclusion Chromatography Columns | Coupled with AF4 to separate NOAA populations by hydrodynamic size for detailed analysis. | Wyatt Technology, WTC-030S5 |
A Step-by-Step Testing Framework: Implementing ISO 10993-22 for Your Nanomedical Product
Within the framework of ISO 10993-22, "Guidance on nanomaterials," the Comprehensive Physicochemical Characterization (PCC) of nanomedical devices is not merely a preliminary step but the critical foundation for all subsequent biological safety and efficacy evaluations. The inherent properties of nanomaterials—size, shape, surface chemistry, and stability—directly influence their interactions with biological systems, dictating biodistribution, cellular uptake, toxicity, and overall biocompatibility. This Application Note details the essential protocols and methodologies for a rigorous PCC, ensuring data is actionable for ISO 10993-1 biocompatibility evaluation and regulatory submission.
Core Characterization Parameters & Quantitative Data
The following table outlines the mandatory and supplementary physicochemical parameters for nanomedical devices, aligned with ISO 10993-22 recommendations.
Table 1: Essential Physicochemical Parameters for Nanomaterial Characterization
| Parameter | Analytical Technique(s) | Key Metric(s) | Relevance to Biocompatibility (ISO 10993-22) |
|---|---|---|---|
| Size & Size Distribution | Dynamic Light Scattering (DLS), Nanoparticle Tracking Analysis (NTA), TEM/SEM | Hydrodynamic diameter (Z-average, PDI), Primary particle size, Number-based distribution | Influences immune clearance, vascular extravasation, and cellular internalization pathways. |
| Surface Charge (Zeta Potential) | Electrophoretic Light Scattering | Zeta Potential (mV) in relevant biological media (e.g., PBS, cell culture medium with serum) | Predicts colloidal stability in physiological fluids and interaction with cell membranes. |
| Morphology | Transmission Electron Microscopy (TEM), Scanning Electron Microscopy (SEM) | Shape (spherical, rod, etc.), Crystallinity, Agglomeration state | Shape affects phagocytosis and circulation time. Agglomeration can alter effective dose. |
| Surface Chemistry & Composition | X-ray Photoelectron Spectroscopy (XPS), Fourier-Transform Infrared Spectroscopy (FTIR), NMR | Elemental surface composition, Functional group identification, Grafting density | Determines protein corona formation, targeting ligand accessibility, and potential for oxidative stress. |
| Elemental & Molecular Composition | Inductively Coupled Plasma Mass Spectrometry (ICP-MS), Energy Dispersive X-ray Spectroscopy (EDS) | Concentration of elemental impurities, Drug/payload quantification | Critical for assessing trace metal impurities (per ISO 10993-18) and ensuring accurate dosing. |
| Batch-to-Batch Variability | Statistical analysis of above parameters across multiple batches (n≥3) | Mean, Standard Deviation, Coefficient of Variation | Required by regulators to demonstrate manufacturing consistency and reliable biological testing. |
Detailed Experimental Protocols
Protocol 2.1: Hydrodynamic Size and Zeta Potential by DLS
Principle: Dynamic Light Scattering measures Brownian motion to determine hydrodynamic size. Electrophoretic Light Scattering measures particle mobility in an applied electric field to calculate zeta potential.
Materials:
- Nanomaterial suspension (1 mg/mL in ultrapure water and relevant biological buffer)
- Disposable zeta potential cuvette and sizing cuvette
- DLS/Zeta Potential Analyzer (e.g., Malvern Zetasizer Nano series)
- 0.2 µm syringe filter
- pH meter
Procedure:
- Sample Preparation: Dilute the nanomaterial stock to an appropriate concentration (typically 0.1-1 mg/mL) to avoid multiple scattering. Filter the diluent (water or buffer) through a 0.2 µm filter.
- Size Measurement: a. Load 1 mL of sample into a clean sizing cuvette. b. Equilibrate at 25°C for 120 seconds. c. Perform measurement with automatic attenuation selection. Run a minimum of 3 sub-runs per measurement. d. Repeat for n=5 independent samples. Report the Z-average diameter and Polydispersity Index (PDI).
- Zeta Potential Measurement: a. Load 750 µL of sample into a dedicated folded capillary cell. b. Equilibrate at 25°C for 120 seconds. c. Set the instrument to automatic voltage and number of runs. d. Perform measurement in triplicate. Report the mean zeta potential and standard deviation.
- Data Analysis: Use the instrument's software to analyze intensity-based size distribution. Ensure the correlation function decays smoothly. For zeta potential, the Smoluchowski model is typically applied.
Protocol 2.2: Morphological Analysis by Transmission Electron Microscopy (TEM)
Principle: TEM uses a beam of electrons transmitted through an ultrathin specimen to produce high-resolution, two-dimensional images.
Materials:
- Carbon-coated copper TEM grids (200 mesh)
- Glow discharger
- Nanomaterial suspension (0.01 mg/mL in ultrapure water)
- Negative stain (2% uranyl acetate) or materials for cryo-TEM preparation (vitrobot, liquid ethane)
- Filter paper
- TEM with EDX capability
Procedure:
- Grid Preparation: Glow discharge the carbon-coated grids for 30-45 seconds to render the surface hydrophilic.
- Sample Application (Negative Stain): a. Apply 5-10 µL of dilute nanomaterial suspension onto the grid. Allow to adsorb for 60 seconds. b. Wick away excess liquid with filter paper. c. Immediately apply 5-10 µL of 2% uranyl acetate stain for 30 seconds. d. Wick away excess stain and allow the grid to air-dry completely in a covered petri dish.
- Imaging: Insert the grid into the TEM holder. Image at accelerating voltages between 80-200 kV. Collect images at various magnifications to assess size, shape, and aggregation. Use ImageJ software to measure primary particle sizes from micrographs (n>100 particles).
- Optional EDX Analysis: For elemental composition, focus the beam on a particle aggregate and perform an EDX scan.
Visualization of PCC Workflow
PCC as the Foundation for Biocompatibility Testing
The Scientist's Toolkit: Research Reagent Solutions
Table 2: Essential Materials for Nanomaterial PCC
| Item | Function & Rationale |
|---|---|
| Certified Reference Nanoparticles (e.g., NIST-traceable polystyrene or gold nanospheres) | Used for instrument calibration and method validation to ensure measurement accuracy. |
| Ultrapure Water (18.2 MΩ·cm, 0.2 µm filtered) | The standard diluent for baseline measurements to prevent interference from ions or particulates. |
| Phosphate Buffered Saline (PBS) & Cell Culture Media (with/without FBS) | Critical dispersants for measuring properties under physiologically relevant conditions, predicting behavior in in vitro assays. |
| Disposable, Low-Protein-Bind Microcentrifuge Tubes & Pipette Tips | Minimizes nanoparticle loss through adsorption to container walls, ensuring accurate concentration measurements. |
| Syringe Filters (0.1 µm and 0.2 µm pore size, PES membrane) | For sterile filtration of buffers and samples prior to analysis, removing large aggregates and contaminants. |
| Carbon-Coated TEM Grids | Provide a stable, conductive, and amorphous support for high-resolution imaging of nanomaterials. |
| ICP-MS Multi-Element Standard Solution | Used to create calibration curves for precise quantification of elemental impurities in the nanomaterial, as required by ISO 10993-18. |
The ISO 10993 series provides the global framework for the biological evaluation of medical devices. Part 22 (ISO 10993-22) specifically addresses the requirements for nanomaterials, mandating a scientifically rigorous, tiered testing strategy. Nanomedical devices introduce unique challenges due to their high surface area, novel physicochemical properties, and potential for biopersistence. This document outlines a detailed, practical testing strategy that aligns with ISO 10993-22 principles, progressing from high-throughput in vitro screening to targeted, hypothesis-driven in vivo studies to ensure comprehensive risk assessment.
The core principle is to use simpler, high-throughput systems first to inform and limit more complex animal studies. A positive or concerning result in a lower tier triggers progression to a more physiologically relevant tier.
Diagram Title: Tiered Strategy for Nanomaterial Biocompatibility Evaluation
Tier 1: In Vitro Screening Protocols
3.1. High-Throughput Cytotoxicity Screening (ISO 10993-5)
- Objective: Determine baseline cytotoxicity in multiple cell types relevant to exposure (e.g., endothelial cells, macrophages, hepatocytes).
- Protocol (MTT Assay for Nanoparticles):
- Seed cells in 96-well plates (e.g., 10⁴ cells/well) and culture for 24h.
- Prepare a dilution series of the nanomaterial suspension in serum-free medium. Critical: Include dispersant/vehicle control and positive control (e.g., 1% Triton X-100).
- Remove culture medium, add 100 µL of nanomaterial suspension per well. Incubate for 24h and 72h at 37°C.
- Add 10 µL of MTT reagent (5 mg/mL) per well. Incubate for 4h.
- Carefully aspirate medium and add 100 µL of DMSO to dissolve formazan crystals.
- Measure absorbance at 570 nm with a reference at 650 nm.
- Calculate cell viability:
% Viability = (Abs_sample - Abs_blank) / (Abs_vehicle_control - Abs_blank) * 100.
3.2. Genotoxicity Screening: Ames Test & Micronucleus
- Objective: Assess potential for mutagenicity and chromosomal damage.
- Protocol (In Vitro Micronucleus Assay - OECD 487):
- Seed mammalian cells (e.g., V79 or TK6 cells) in chamber slides.
- Expose to nanomaterials for 1.5 normal cell cycle durations (e.g., ~24h for V79). Include negative (vehicle) and positive (e.g., Mitomycin C) controls.
- After exposure, treat cells with cytochalasin-B (3 µg/mL) to block cytokinesis, creating binucleated cells.
- Harvest cells, perform hypotonic treatment, and fix with methanol:acetic acid.
- Stain slides with DNA-specific stain (e.g., DAPI, Acridine Orange).
- Score the frequency of micronuclei in ≥1000 binucleated cells per treatment using fluorescence microscopy.
Table 1: Summary of Tier 1 In Vitro Screening Endpoints
| Endpoint | Standard Method | Key Metrics | Acceptance Criteria (Example) |
|---|---|---|---|
| Cytotoxicity | MTT, XTT, LDH (ISO 10993-5) | IC₅₀, % Viability at max dose | >70% viability at intended exposure x10 |
| Hemolysis | ISO/TR 7406 | % Hemolysis | <5% hemolysis (per ISO 10993-4) |
| Ames Test | OECD 471 | Revertant colony count | Non-mutagenic (no dose-related increase) |
| In Vitro Micronucleus | OECD 487 | Micronuclei per 1000 BN cells | Statistically non-significant increase |
Tier 2: Advanced In Vitro & Mechanistic Studies
4.1. Pro-Inflammatory Signaling Pathway Assessment Nanoparticles can activate the NLRP3 inflammasome, leading to IL-1β release, a key marker of pyroptosis and inflammation.
Diagram Title: Nanoparticle-Induced NLRP3 Inflammasome Activation Pathway
4.2. Protocol: ELISA for IL-1β Release from Macrophages
- Differentiate THP-1 monocytes to macrophages using 100 nM PMA for 48h.
- Prime cells with 100 ng/mL LPS for 3h.
- Expose primed cells to nanomaterials (from Tier 1 IC₂₀ dose) for 6-24h.
- Collect cell culture supernatant, centrifuge to remove particles.
- Perform IL-1β ELISA per manufacturer's instructions (e.g., DuoSet ELISA, R&D Systems).
- Normalize cytokine concentration to total cellular protein (BCA assay).
Tier 3: Targeted In Vivo Studies
5.1. Protocol: Short-Term Repeated Dose Toxicity (OECD 407 adapted)
- Objective: Evaluate systemic toxicity, target organ accumulation, and clearance after repeated exposure.
- Animal Model: Rodent (rat preferred per ISO 10993-11).
- Dosing: 3 dose levels (low=anticipated human dose, mid=5-10x, high=maximum feasible dose) + vehicle control. Route: Relevant to device application (IV, implant site).
- Duration: 14-28 days.
- Endpoints:
- Clinical: Daily observations, weekly body weight, food/water consumption.
- Clinical Pathology: Terminal blood collection for hematology, clinical chemistry.
- Gross Necropsy & Histopathology: Weigh and preserve major organs (liver, spleen, kidneys, lungs, heart, brain). Process for H&E staining.
- Nanomaterial Biodistribution: Quantify elemental or labeled nanomaterial in tissues via ICP-MS or imaging.
Table 2: Key In Vivo Endpoints & Tissue Analysis
| Organ/Tissue | Key Histopathology Focus | Biodistribution Analysis | Clinical Chemistry Correlation |
|---|---|---|---|
| Liver | Kupffer cell hyperplasia, necrosis, inflammation | Primary accumulation site (ICP-MS) | ALT, AST, ALP |
| Spleen | Follicular hyperplasia, pigment deposition | Secondary accumulation site | -- |
| Kidneys | Tubular degeneration, glomerular changes | Critical for clearance | BUN, Creatinine |
| Lungs | Inflammation, granuloma formation | For inhalation/exposure | -- |
| Blood | -- | Plasma concentration over time | CBC, Hemolysis |
The Scientist's Toolkit: Research Reagent Solutions
Table 3: Essential Materials for Nanotoxicology Evaluation
| Item | Function/Benefit | Example Product/Catalog |
|---|---|---|
| Dispersant (e.g., 0.1% BSA in PBS) | Provides stable, reproducible nanoparticle suspensions in biological media, preventing aggregation. | Sigma-Aldrich, A9418 |
| Cell Viability Assay (MTT/XTT) | Colorimetric assays to quantify metabolic activity as a proxy for cytotoxicity. | Thermo Fisher Scientific, M6494 |
| Cytokine ELISA Kit | Quantifies specific inflammatory markers (e.g., IL-1β, TNF-α) from cell supernatants or serum. | R&D Systems, DY201 (Human IL-1β) |
| Reactive Oxygen Species (ROS) Probe | Fluorescent dye (e.g., DCFH-DA) to detect intracellular oxidative stress. | Abcam, ab113851 |
| ICP-MS Standard Solution | For calibration of inductively coupled plasma mass spectrometry to quantify metal-based nanomaterials in tissues. | Inorganic Ventures, custom mix |
| Histology Fixative (Neutral Buffered Formalin) | Preserves tissue architecture for pathological evaluation. | Thermo Fisher Scientific, SF100-4 |
| LAL Endotoxin Assay Kit | Critical to rule out endotoxin contamination as a confounding factor in inflammation studies. | Lonza, QCL-1000 |
| PMA (Phorbol 12-myristate 13-acetate) | Differentiates monocytic cell lines (e.g., THP-1) into macrophage-like cells. | Sigma-Aldrich, P8139 |
Within the framework of ISO 10993-22 ("Biological evaluation of medical devices - Part 22: Guidance on nanomaterials"), the reliable assessment of nanomedical devices hinges on the initial step of sample preparation. The creation of representative and stable dispersions of nanomaterials is a foundational, yet non-trivial, challenge. Inaccurate dispersion can lead to agglomeration or aggregation, resulting in non-representative particle size distribution and surface area data, which directly impacts the validity of subsequent toxicological endpoints such as cytotoxicity, inflammation, and biodistribution. This application note details critical challenges, quantitative insights, and standardized protocols to ensure dispersion quality aligns with the rigorous demands of biocompatibility evaluation.
The primary obstacles in preparing dispersions for nanomaterial testing are agglomeration, instability, and lack of uniformity. The following table summarizes key factors and their quantitative impact based on recent literature.
Table 1: Key Factors Influencing Nanomaterial Dispersion Stability
| Factor | Typical Range/Value | Impact on Stability (Zeta Potential Threshold) | Key Consideration for ISO 10993-22 |
|---|---|---|---|
| Dispersant Medium | Water, PBS, 0.9% NaCl, Cell Culture Media (e.g., DMEM+10%FBS) | Varies significantly; serum proteins can sterically stabilize (±10-20 mV) | Must simulate physiological/clinical use conditions as per clause 6.2. |
| Sonication Energy | 50-500 J/mL (Bath); 100-1000 J/mL (Probe) | Critical for deagglomeration; excess can damage material or alter surface. | Energy must be standardized and reported for inter-laboratory comparison. |
| Sonication Duration | 1-30 min (Probe); 15-60 min (Bath) | Plateau effect; stability can decrease after optimal point. | Clause 7.3 stresses documentation of all preparation parameters. |
| Material Concentration | 10-500 µg/mL (for in vitro assays) | Higher conc. increases collision frequency, promoting aggregation. | Test concentrations must cover expected exposure with a safety margin. |
| Zeta Potential | > +30 mV or < -30 mV (electrostatically stable) | Primary indicator of colloidal stability in simple media. | Measured in relevant dispersants; informs potential particle-particle interactions. |
| Hydrodynamic Diameter (DLS) | Increase > 20% from t=0 to t=24h indicates instability. | Critical metric for monitoring aggregation over test duration. | Directly relates to "physical form of the nanomaterial" under evaluation. |
Detailed Experimental Protocols
Protocol 1: Standardized Dispersion for In Vitro Testing (e.g., Cytotoxicity per ISO 10993-5)
This protocol is designed to prepare a stable, representative stock dispersion of a hydrophobic nanomedical particle (e.g., polymeric nanoparticle) for cell culture assays.
Objective: To create a 1 mg/mL sterile stock dispersion in 0.5% w/v bovine serum albumin (BSA) in phosphate-buffered saline (PBS), suitable for dilution into cell culture media.
Materials (Research Reagent Solutions):
- Nanomaterial: Lyophilized powder of the polymeric nanoparticle.
- Dispersant: 0.5% w/v BSA in PBS, sterile-filtered (0.22 µm).
- Wetting Agent: Ethanol (200 proof, molecular biology grade), 10% v/v in sterile water.
- Equipment: Low-power bath sonicator (e.g., 40-80 W), probe sonicator with 3 mm titanium tip, analytical balance, sterile glass vials.
Procedure:
- Pre-wetting: Weigh 5 mg of nanomaterial into a sterile glass vial. Add 0.5 mL of 10% ethanol wetting agent. Gently vortex for 30 seconds to wet the powder completely.
- Primary Dispersion: Add 4.5 mL of 0.5% BSA/PBS dispersant to achieve a 1 mg/mL concentration. Gently swirl to mix.
- Bath Sonication: Place the sealed vial in a bath sonicator filled with ice water (to mitigate heating). Sonicate for 30 minutes.
- Probe Sonication: Transfer the dispersion to a sterile microtube. Immerse the probe (pre-cleaned with ethanol and water) 1 cm below the liquid surface. Sonicate on ice using the following parameters: 20% amplitude, 30 seconds pulse-on, 15 seconds pulse-off, for a total energy input of 300 J/mL.
- Characterization: Immediately analyze 1 mL of the dispersion for hydrodynamic diameter (by Dynamic Light Scattering, DLS) and zeta potential (by Laser Doppler Velocimetry) in the 0.5% BSA/PBS dispersant. Record the polydispersity index (PdI).
- Stability Assessment: Aliquot the stock dispersion. Store one aliquot at 37°C (test condition). Measure DLS size at t=0, t=2h, t=6h, and t=24h. A stable dispersion will show <20% increase in mean hydrodynamic diameter over 24h.
Protocol 2: Preparation of a Dust for Aerosol Generation (Relevant for Inhalation Exposure Assessment)
This protocol addresses the challenge of creating a respirable aerosol from a powder, as may be required for assessing the effects of airborne nanomaterials per ISO 10993-22, clause 8.
Objective: To mill and condition a nanomaterial powder to achieve a consistent, deagglomerated dust suitable for feeding into an aerosol generator (e.g., Wright Dust Feeder).
Materials (Research Reagent Solutions):
- Nanomaterial: As-received powder.
- Conditioning Agent: Hexane (anhydrous, analytical grade) or other volatile, non-solvent.
- Equipment: Planetary ball mill (with agate jars & balls), sieving apparatus (25 µm mesh), desiccator, humidity-controlled chamber (40-60% RH).
Procedure:
- Pre-milling Conditioning: Place 1 g of the as-received powder in an agate jar. Add 5 mL of hexane. Seal and manually agitate for 2 minutes to break loose agglomerates. Evaporate the hexane completely in a fume hood.
- Milling: Load the conditioned powder into a clean agate jar with agate balls (ball-to-powder mass ratio 10:1). Mill at 200 rpm for 30 minutes. Allow the jar to cool for 15 minutes.
- Sieving: Carefully transfer the milled powder to a 25 µm nominal mesh sieve. Gently tap the sieve for 5 minutes to collect the fine fraction below.
- Environmental Equilibration: Transfer the sieved powder to an open Petri dish. Place in a humidity-controlled chamber at 50% relative humidity and 22°C for 48 hours to equilibrate moisture content.
- Characterization: Analyze the equilibrated dust for primary particle size (TEM), aerodynamic diameter (via time-of-flight spectrometer), and bulk density. The dust is now ready to be loaded into an aerosol generator.
Visualizing the Relationship Between Dispersion Quality and Biological Response
The quality of the initial dispersion directly dictates the nature of the nanomaterial-cell interaction, a core concern in ISO 10993-22 biological evaluation.
Diagram Title: Dispersion Quality Drives Biocompatibility Assessment Outcome
The Scientist's Toolkit: Key Reagents and Materials
Table 2: Essential Research Reagent Solutions for Nanomaterial Dispersion
| Item | Function/Application | Critical Consideration |
|---|---|---|
| Bovine Serum Albumin (BSA) | Model protein for steric stabilization in physiological media. Prevents agglomeration by forming a "protein corona." | Use fraction V, low endotoxin grade. Concentration (0.1-1% w/v) must be optimized per material. |
| Pluronic F-68 or F-127 | Non-ionic block copolymer surfactant. Provides steric hindrance, especially for hydrophobic particles in aqueous media. | Biocompatible and often used in in vitro studies. Can interfere with some colorimetric assays. |
| Phosphate Buffered Saline (PBS) | Isotonic, pH-balanced saline. Common dispersant for simulating physiological fluid. | Lacks proteins; may not prevent aggregation for some materials. Check for nanomaterial solubility. |
| Dimethyl Sulfoxide (DMSO) | Polar aprotic solvent for initial stock dissolution of hydrophobic drugs/particles. | Final concentration in biological assays must be ≤0.1% v/v to avoid cytotoxicity. |
| Cell Culture Media (e.g., DMEM+10%FBS) | Biologically relevant dispersant for direct in vitro exposure. Most accurately models in vivo corona formation. | Complex composition leads to time-dependent aggregation; requires immediate use and characterization. |
| Sonication Energy Calorimeter | Device to measure and calibrate the actual energy delivered by a sonicator to the sample. | Essential for standardizing and reporting the "dose" of sonication energy (J/mL), a key reproducibility parameter. |
Within the framework of ISO 10993-22 for the biological evaluation of medical devices, nanomaterial (NM) incorporation presents unique challenges. Standard test methods (e.g., ISO 10993-5, -10, -11) may not adequately predict risks due to the distinctive physicochemical properties of nano-forms, including high surface area, reactivity, and potential for interference. This document provides adapted application notes and detailed protocols for cytotoxicity, sensitization, and systemic toxicity testing of nano-forms, critical for the safety assessment of nanomedical devices.
Cytotoxicity Assay Adaptations
Challenge: NMs can interfere with common cytotoxicity assays via adsorption of assay components, optical interference, or catalytic activity.
Adapted Direct Contact & Extract Test (ISO 10993-5)
Objective: To evaluate the cytotoxic potential of nano-forms while minimizing assay interference.
Key Adaptations:
- Dispersion Protocol: Use a biologically relevant dispersion medium (e.g., cell culture medium with 50 µg/mL heat-inactivated serum albumin). Pre-disperse NMs using controlled sonication (e.g., bath sonicator, 30-40 W, 10-15 min) prior to dilution.
- Interference Controls: Include NM-only controls (without cells) for all assay readouts to account for background signal.
- Multiple Endpoint Analysis: Combine quantitative assays with qualitative morphological assessment.
Detailed Protocol: Interference-Minimized MTT Assay
Principle: Metabolism of 3-(4,5-dimethylthiazol-2-yl)-2,5-diphenyltetrazolium bromide (MTT) to formazan crystals. NMs can adsorb MTT or formazan, leading to false results.
Materials:
- L929 fibroblasts (ATCC CCL-1) or relevant cell line.
- Test nano-form dispersion (0-200 µg/mL range).
- MTT reagent (0.5 mg/mL in phenol red-free medium).
- NM solubilization solution: 1% Triton X-100 in isopropanol (alternatives: DMSO, SDS-based lysis buffers).
- Centrifugation capable microplate shaker.
Procedure:
- Seed cells in 96-well plates (e.g., 1x10⁴ cells/well) and incubate for 24 h.
- Apply pre-dispersed NM dilutions to cells. Incubate for 24±2 h.
- Critical Step: Carefully remove treatment medium. Gently wash monolayer twice with PBS.
- Add MTT solution (100 µL/well). Incubate 2-4 h.
- Critical Step: Do not remove MTT solution. Add 100 µL of NM solubilization solution directly to each well.
- Seal plate and shake vigorously (≥30 min) to ensure complete dissolution of formazan crystals and potential NM-bound formazan.
- Centrifuge plate (1000 x g, 10 min) to pellet insoluble NMs and cellular debris.
- Transfer 80-100 µL of supernatant to a new 96-well plate.
- Measure absorbance at 570 nm, with 650 nm reference.
Data Interpretation: Compare treated wells to vehicle control. Viability <70% is considered a cytotoxic effect per ISO 10993-5. Data from interference control wells (NMs without cells, steps 4-9) must be subtracted.
Table 1: Common Cytotoxicity Assay Interferences and Mitigation Strategies
| Assay Type | Primary Interference Mechanism | Example Nano-Form | Adapted Mitigation Strategy | Efficacy of Mitigation (% Recovery of True Signal) |
|---|---|---|---|---|
| MTT | Adsorption of MTT/formazan; Catalytic reduction. | Carbon nanotubes (MWCNTs) | Solubilization + centrifugation post-formazan formation. | 85-95% |
| XTT/WST-1/ WST-8 | Direct electron transfer; Adsorption. | Gold nanoparticles (AuNPs) | Use of cell-impermeable electron mediator (e.g., 1-methoxy PMS); Include particle-only controls. | 75-90% |
| Neutral Red Uptake | Adsorption of dye; Lysosome rupture. | Zinc oxide nanoparticles (ZnO NPs) | Extensive washing with formaldehyde/CaCl₂ fixative; Microscopic validation. | 70-85% |
| LDH Release | Adsorption of LDH enzyme or NADH; Surface catalysis. | Silica nanoparticles (SiO₂ NPs) | Use of filtration (100 kDa) or high-speed centrifugation post-incubation prior to spectrophotometric step. | 80-95% |
| ATP Content (Luminescence) | Adsorption of luciferase enzyme/luciferin; Quenching of luminescence. | Quantum Dots (CdSe/ZnS) | Use of mammalian cell lysis buffer with detergent; Dilution of lysate prior to measurement. | 60-80% |
Sensitization Assay Adaptations (ISO 10993-10)
Challenge: NMs may act as haptens, have adjuvant properties, or translocate to lymph nodes differently than soluble chemicals. The standard Guinea Pig Maximization Test (GPMT) or Local Lymph Node Assay (LLNA) may require adaptation.
AdaptedIn VitroSensitization Potency Assessment
Objective: To assess the activation of dendritic cells (DCs) by nano-forms, a key event in the skin sensitization pathway.
Detailed Protocol: Human Cell Line Activation Test (h-CLAT) Adaptation for NMs
Principle: Measures CD86 and CD54 expression on THP-1 cells (human monocytic leukemia cell line) after 24h exposure.
Materials:
- THP-1 cells.
- Test nano-form dispersion in RPMI-1640 + 10% FBS (0-100 µg/mL).
- Positive controls: Nickel sulfate (2.5 mM) for CD54, Cinnamic aldehyde (50 µM) for CD86.
- Flow cytometry antibodies: Anti-human CD86-FITC, CD54-PE, and corresponding isotypes.
Procedure:
- Culture THP-1 cells at 2-8x10⁵ cells/mL. Seed 100 µL/well in 96-well U-bottom plates.
- Add 100 µL of pre-dispersed NM dilutions. Incubate 24 h.
- Viability Assessment: Transfer 100 µL of cell suspension to a new plate, add 10 µL of WST-8 reagent, incubate 1-4 h, measure absorbance at 450 nm. Viability must be >50% for valid sensitization assessment.
- Surface Marker Staining: Centrifuge the original plate (300 x g, 5 min). Wash cells twice with PBS containing 0.1% BSA.
- Resuspend cells in 50 µL of antibody mix (diluted in PBS/0.1% BSA). Incubate 30 min on ice in the dark.
- Wash twice, resuspend in 200 µL PBS, and analyze via flow cytometry.
- Calculate Relative Fluorescence Intensity (RFI) for each marker: RFI = (Mean fluorescence intensity of treated cells) / (Mean fluorescence intensity of vehicle control cells).
Interpretation: An RFI of ≥150% for CD86 and/or ≥200% for CD54, with viability >50%, indicates a positive sensitization response.
Systemic Toxicity Assay Adaptations (ISO 10993-11)
Challenge: NMs can exhibit altered pharmacokinetics (PK), biodistribution, and organ-specific accumulation not predicted by conventional single-dose or repeat-dose studies.
Adapted Single-Dose Acute Systemic Toxicity Protocol
Objective: To evaluate acute toxicity with an emphasis on biodistribution and histopathological analysis of reticuloendothelial system (RES) organs.
Detailed Protocol: Acute Toxicity & Biodistribution in Rodents
Materials:
- Animals: Sprague-Dawley rats (n=5/sex/group).
- Test nano-form: Sterile, endotoxin-free dispersion in vehicle (e.g., saline with 0.1% Tween 80).
- Equipment: ICP-MS (for metal-based NMs), near-infrared (NIR) imaging system (for fluorescent NMs), clinical chemistry analyzer.
Procedure:
- Dosing: Administer a single maximum feasible dose (MFD, e.g., 1000 mg/kg) or a limit dose (e.g., 100 mg/kg for NMs with prior data) via the intended clinical route (e.g., IV, IP). Include vehicle control.
- Clinical Observations: Monitor twice daily for 14 days for mortality, morbidity, clinical signs (pilorection, lethargy, etc.), and body weight changes.
- Termination & Sampling: Euthanize at 24 h and 14 days. Collect blood for hematology and clinical chemistry. Perfuse animals with saline.
- Biodistribution: Harvest organs (liver, spleen, kidneys, lungs, heart, brain). Weigh immediately.
- For quantitative analysis: Digest a portion of each organ (e.g., with nitric acid) for elemental analysis via ICP-MS.
- For qualitative analysis: Image whole organs ex vivo if NMs are fluorescent or NIR-active.
- Histopathology: Fix organs in neutral buffered formalin (note: some NMs may dissolve). Process, embed, section, and stain with H&E. Special stains (e.g., Prussian Blue for iron, silver enhancement for gold) may be required.
Interpretation: Beyond standard mortality/clinical signs, focus on organ weight changes (especially liver/spleen), clinical chemistry markers of organ dysfunction (ALT, AST, BUN, Creatinine), and histopathological evidence of inflammation, necrosis, or particle accumulation in RES organs.
Table 2: Acute Systemic Toxicity and Biodistribution Profiles of Model Nano-Forms (Single IV Dose in Rodents)
| Nano-Form (Size, Coating) | Maximum Tolerated Dose (MTD) | Primary Target Organs (24h Post-Dose) | % of Injected Dose in Liver (24h) | Key Hematological/Biochemical Changes at MTD | Long-Term Fate (28 Days) |
|---|---|---|---|---|---|
| SiO₂ NPs (50 nm, plain) | ~50 mg/kg | Liver, Spleen | 60-80% | Transient increase in liver enzymes (ALT/AST). | Persistent accumulation; Granuloma formation in liver/spleen. |
| AuNPs (15 nm, PEGylated) | >500 mg/kg | Liver, Spleen (reduced) | 30-50% | Minimal changes. | Slow hepatic clearance over months. |
| AgNPs (20 nm, Citrate) | ~10 mg/kg | Liver, Spleen, Kidneys | 40-60% | Dose-dependent hepatotoxicity; Elevated neutrophils. | Partial clearance; Residual silver in RES organs. |
| Liposomes (100 nm, DSPC/Chol) | >100 mg/kg | Liver, Spleen | 70-90% | Transient complement activation-related pseudoallergy (CARPA) at high doses. | Biodegraded/cleared. |
| Gd-based Nanochelates (5 nm) | >1 mmol Gd/kg | Kidneys, Bone | <5% (rapid renal clearance) | None at diagnostic doses. Nephrogenic systemic fibrosis risk at very high doses in renally impaired. | >95% renal excretion within 24h. |
The Scientist's Toolkit: Research Reagent Solutions
Table 3: Essential Materials for Nano-Toxicity Assay Adaptation
| Item/Category | Specific Example(s) | Function in Nano-Form Testing |
|---|---|---|
| Dispersion Media Additives | Bovine Serum Albumin (BSA, 0.1-1%), Pluronic F-68 (0.01-0.1%), Dipalmitoylphosphatidylcholine (DPPC). | Provides a biomimetic corona, stabilizes nano-dispersions in biological fluids, prevents agglomeration. |
| Interference Controls | Particle-only controls, Serum-only controls, Dye adsorption controls. | Critical for distinguishing true biological effects from assay interference artifacts. |
| Alternative Viability Assays | PrestoBlue (resazurin-based), CellTiter-Glo 3D (ATP luminescence with detergent), Calcein AM/EthD-1 (live/dead fluorescence). | Offer reduced susceptibility to NM interference compared to classical assays like MTT. |
| Enhanced Lysis Buffers | Lysis buffers containing 1-2% SDS or Triton X-100, with 0.5M NaCl. | Efficiently desorbs proteins and dyes from NM surfaces prior to quantification. |
| Separation Tools | Microplate-compatible filter plates (100-300 kDa MWCO), High-speed microplate centrifuges. | Physically separates NMs from soluble assay components post-reaction (e.g., for LDH, MTT). |
| Biodistribution Tracers | Radioisotope labels (¹¹¹In, ⁹⁹mTc), Near-infrared (NIR) fluorophores (Cy7, IRDye800), Rare earth element dopants. | Enables quantitative tracking and imaging of NM pharmacokinetics and organ accumulation in vivo. |
| Histopathology Enhancers | Autometallography kits (for Ag, Au), Prussian Blue stain (for Fe), Laser Ablation ICP-MS. | Allows visualization and elemental mapping of NMs in fixed tissue sections. |
Visualizations
Diagram 1: Assay Interference vs. Biological Effect in Nano-Toxicity Testing
Diagram 2: Adapted h-CLAT Workflow for Nano-Form Sensitization Assessment
Diagram 3: Pathways of Systemic Toxicity for Nano-Forms Post-Exposure
This document presents detailed application notes and protocols for the biocompatibility evaluation of a polymeric nanoparticle drug-eluting implant, framed within a broader research thesis on ISO 10993-22: Biological evaluation of medical devices — Part 22: Guidance on nanomaterials. The ISO 10993-22 standard provides specific considerations for evaluating the unique risks posed by nanomaterials, including particle characteristics, toxicokinetics, and specific biological endpoints. This case study integrates standard medical device biocompatibility (ISO 10993 series) with nanotechnology-specific assessments to develop a robust testing strategy for a novel implant containing poly(lactic-co-glycolic acid) (PLGA) nanoparticles loaded with a hydrophobic drug (e.g., Paclitaxel).
Key Physicochemical Characterization & Data
A comprehensive physicochemical characterization is the foundational requirement per ISO 10993-22. The following parameters must be quantified for the bulk material, the nanoparticle formulation, and the final implant.
Table 1: Mandatory Physicochemical Characterization per ISO 10993-22
| Parameter | Technique/Instrument | Target Specification for Case Study Implant | Rationale & ISO 10993-22 Relevance |
|---|---|---|---|
| Particle Size & Distribution | Dynamic Light Scattering (DLS), TEM | PLGA NPs: 80-120 nm (PDI < 0.2) | Influences cellular uptake, biodistribution, and clearance potential. |
| Surface Charge (Zeta Potential) | Electrophoretic Light Scattering | PLGA NPs: -25 to -35 mV | Indicates colloidal stability and predicts interaction with biological membranes. |
| Particle Morphology | Scanning Electron Microscopy (SEM), TEM | Spherical, smooth surface | Impacts protein corona formation and biological response. |
| Nanoparticle Concentration | Nanoparticle Tracking Analysis (NTA) | (1.2 \times 10^{13} \, \text{particles/mL} \pm 10\%) | Dosimetry for in vitro and in vivo studies. |
| Chemical Composition & Purity | FTIR, NMR, HPLC | PLGA 50:50, >99% drug purity | Confirms material identity and detects impurities (leachables). |
| Drug Loading & Encapsulation Efficiency | UV-Vis Spectrophotometry, HPLC | Loading: 15% w/w; Efficiency: >85% | Critical for dose-response assessment and elution kinetics. |
| Surface Chemistry & Functional Groups | X-ray Photoelectron Spectroscopy (XPS) | Presence of terminal carboxyl groups | Determines bio-interfacial properties. |
| Drug Release Kinetics | In vitro elution in PBS (pH 7.4) at 37°C | Burst release <20% at 24h, sustained release over 28 days | Directly relates to implant performance and toxicological exposure. |
| Degradation Profile | GPC, pH change, mass loss | Mass loss ~50% over 60 days | Links to long-term biocompatibility and clearance of degradation products. |
| Specific Surface Area | Brunauer–Emmett–Teller (BET) Analysis | 40-60 m²/g for nanoparticle powder | Increased surface area can enhance reactivity and toxicity. |
Table 2: Summary of Representative Quantitative Characterization Data
| Sample ID | Avg. Size (nm) | PDI | Zeta Potential (mV) | [Particles]/mL | Drug Loading (%) | 28-Day Cumulative Release (%) |
|---|---|---|---|---|---|---|
| PLGA NP (Blank) | 95.3 ± 2.1 | 0.12 | -30.5 ± 1.8 | (1.25 \times 10^{13}) | 0 | 0 |
| PLGA NP (Drug-Loaded) | 112.7 ± 3.4 | 0.18 | -28.2 ± 2.3 | (1.18 \times 10^{13}) | 14.8 ± 0.7 | 78.5 ± 4.2 |
| Final Implant Eluent (Day 1) | N/A | N/A | N/A | (2.1 \times 10^{10})* | N/A | 15.2 ± 1.8 |
*Estimated particle number released per implant per day.
Experimental Protocols
Protocol 3.1: Preparation of Extractables/Leachables forIn VitroTesting (ISO 10993-12)
Objective: To prepare test samples representing substances released from the implant under aggressive conditions. Materials: Sterile implant segments (0.2 g/mL surface area to volume ratio), complete cell culture media (RPMI-1640 + 10% FBS) or 0.9% saline, incubator shaker (37°C, 60 rpm). Procedure:
- Aseptically weigh and place the implant segment into a sterile container.
- Add the appropriate extraction vehicle (culture media for cytotoxicity, saline for systemic tests) at a ratio of 0.2 g implant per 1 mL vehicle.
- Incubate at 37°C ± 1°C with continuous agitation at 60 rpm for 72 hours ± 2 hours.
- After incubation, centrifuge the extract at 2000 x g for 10 minutes to pellet any particulate matter.
- Carefully collect the supernatant (the extract) and use immediately for testing or store at -80°C for a maximum of 30 days.
- Prepare a negative control (vehicle only) and a positive control (e.g., 0.5% Zinc Dibutyldithiocarbamate in media for cytotoxicity) concurrently.
Protocol 3.2:In VitroCytotoxicity Assessment (MTT Assay per ISO 10993-5)
Objective: To evaluate the cytotoxic potential of implant extracts and released nanoparticles. Materials: L929 mouse fibroblast cells (ATCC CCL-1), complete DMEM, MTT reagent (3-(4,5-dimethylthiazol-2-yl)-2,5-diphenyltetrazolium bromide), DMSO, 96-well tissue culture plates, microplate reader. Procedure:
- Seed L929 cells in a 96-well plate at (1 \times 10^4) cells/well and incubate for 24 hours (37°C, 5% CO₂) to form a 70-80% confluent monolayer.
- Aspirate the medium and replace with 100 µL of (a) neat implant extract, (b) serial dilutions of extract (e.g., 1:2, 1:4), (c) negative control medium, and (d) positive control.
- Incubate the cells with test samples for 24 hours.
- Carefully aspirate the treatment medium and add 100 µL of fresh medium containing 0.5 mg/mL MTT.
- Incubate for 3 hours. Gently aspirate the MTT solution.
- Add 100 µL of DMSO to each well to solubilize the formed formazan crystals. Shake the plate gently for 10 minutes.
- Measure the absorbance at 570 nm (reference 690 nm) using a microplate reader.
- Calculate cell viability: % Viability = (Mean Absorbance of Test Sample / Mean Absorbance of Negative Control) × 100. A reduction in viability by >30% is considered a cytotoxic effect per ISO 10993-5.
Protocol 3.3: Assessment of Reactive Oxygen Species (ROS) Generation
Objective: To measure nanoparticle-induced oxidative stress, a key mechanism of nanomaterial toxicity. Materials: H₂DCFDA (2',7'-Dichlorodihydrofluorescein diacetate) dye, relevant cell line (e.g., THP-1 derived macrophages), black-walled 96-well plates, fluorescence microplate reader. Procedure:
- Differentiate THP-1 cells into macrophages using 100 nM PMA for 48 hours.
- Load cells with 10 µM H₂DCFDA in serum-free medium for 45 minutes at 37°C.
- Wash cells twice with PBS to remove excess dye.
- Treat cells with nanoparticle suspensions (e.g., equivalent to 10-100 µg/mL) or implant extract in fresh medium. Include a negative control (medium) and a positive control (200 µM tert-Butyl hydroperoxide, t-BOOH).
- Incubate for a predetermined time (1-6 hours).
- Measure fluorescence intensity (Excitation: 485 nm, Emission: 535 nm) immediately.
- Express results as fold change in fluorescence intensity relative to the negative control.
Protocol 3.4: Hemolysis Assay (ISO/TR 7406)
Objective: To evaluate the potential of released nanoparticles to damage red blood cells (erythrocytes). Materials: Fresh human whole blood (heparinized), 0.9% saline, 1% Triton X-100 (positive control), test nanoparticle suspension in saline, centrifuge, spectrophotometer. Procedure:
- Dilute whole blood 1:10 in 0.9% saline.
- In a microcentrifuge tube, mix 0.5 mL of diluted blood with 0.5 mL of:
- Test Sample: Nanoparticle suspension in saline at final target concentrations.
- Negative Control: 0.9% saline.
- Positive Control: 1% Triton X-100 in saline.
- Incubate all tubes at 37°C for 3 hours with gentle mixing every 30 minutes.
- Centrifuge at 800 x g for 10 minutes.
- Carefully transfer 100 µL of supernatant from each tube to a 96-well plate.
- Measure the absorbance of the supernatant at 540 nm.
- Calculate % Hemolysis: % Hemolysis = [(Abssample - Absnegative) / (Abspositive - Absnegative)] × 100. A value >5% indicates a hemolytic potential.
Visualizations
Title: Tiered Testing Strategy for Nanomaterial Implant
Title: Key Nanotoxicity Signaling Pathways
Title: Cytotoxicity Testing Workflow (MTT Assay)
The Scientist's Toolkit: Key Research Reagent Solutions
Table 3: Essential Materials for Testing Nanomaterial Implants
| Item / Reagent | Function / Purpose in Testing | Example Supplier/Cat. No. (Representative) |
|---|---|---|
| Poly(D,L-lactide-co-glycolide) (PLGA) 50:50 | Polymer for nanoparticle synthesis; biodegradable standard. | Sigma-Aldrich (719900) |
| Dichloromethane (DCM) / Ethyl Acetate | Solvent for oil phase in single/double emulsion NP synthesis. | Various chemical suppliers |
| Polyvinyl Alcohol (PVA), MW 30-70 kDa | Surfactant/stabilizer for forming nanoparticles. | Sigma-Aldrich (341584) |
| Dulbecco's Modified Eagle Medium (DMEM) | Cell culture medium for in vitro cytotoxicity testing. | Thermo Fisher (11995065) |
| MTT Cell Proliferation Assay Kit | Ready-to-use kit for quantitative cytotoxicity assessment. | Abcam (ab211091) |
| H₂DCFDA (DCFH-DA) | Cell-permeant fluorescent probe for detecting intracellular ROS. | Thermo Fisher (D399) |
| THP-1 Human Monocytic Cell Line | Model for immune response, can be differentiated into macrophages. | ATCC (TIB-202) |
| L929 Mouse Fibroblast Cell Line | Recommended cell line for cytotoxicity testing per ISO 10993-5. | ATCC (CCL-1) |
| LAL Chromogenic Endotoxin Kit | Quantifies bacterial endotoxin levels on device/extracts (pyrogenicity). | Lonza (50-647U) |
| Comet Assay Kit (Single Cell Gel Electrophoresis) | For assessing nanoparticle-induced genotoxicity (DNA damage). | Trevigen (4250-050-K) |
| Cytokine ELISA Kits (IL-1β, IL-6, TNF-α) | Quantify pro-inflammatory cytokine release from immune cells. | R&D Systems |
| Inductively Coupled Plasma Mass Spectrometry (ICP-MS) Standards | For quantifying trace metal catalysts/impurities from synthesis. | Inorganic Ventures |
Overcoming Common Hurdles: Solutions for Nanomaterial Biocompatibility Testing Challenges
The evaluation of nanomedical devices per ISO 10993-22 requires rigorous assessment of cytotoxicity and endotoxin contamination. Standard assays like MTT (for cell viability) and the Limulus Amebocyte Lysate (LAL) test are cornerstone methods. However, nanomaterials (NMs) inherently possess physicochemical properties—high adsorption capacity, optical characteristics, catalytic activity, and size effects—that can interfere with these assays, leading to false positives or negatives. This compromises the validity of biocompatibility data, posing a significant risk in the drug development pipeline. This document provides application notes and protocols for detecting and mitigating such interference, ensuring regulatory-compliant evaluation.
Mechanisms and Detection of Interference
MTT Assay Interference
The MTT assay measures mitochondrial reductase activity converting yellow tetrazolium to purple formazan. NMs can interfere via:
- Adsorption: Of MTT or formazan crystals onto NM surfaces.
- Catalytic Reduction/Oxidation: Direct chemical reduction of MTT or oxidation of formazan by NM surfaces (e.g., catalytic metals like Au, Ag, CeO₂).
- Light Interference: Scattering or absorption at 570 nm by NMs in suspension.
Detection Protocol: Interference Check for MTT Assay Objective: To distinguish true cytotoxicity from assay interference. Materials: Test NMs, cell culture (e.g., L929 fibroblasts), complete medium, MTT reagent, DMSO, 96-well plate, microplate reader. Procedure:
- Cell-Free Control: Seed a 96-well plate with medium only (no cells). Add NMs at the same concentration range used in cytotoxicity testing. Incubate under standard culture conditions (37°C, 5% CO₂) for the test duration (e.g., 24h).
- MTT Addition & Incubation: Add MTT reagent directly to cell-free, NM-containing wells. Incubate for the standard period (typically 3-4h).
- Solubilization & Measurement: Add DMSO (or other solvent) to dissolve any formed formazan. Measure absorbance at 570 nm with a reference filter (e.g., 690 nm).
- Interpretation: A significant absorbance signal in the absence of cells indicates direct NM-mediated MTT reduction (chemical interference). Compare values to a negative control (medium + MTT, no NMs).
LAL Assay Interference
The LAL test detects endotoxins via an enzymatic cascade. NMs can cause:
- Inhibition: Adsorption of endotoxins or cascade enzymes, blocking the reaction.
- Activation: Direct activation of Factor C or G (e.g., by (1,3)-β-D-glucans on some NMs), leading to false positives.
Detection Protocol: Spike-and-Recovery Test for LAL Assay Objective: To validate that NMs do not inhibit or enhance the LAL reaction. Materials: Test NMs, LAL reagent water (LRW), control standard endotoxin (CSE), kinetic chromogenic LAL kit, pyrogen-free tubes, microplate reader/spectrophotometer. Procedure:
- Sample Preparation: Prepare NM suspensions in LRW at the maximum concentration to be tested. Split into three aliquots:
- Unspiked: NM suspension.
- Spiked: NM suspension + a known concentration of CSE (e.g., 0.5 EU/mL).
- Control Spike: LRW + the same known concentration of CSE (no NMs).
- Assay Execution: Perform the kinetic chromogenic LAL assay per manufacturer instructions on all samples. Record the reaction time (onset time) or measured endotoxin concentration.
- Calculation: % Recovery = ( [Endotoxin] in Spiked Sample – [Endotoxin] in Unspiked Sample ) / [Endotoxin] in Control Spike ) x 100.
- Interpretation: Recovery between 50-200% is generally considered acceptable (per FDA guidance). <50% indicates inhibition; >200% indicates enhancement/activation.
Table 1: Summary of Interference Mechanisms and Detection Methods
| Assay | Primary Interference Mechanisms | Key Detection Method | Acceptance Criterion |
|---|---|---|---|
| MTT (Cytotoxicity) | Adsorption of reagents/products, Catalytic activity, Optical interference. | Cell-Free MTT Reduction Test. | Absorbance signal should be <10% of positive cytotoxic control signal. |
| LAL (Endotoxin) | Inhibition (adsorption), Enhancement (direct activation of cascade). | Spike-and-Recovery Test. | Endotoxin recovery 50-200%. |
Mitigation Strategies and Validated Protocols
Mitigation for MTT Assay Interference
Strategy 1: Assay Substitution or Modification.
- Protocol: Resazurin (Alamar Blue) Assay. Resazurin is reduced to fluorescent resorufin. Less prone to chemical reduction by NMs.
- Seed cells and treat with NMs as per standard protocol.
- At endpoint, add sterile-filtered resazurin sodium salt (to 10% v/v final concentration in medium).
- Incubate 1-4h, protected from light.
- Measure fluorescence (Ex 560/Em 590). Include cell-free NM controls.
- Protocol: Formazan Washing & Solubilization.
- After MTT incubation, carefully aspirate the medium containing NMs and unreacted MTT.
- Wash the cell monolayer twice with PBS to remove residual NMs.
- Add DMSO to solubilize formazan crystals in situ. Measure absorbance.
Strategy 2: Physical Separation.
- Protocol: NRU (Neutral Red Uptake) Assay. Neutral red dye is taken up by lysosomes of viable cells. Allows for washing steps.
- After NM exposure, incubate with Neutral Red medium (40 µg/mL) for 3h.
- Aspirate dye, perform a rapid wash with a fixative (1% CaCl₂, 0.5% formaldehyde).
- Add destain solution (50% ethanol, 49% H₂O, 1% acetic acid) to extract dye.
- Measure absorbance at 540 nm.
Mitigation for LAL Assay Interference
Strategy 1: Sample Pretreatment.
- Protocol: Dilution to Minimal Valid Dilution (MVD).
- Perform inhibition/enhancement testing at various dilutions.
- Identify the MVD where interference is eliminated (recovery 50-200%).
- Report final endotoxin concentration as (Result) x (Dilution Factor).
- Protocol: pH Adjustment and Cation Supplementation.
- Adjust NM suspension to pH 6-8 using pyrogen-free NaOH/HCl.
- Supplement with divalent cations (e.g., Mg²⁺) to stabilize the LAL enzyme cascade.
- Re-test spike recovery.
Strategy 2: Alternative Endotoxin Test.
- Protocol: Recombinant Factor C (rFC) Assay. Uses a single recombinant enzyme, less susceptible to NM inhibition and free of (1,3)-β-D-glucan interference.
- Reconstitute rFC reagent as per manufacturer’s instructions.
- Mix NM samples/controls with rFC reagent in a microplate.
- Measure fluorescence kinetically (Ex 380/Em 440).
- Calculate endotoxin concentration from a standard curve.
Table 2: Summary of Mitigation Strategies
| Interfering Assay | Mitigation Strategy | Recommended Protocol | Key Advantage |
|---|---|---|---|
| MTT | Alternative Viability Assay | Resazurin Reduction Assay | Less susceptible to chemical reduction; fluorometric. |
| MTT | Physical Separation | Neutral Red Uptake Assay | Allows removal of NMs before measurement. |
| LAL | Sample Pretreatment | Dilution to MVD | Simple, often effective for inhibition. |
| LAL | Alternative Assay | Recombinant Factor C (rFC) Assay | Avoids glucan pathway; more specific. |
The Scientist's Toolkit: Research Reagent Solutions
| Item (Supplier Examples) | Function in Interference Studies |
|---|---|
| Resazurin Sodium Salt (e.g., Sigma R7017) | Fluorometric viability dye; less prone to NM chemical interference than MTT. |
| Neutral Red Dye (e.g., Sigma N2889) | Viability dye for lysosomal uptake; enables washing steps to remove NMs. |
| Kinetic Chromogenic LAL Kit (e.g., Lonza QCL-1000) | Gold-standard for endotoxin detection; allows precise spike-and-recovery tests. |
| Recombinant Factor C Assay Kit (e.g., Lonza PyroGene) | Specific endotoxin detection without β-glucan interference; ideal for polysaccharide NMs. |
| Control Standard Endotoxin (CSE) (e.g., USP) | Known endotoxin source for spiking experiments to quantify recovery. |
| LAL Reagent Water (LRW) (e.g., Lonza W50-640) | Pyrogen-free water for sample/reagent preparation to prevent contamination. |
| Pyrogen-Free Tubes/Tips (e.g., Associates of Cape Cod) | Essential labware to prevent exogenous endotoxin introduction during testing. |
Visualized Workflows and Pathways
Title: MTT Assay Interference Decision Workflow
Title: LAL vs rFC Assay Pathways & Interference Points
Title: LAL Spike-and-Recovery Validation Protocol
Application Notes
This document details protocols for characterizing nanomaterials used in nanomedical devices, in alignment with ISO 10993-22's emphasis on physicochemical characterization for biocompatibility evaluation. A primary thesis is that traditional mass-based dosing is insufficient for assessing biological interactions and potential toxicity. Surface area and particle number are more predictive dose metrics for nanoparticle (NP) instability, biodistribution, and inflammatory responses.
1. Quantitative Data Summary
Table 1: Comparative Biological Response of 50 nm Gold Nanoparticles (AuNPs) by Different Dose Metrics
| Dose Metric | Administered Dose | Observed IL-6 Secretion (in vitro) | Hepatic Accumulation (%ID) in vivo |
|---|---|---|---|
| Mass Concentration | 100 µg/mL | Low (~2x control) | 45% |
| Surface Area | 2000 µm²/mL | High (~10x control) | 45% |
| Particle Number | 2.4 x 10¹¹ particles/mL | High (~10x control) | 45% |
Note: %ID = Percent of Injected Dose. Data illustrates that surface area and number, not mass, correlate with inflammatory response.
Table 2: Key Instability Metrics and Measurement Techniques
| Instability Phenomenon | Critical Metric | Primary Analytical Technique | Typical Acceptable Range (for IV administration) | |
|---|---|---|---|---|
| Aggregation/Agglomeration | Hydrodynamic Size (Dh) & PDI | Dynamic Light Scattering (DLS) | Dh shift < 10% in serum; PDI < 0.2 | |
| Protein Corona Formation | Hard Corona Thickness / Composition | SDS-PAGE, LC-MS/MS, DLS | Consistent composition profile across batches | |
| Dissolution / Ion Release | Ion Concentration (e.g., Ag⁺, Zn²⁺) | Inductively Coupled Plasma Mass Spectrometry (ICP-MS) | < 0.1 µg/mL/hr in relevant biological fluid | |
| Surface Charge Change | Zeta Potential (ζ) | Electrophoretic Light Scattering | -10 to -30 mV in physiological buffer |
2. Experimental Protocols
Protocol 2.1: Determination of Particle Number Concentration Objective: To calculate the particle number concentration (particles/mL) from mass-based measurements. Materials: See Scientist's Toolkit. Procedure:
- Determine the mass concentration (Cₘ) of the NP suspension via gravimetric analysis or ICP-MS.
- Characterize the mean primary particle diameter (d) using Transmission Electron Microscopy (TEM). Analyze at least 200 particles for a representative size distribution.
- Calculate the mean particle volume: V = (4/3) * π * (d/2)³.
- Obtain the material density (ρ) from reliable literature or material safety data sheets.
- Calculate the mass per particle: m_particle = V * ρ.
- Calculate the particle number concentration: N = Cₘ / mparticle. Calculation Example: For 50 nm (0.05 µm) AuNPs (ρ ≈ 19.3 g/cm³) at 100 µg/mL: V = (4/3) * π * (25 nm)³ ≈ 6.54 x 10⁴ nm³ = 6.54 x 10⁻²⁰ cm³. mparticle = 6.54 x 10⁻²⁰ cm³ * 19.3 g/cm³ = 1.26 x 10⁻¹⁸ g. N = (100 x 10⁻⁶ g/mL) / (1.26 x 10⁻¹⁸ g) ≈ 7.94 x 10¹³ particles/mL.
Protocol 2.2: Assessment of Colloidal Stability in Biological Media Objective: To monitor NP hydrodynamic size and zeta potential shifts in serum-containing media. Materials: NP suspension, complete cell culture medium (e.g., DMEM + 10% FBS), DLS/Zetasizer instrument, incubation shaker. Procedure:
- Prepare a 1 mg/mL stock NP dispersion in sterile deionized water.
- Dilute the NP stock 1:10 into pre-warmed (37°C) complete cell culture medium to achieve a final concentration of 100 µg/mL. Vortex immediately.
- Incubate the mixture at 37°C with gentle shaking (50 rpm).
- At time points T=0, 0.5, 2, 6, and 24 hours, withdraw 1 mL aliquots.
- Measure the hydrodynamic diameter (Dh) and polydispersity index (PDI) via DLS at 37°C. Perform each measurement in triplicate.
- In parallel, measure the zeta potential (ζ) of the NPs diluted in 1x PBS (pH 7.4) using electrophoretic light scattering.
- Plot Dh and PDI over time. A significant increase (>10% from T=0) indicates instability and aggregation/agglomeration.
Protocol 2.3: Quantification of Surface Area Dose Objective: To calculate the total surface area dose administered. Materials: Data from Protocol 2.1 (particle number N, diameter d). Procedure:
- Using the primary particle diameter (d) from TEM, calculate the mean surface area per particle: A_particle = 4 * π * (d/2)².
- Obtain the total particle number in the administered dose (Ntotal). For *in vitro*: Ntotal = N (from 2.1) * well volume. For in vivo: N_total = N * injection volume.
- Calculate the total administered surface area: SAtotal = Aparticle * N_total. Reporting: Report dose in units of cm²/mL (in vitro) or cm²/animal (in vivo) alongside mass concentration.
3. Diagrams
Title: How Dose Metrics Drive Instability and Biological Response
Title: Workflow for Advanced NP Dose Characterization
4. The Scientist's Toolkit
Table 3: Essential Research Reagents & Materials
| Item | Function & Relevance to Dose Metrics |
|---|---|
| Dynamic Light Scattering (DLS) / Zetasizer | Measures hydrodynamic diameter (Dh) and size distribution (PDI) to monitor aggregation, a key instability factor affecting particle number and active surface area. |
| Transmission Electron Microscope (TEM) | Provides primary particle size and morphology. Essential for accurate calculation of individual particle volume, surface area, and derived particle number concentration. |
| Inductively Coupled Plasma Mass Spectrometer (ICP-MS) | Quantifies elemental mass concentration with ultra-high sensitivity. Crucial for determining mass dose and measuring ion dissolution rates. |
| Synthetic Biological Fluids (e.g., Simulated Body Fluid) | Standardized media for stability testing under physiologically relevant ionic strength and pH, per ISO 10993-22 guidance. |
| Albumin & Fetal Bovine Serum (FBS) | Source of proteins for protein corona formation studies. The corona alters the effective biological surface area and particle stability. |
| NIST Traceable Size Standards | Essential for calibrating size measurement instruments (DLS, TEM) to ensure accuracy of core metrics. |
| Static Light Scattering (SLS) / MALS | Coupled with DLS, determines absolute particle radius and molecular weight, aiding in aggregation state analysis. |
The ISO 10993 series provides a framework for the biological evaluation of medical devices. Part 22 (ISO 10993-22) specifically addresses the requirements for nanomaterials, focusing on chemical characterization, degradation, and bio-distribution. A central tenet of this standard is the need for rigorous physicochemical characterization to inform and correlate with biological findings. For nanomedical devices (e.g., drug-loaded polymeric nanoparticles, inorganic theranostic agents), reliable data on size, morphology, and elemental composition are non-negotiable. This application note details optimized protocols for Dynamic Light Scattering (DLS), Transmission Electron Microscopy (TEM), and Inductively Coupled Plasma Mass Spectrometry (ICP-MS) to generate ISO 10993-22-compliant data, ensuring traceability and robustness in biocompatibility assessments.
Optimized Techniques: Protocols & Data Interpretation
Dynamic Light Scattering (DLS): Hydrodynamic Size & Stability
Purpose: To determine the hydrodynamic diameter (Z-average), polydispersity index (PDI), and colloidal stability of nanoparticles in biologically relevant media.
Key Protocol (Sample Preparation & Measurement):
- Dilution: Dilute the nanoparticle suspension in the desired medium (e.g., deionized water, phosphate-buffered saline (PBS), cell culture medium with 10% serum). The optimal concentration yields a count rate between 200-500 kcps for most instruments.
- Filtration: Filter the dispersion medium through a 0.1 or 0.2 µm syringe filter prior to dilution to eliminate dust.
- Equilibration: Allow the sample cell (typically a disposable polystyrene cuvette) to equilibrate in the instrument at 25.0 ± 0.1°C for 180 seconds.
- Measurement: Perform a minimum of 12 consecutive measurements of 10 seconds each. Repeat for at least three independent sample preparations (n=3).
- Quality Check: The baseline of the correlation function must be stable. The intercept for a monodisperse sample should be >0.8. Reports must include Z-average, PDI, and intensity size distribution plot.
Data Presentation (Table 1): DLS Performance in Different Media
| Nanomaterial | Medium | Z-Avg. Diameter (nm) | PDI | Key Interpretation for ISO 10993-22 |
|---|---|---|---|---|
| PEG-PLA Nanoparticles | Deionized Water | 105.2 ± 2.1 | 0.08 ± 0.02 | Baseline monodisperse size. |
| PEG-PLA Nanoparticles | PBS (pH 7.4) | 108.5 ± 3.5 | 0.09 ± 0.03 | Minor change indicates good buffer stability. |
| PEG-PLA Nanoparticles | DMEM + 10% FBS | 115.8 ± 5.7 | 0.15 ± 0.05 | Increase suggests protein corona formation; critical for in vitro test planning. |
| Gold Nanorods (Citrate) | Deionized Water | 52.3 x 18.1 (L x W) | 0.21 ± 0.04 | High PDI expected for anisotropic shapes. |
| Gold Nanorods (Citrate) | PBS | Aggregation Observed | N/A | Instability indicates need for surface modification prior to biological testing. |
Transmission Electron Microscopy (TEM): Primary Size & Morphology
Purpose: To visualize and measure the primary particle size, shape, crystallinity, and state of aggregation at the nanoscale.
Key Protocol (Negative Staining for Soft Nanoparticles):
- Grid Preparation: Apply a 5-10 µl droplet of nanoparticle suspension (≈0.01 mg/ml) onto a glow-discharged carbon-coated copper TEM grid.
- Incubation: Allow adsorption for 60 seconds.
- Blotting: Wick away excess liquid carefully with filter paper.
- Staining: Immediately apply a 5-10 µl droplet of 1-2% aqueous uranyl acetate solution for 30 seconds.
- Blot & Dry: Blot away stain and allow the grid to air-dry completely in a covered petri dish.
- Imaging: Acquire images at various magnifications (e.g., 20,000x, 50,000x, 100,000x). Measure at least 200 particles from multiple images using ImageJ software for statistical relevance.
Workflow Diagram:
Diagram Title: TEM Sample Prep Workflow for Soft Nanoparticles
Inductively Coupled Plasma Mass Spectrometry (ICP-MS): Elemental Quantification
Purpose: To achieve ultra-trace quantification of elemental composition (e.g., Au, Ag, Si, Pt) for dose determination, biodistribution, and degradation studies as per ISO 10993-22.
Key Protocol (Acid Digestion of Tissue for Biodistribution):
- Tissue Weighing: Precisely weigh 50-100 mg of wet tissue (e.g., liver, spleen) into a clean Teflon digestion vessel.
- Acid Addition: Add 3 mL of concentrated, high-purity nitric acid (HNO₃) and 1 mL of hydrogen peroxide (H₂O₂).
- Microwave Digestion: Run a stepped digestion program (e.g., ramp to 180°C over 15 min, hold for 20 min). Allow vessels to cool.
- Dilution: Quantitatively transfer the digestate to a 50 mL volumetric flask and dilute to volume with 2% HNO₃.
- ICP-MS Analysis: Use a collision/reaction cell (e.g., He/KED mode) to eliminate polyatomic interferences. Employ external calibration with matrix-matched standards and an internal standard (e.g., ¹¹⁵In, ¹⁹³Ir) for signal drift correction.
- Calculation: Calculate µg element/g tissue weight, applying all dilution and recovery factors.
Data Presentation (Table 2): ICP-MS Detection Limits & Spike Recovery
| Target Element | Isotope | Expected Conc. in Device (µg/g) | Method LOD (µg/L) | Tissue Spike Recovery (%) | Relevance to ISO 10993-22 |
|---|---|---|---|---|---|
| Gold (Au) | ¹⁹⁷Au | 5000 | 0.005 | 98.5 ± 2.1 | Quantification of Au nanorod content in device. |
| Silicon (Si) | ²⁸Si | 10000 | 0.5 | 102.3 ± 5.0* | Measuring silica nanoparticle degradation in vitro. |
| Platinum (Pt) | ¹⁹⁵Pt | 200 | 0.001 | 99.8 ± 1.5 | Tracking chemotherapeutic nanocarrier biodistribution. |
| Internal Std. | ¹¹⁵In | 50 (added) | N/A | N/A | Corrects for matrix suppression. |
Note: Si recovery can be variable; matrix-matching is critical.
The Scientist's Toolkit: Essential Research Reagents & Materials
| Item Name | Function/Application | Critical Specification for Reliable Data |
|---|---|---|
| NIST Traceable Size Standards (e.g., 100 nm polystyrene latex) | Calibration and validation of DLS and TEM size measurements. | Certified mean diameter & low polydispersity. Essential for ISO compliance. |
| High-Purity HNO₃ & H₂O₂ (TraceSELECT or similar) | Sample digestion for ICP-MS. | Ultralow metal background (<1 ppt for critical elements). |
| Single-Element ICP-MS Standards | Preparation of calibration curves and spike solutions. | 1000 µg/mL in 2-5% HNO₃, NIST-traceable. |
| Carbon-Coated TEM Grids (e.g., 400 mesh Cu) | Support film for nanoparticle imaging. | Consistent thickness, low background noise. Glow discharge enhances sample adhesion. |
| Zeta Potential Transfer Standard (e.g., -50 mV ± 5 mV) | Validation of electrophoretic mobility measurements. | Ensures instrument performance for surface charge analysis (complement to DLS). |
| Serum (e.g., FBS) | Biologically relevant dispersion medium for DLS. | Lot-to-lot consistency is crucial for protein corona studies. |
Integrated Data Correlation: A Logical Pathway
The power of these techniques lies in their correlation. DLS indicates stability in media, TEM confirms the primary particle size (distinguishing single particles from aggregates seen by DLS), and ICP-MS provides the absolute mass dose for biological experiments. This triad fulfills the core material characterization requirements of ISO 10993-22.
Logical Relationship Diagram:
Diagram Title: Technique Correlation for ISO 10993-22 Compliance
Within the framework of ISO 10993-22:2017, "Biological evaluation of medical devices — Part 22: Guidance on nanomaterials," the justification for waiving standard biocompatibility tests requires a rigorous, science-based rationale. Nanomaterials in medical devices (nanomedical devices) exhibit unique physicochemical properties that can render traditional toxicological endpoints and in vitro assays inappropriate, irrelevant, or uninformative. This document provides application notes and protocols to support researchers in constructing a scientifically valid waiver justification dossier.
Foundational Principles for Waiver Justification
Justification for omitting a standard test must be based on one or more of the following pillars, supported by empirical data:
- Material Composition & Historical Use: The nanomaterial is chemically identical to a well-characterized, clinically established material with a substantial history of safe use, and the novel nano-form does not introduce new biological interactions.
- Physicochemical Justification: Data demonstrates that the specific property (e.g., surface area, aspect ratio, surface charge) driving the biological response of concern is not present or is biologically inaccessible in the final device configuration.
- Toxicokinetic Justification: ADME (Absorption, Distribution, Metabolism, Excretion) studies prove that the nanomaterial is not systemically available from the device to reach the target organ of a particular test (e.g., justifying a neurotoxicity waiver if the material cannot cross the blood-brain barrier).
- Redundancy of Information: The endpoint is already adequately addressed by existing data from other tests within the biological evaluation plan, or from the scientific literature on the specific material.
Data Collection & Analysis Protocols for Waiver Support
Protocol: Physicochemical Characterization for Hazard Identification
Objective: To comprehensively characterize the nanomaterial to identify potential hazards and justify the irrelevance of certain biological endpoints.
Materials & Workflow:
- Sample Preparation: Prepare samples in triplicate from at least three independent production batches of the final, sterilized device material.
- Characterization Suite:
- Primary Particle Size & Morphology: Use TEM (Transmission Electron Microscopy). Deposit suspension on carbon-coated grid, dry, and image ≥100 particles for statistical distribution.
- Hydrodynamic Size & Zeta Potential in Physiological Fluid: Use DLS (Dynamic Light Scattering) and ELS (Electrophoretic Light Scattering). Disperse material in ISO 10993-18 simulated body fluid (e.g., PBS with 1% serum protein) at 0.1 mg/mL. Measure in triplicate at 37°C.
- Specific Surface Area (SSA): Use BET (Brunauer-Emmett-Teller) nitrogen adsorption. Degas sample at 120°C for 6 hours prior to analysis.
- Crystallinity: Use XRD (X-ray Diffraction). Compare peaks to reference standards (e.g., JCPDS database).
- Surface Chemistry: Use XPS (X-ray Photoelectron Spectroscopy). Analyze survey and high-resolution spectra for elemental and chemical state identification.
Table 1: Example Characterization Data for a Hypothetical TiO₂ Nanocoating
| Parameter | Method | Result (Mean ± SD) | Relevance to Waiver Justification |
|---|---|---|---|
| Primary Size (TEM) | ISO 21363:2020 | 32 nm ± 8 nm | Baseline property. |
| Hydrodynamic Diameter | DLS (in PBS+BSA) | 45 nm ± 12 nm (PDI: 0.18) | Indicates stability & minimal aggregation in biological fluid. |
| Zeta Potential | ELS (in PBS) | -12.5 mV ± 2.1 mV | Indicates low protein fouling potential. |
| Specific Surface Area | BET | 48 m²/g ± 3 m²/g | Input for dose normalization if needed. |
| Crystallographic Phase | XRD | >98% Rutile | Rutile is less reactive than anatase; supports reduced ROS generation claim. |
Protocol: In Vitro Dissolution/Bioreactivity in Simulated Physiological Fluid
Objective: To demonstrate that the nanomaterial is inert or dissolves at a rate that precludes long-term persistence concerns, supporting waivers for chronic tests.
Methodology:
- Fluid Selection: Use a simulated interstitial fluid (per ISO 23317) or relevant fluid per device contact (e.g., simulated lung fluid for inhalables).
- Incubation: Incubate a known mass (Ws) of nanomaterial in 50 mL of fluid at 37°C under gentle agitation (e.g., 60 rpm) for timepoints: 1, 7, 28, and 90 days. Include a positive control (e.g., high-solubility nano-calcium phosphate).
- Analysis: At each timepoint, centrifuge to separate particulates. Analyze supernatant via ICP-MS (Inductively Coupled Plasma Mass Spectrometry) for relevant ion concentration (Ci). Filter residue (0.1 nm), dry, and weigh (Wr).
- Calculation: Determine percent dissolution = [(Ws - Wr) / Ws] * 100. Confirm with ion release data.
Table 2: Example Dissolution Data for a Bioresorbable Nano-Hydroxyapatite
| Time Point | Mass Remaining (%) | Ca²⁺ Ion Release (ppm) | P⁵⁺ Ion Release (ppm) | Justification Implication |
|---|---|---|---|---|
| 1 day | 98.5% ± 0.5% | 15.2 ± 1.1 | 8.9 ± 0.7 | Supports waiver for acute systemic toxicity. |
| 28 days | 85.2% ± 3.1% | 102.5 ± 8.7 | 60.3 ± 5.2 | Predictable, non-particulate release; supports chronic test waiver with monitoring. |
| 90 days | 40.1% ± 5.6% | 255.0 ± 20.1 | 151.4 ± 12.8 | Data itself can replace long-term implantation test if release profile is safe. |
Experimental Workflow for a Comprehensive Waiver Dossier
Diagram 1: Workflow for Nanomaterial Testing Waiver Justification
Key Signaling Pathways for Nanomaterial-Biological Interactions
Understanding these pathways is critical to arguing why a standard test measuring a downstream effect may be irrelevant.
Diagram 2: Common Nanomaterial-Induced Cellular Stress Pathways
The Scientist's Toolkit: Research Reagent Solutions
Table 3: Essential Materials for Nanomaterial Biocompatibility Assessment
| Item | Function in Waiver Justification Studies | Example/Note |
|---|---|---|
| ISO 10993-18 Simulated Body Fluids | Provides physiologically relevant medium for dissolution, release, and in vitro testing. | PBS with 0.1% BSA, simulated interstitial fluid (SIF), artificial lysosomal fluid (ALF). |
| Stable Reference Nanomaterials | Essential positive/negative controls for characterization and assay validation. | NIST Gold Nanoparticles (RM 8011), JRC TiO₂ NM-105, carboxylated polystyrene beads. |
| Reactive Oxygen Species (ROS) Probe Kits | Quantify oxidative stress potential, a key nanotoxicity mechanism. | DCFH-DA (cellular), Electron Spin Resonance (ESR) for direct particle measurement. |
| ICP-MS Calibration Standards | Precisely quantify ionic dissolution and trace element release from nanomaterials. | Multi-element standards for relevant ions (e.g., Al, Si, Ti, Ag, Zn). |
| Protein Corona Analysis Kits | Assess protein adsorption, which dictates biological identity and fate. | SDS-PAGE kits, LC-MS/MS solutions for corona profiling. |
| Validated In Vitro Macrophage Models | Assess inflammatory potential (key for justification of pyrogenicity/sensitization waivers). | THP-1 cell line (differentiated), primary human monocyte-derived macrophages. |
| High-Resolution Imaging Substrates | For visualizing nanomaterial-cell interactions. | TEM grids (carbon/formvar), confocal microscopy dishes with coverglass bottom. |
| Size Exclusion Chromatography (SEC) Columns | Separate and collect protein-corona coated nanoparticles from free protein. | Sepharose or silica-based columns with appropriate pore sizes. |
Ensuring Data Credibility: Validating Methods and Benchmarking Against Conventional Materials
1.0 Introduction & Thesis Context Within the framework of a thesis on ISO 10993-22:2017 ("Biological evaluation of medical devices — Part 22: Guidance on nanomaterials") evaluation, establishing robust analytical methods is foundational. ISO 10993-22 mandates rigorous physicochemical characterization of nanomaterials in medical devices to inform biological risk assessment. This application note details the critical validation parameters—Precision, Accuracy, and Limits of Detection (LOD)—for assays quantifying nanoparticle (NP) concentration, size, and endotoxin content, which are pivotal for reliable biocompatibility testing.
2.0 Validation Parameters: Definitions & Quantitative Benchmarks
Table 1: Key Validation Parameters and Acceptance Criteria for Nano-Tests
| Parameter | Definition | Typical Acceptance Criterion (Nanomaterial Context) | Example Measurement Technique |
|---|---|---|---|
| Precision (Repeatability) | Closeness of agreement between independent results under identical conditions. | Relative Standard Deviation (RSD) ≤ 15% for concentration; ≤ 10% for size (monodisperse samples). | Dynamic Light Scattering (DLS), UV-Vis Spectroscopy. |
| Precision (Intermediate Precision) | Variation within a laboratory (different days, analysts, equipment). | RSD ≤ 20% for concentration; ≤ 15% for size. | HPLC-ICP-MS, Nanoparticle Tracking Analysis (NTA). |
| Accuracy/Trueness | Closeness of agreement between test result and accepted reference value. | Recovery of 80-120% from spiked samples or certified reference materials (CRMs). | ICP-MS for elemental concentration, SRM 8013 (Gold NPs). |
| Limit of Detection (LOD) | Lowest concentration that can be detected, but not necessarily quantified. | Signal-to-Noise Ratio (S/N) ≥ 3 or 3.3σ/slope of calibration curve. | Fluorescence spectroscopy, Chromatographic methods. |
| Limit of Quantification (LOQ) | Lowest concentration that can be quantified with acceptable precision and accuracy. | S/N ≥ 10 or 10σ/slope of calibration curve; RSD ≤ 20% at LOQ. | ELISA, Single Particle ICP-MS (spICP-MS). |
3.0 Detailed Experimental Protocols
Protocol 3.1: Precision (Repeatability) for Nanoparticle Size by DLS Objective: Determine the intra-assay variability of hydrodynamic diameter measurement. Materials: Nanoparticle suspension, disposable cuvettes, calibrated DLS instrument. Procedure:
- Equilibrate the nanoparticle sample to 25°C for 15 minutes.
- Perform a minimum of 10 consecutive size measurements of the same sample aliquot without repositioning the cuvette.
- Record the Z-average diameter and polydispersity index (PdI) for each run.
- Calculate the mean, standard deviation (SD), and Relative Standard Deviation (RSD%) for the Z-average.
- Acceptance: RSD% of Z-average should be ≤ 10% for monodisperse samples (PdI < 0.2).
Protocol 3.2: Accuracy Assessment via Spiked Recovery for NP Concentration (ICP-MS) Objective: Validate the trueness of an acid digestion-ICP-MS method for quantifying metallic NP concentration in a simulated biological matrix. Materials: Test nanoparticle suspension, certified elemental standard, nitric acid (trace metal grade), simulated body fluid (SBF), ICP-MS. Procedure:
- Prepare three sets of samples in SBF: (A) Blank (SBF only), (B) Unspiked sample (known low NP concentration), (C) Spiked sample (add a known mass of NP standard to the concentration of B).
- Digest all samples with concentrated HNO₃ using a microwave digestion system.
- Dilute digests appropriately and analyze by ICP-MS against a matrix-matched calibration curve.
- Calculate % Recovery:
[ (Measured Concentration of C – Measured Concentration of B) / Known Spike Concentration ] x 100%. - Acceptance: Mean recovery should be within 80-120%.
Protocol 3.3: Determining LOD/LOQ for Fluorescent-Labeled NP Assay Objective: Establish the lowest detectable and quantifiable concentration of fluorescently labeled NPs. Materials: Serial dilutions of fluorescent NP standard, microplate reader, black 96-well plates. Procedure:
- Prepare at least 6 serially diluted standard solutions covering the expected low concentration range, plus 10 blank replicates (buffer only).
- Measure the fluorescence intensity (FI) of all wells.
- Plot a calibration curve of FI vs. concentration for standards.
- Calculate the SD of the blank replicates.
- LOD Calculation:
LOD = (3.3 * SD_blank) / Slope of calibration curve. - LOQ Calculation:
LOQ = (10 * SD_blank) / Slope of calibration curve. - Verify LOQ by analyzing 6 samples at the LOQ concentration; RSD should be ≤ 20%.
4.0 Visualizations
Title: Workflow for Nano-Test Method Validation per ISO 10993-22
Title: NP-Induced Inflammatory Pathway & Endotoxin Confounding
5.0 The Scientist's Toolkit: Research Reagent Solutions
Table 2: Essential Materials for Nano-Test Method Validation
| Item | Function in Validation | Example/Note |
|---|---|---|
| Certified Reference Materials (CRMs) | Provide a traceable standard for accuracy assessment of size, concentration, and composition. | NIST RM 8012-8014 (Gold NPs), JRC Nanomaterials. |
| Endotoxin-Free Labware & Reagents | Critical for in vitro biocompatibility tests to prevent false-positive inflammatory responses. | Certified endotoxin-free tubes, tips, and water (≤0.005 EU/mL). |
| Matrix-Matched Calibration Standards | Compensates for sample matrix effects, improving accuracy in complex biological fluids. | Standards prepared in simulated body fluid or relevant cell culture media. |
| Stable Fluorescent/Dye Labels | Enable highly sensitive detection for LOD/LOQ determination in uptake or distribution studies. | Cy5.5, Alexa Fluor 647, or near-infrared dyes for minimal interference. |
| Protease & Nuclease Inhibitors | Preserve protein corona or nucleic acid-based NPs during sample processing for accurate characterization. | Added to collection buffers during in vitro or ex vivo sample harvest. |
| Ultrapure Water & Acids | Minimize background contamination in elemental analysis (e.g., ICP-MS) and sample preparation. | 18.2 MΩ·cm water; trace metal grade nitric acid. |
Within the framework of ISO 10993-22, "Biological evaluation of medical devices — Part 22: Guidance on nanomaterials," the standardization of biocompatibility assessments for nanomedical devices is paramount. This document provides application notes and detailed protocols for employing reference nanomaterials as positive and negative controls to ensure assay validity, reproducibility, and inter-laboratory comparison. These controls are critical for distinguishing inherent nanomaterial toxicity from background noise or experimental artifacts.
The Critical Role of Controls in Nanotoxicology
Positive Controls: Materials with well-characterized and predictable biological responses (e.g., cytotoxicity, inflammation). They verify that an assay system is responsive and performing correctly. Negative Controls: Materials expected to elicit minimal biological response. They establish the baseline and confirm the absence of contamination or non-specific effects. Reference Nanomaterials: Standardized materials (e.g., from the European Commission's Joint Research Centre or the National Institute of Standards and Technology) used as benchmarks to calibrate methods and compare data across studies.
Key Research Reagent Solutions
| Item | Function in Nanomaterial Assessment |
|---|---|
| TiO2 (NM-105, JRC) | A reference nanoparticle often used as a positive control for particle-induced inflammation (e.g., in cytokine release assays). |
| SiO2 (NM-200, JRC) | Used as a reference for dust-like nanomaterials; can serve as a positive control for oxidative stress or genotoxicity. |
| ZnO (NM-110, JRC) | A soluble nanomaterial acting as a positive control for dissolution-based cytotoxicity and ion release. |
| Citrate-capped Au NPs (NIST 8011-8013) | Spherical, inert gold nanoparticles frequently used as negative controls for cytotoxicity and inflammation studies. |
| Dispersant/Vehicle Control | The medium (e.g., PBS with 0.1% BSA) used to suspend nanomaterials. Essential negative control for solvent effects. |
| Carbon Black (NIST SRM 1650) | A benchmark for carbonaceous nanoparticle toxicity, used as a positive control for reactive oxygen species (ROS) generation. |
| Lipopolysaccharide (LPS) | A molecular positive control for pro-inflammatory cytokine assays (e.g., IL-1β, TNF-α release from macrophages). |
| Cytochalasin B | Used in the in vitro micronucleus assay to block cytokinesis, enabling accurate scoring of chromosome damage. |
Table 1: Expected Response Ranges for Common Reference Nanomaterials in Standard Assays (ISO 10993-22 Context)
| Reference Material (Example Source) | Assay Endpoint | Typical Positive Control Response (Range) | Typical Negative Control Response | Key Purpose |
|---|---|---|---|---|
| ZnO NPs (NM-110, JRC) | Cytotoxicity (MTT assay in THP-1 cells) | IC50: 10-20 µg/mL | >80% cell viability at 50 µg/mL | Control for dissolution-driven toxicity. |
| TiO2 (NM-105, JRC) | ROS Generation (DCFH-DA in A549 cells) | 2.5-4.0 fold increase vs. vehicle at 100 µg/mL | ~1.0 fold change | Control for particle-induced oxidative stress. |
| Citrate-capped 30nm Au (NIST 8011) | Hemolysis (ISO 10993-4) | <2% hemolysis at 200 µg/mL | <2% hemolysis | Negative control for blood interaction. |
| Carbon Black (NIST 1650) | IL-8 Release (BEAS-2B cells) | 3-5 fold increase vs. vehicle at 50 µg/mL | ~1.0 fold change | Positive control for pro-inflammatory response. |
| Amine-Polystyrene NPs | Complement Activation (CH50 assay) | >70% depletion of complement at 1 mg/mL | <20% depletion | Positive control for immune system activation. |
Detailed Experimental Protocols
Protocol 1: Standardized Cytotoxicity Assessment with Controls (MTT Assay)
Objective: To evaluate the cytotoxic potential of a test nanomedical device extract or particle suspension using ISO 10993-5 principles, validated with reference controls.
Materials:
- L929 or THP-1 cell line
- Complete cell culture medium
- Test nanomaterial suspension, Reference Positive Control (e.g., ZnO NM-110), Reference Negative Control (e.g., Au NIST 8011), Vehicle Control
- MTT reagent (3-(4,5-dimethylthiazol-2-yl)-2,5-diphenyltetrazolium bromide)
- DMSO (Dimethyl sulfoxide)
- 96-well tissue culture plates, CO2 incubator, microplate reader
Procedure:
- Cell Seeding: Seed cells in a 96-well plate at 1x10^4 cells/well in 100 µL medium. Incubate for 24h (37°C, 5% CO2) to allow adherence.
- Exposure Preparation: Serially dilute test material and controls in culture medium. Include a vehicle-only control (0% toxicity) and a medium-only control (background).
- Treatment: Aspirate medium from cells. Add 100 µL of each dilution to quadrupicate wells.
- Incubation: Incubate plate for 24h.
- MTT Development: Add 10 µL of MTT solution (5 mg/mL in PBS) to each well. Incubate for 4h.
- Solubilization: Carefully aspirate medium/MTT. Add 100 µL DMSO to each well to dissolve formazan crystals.
- Measurement: Shake plate gently for 10 min. Measure absorbance at 570 nm (reference 650 nm) using a microplate reader.
- Data Analysis: Calculate cell viability:
% Viability = (Abs_sample - Abs_blank) / (Abs_vehicle_control - Abs_blank) * 100. The assay is valid only if the positive control (ZnO) shows a dose-response with IC50 within the expected range AND the negative control (Au) shows viability >80% at the highest tested concentration.
Protocol 2: Macrophage Pro-Inflammatory Response Assessment (Cytokine ELISA)
Objective: To assess the potential of nanomaterials to induce inflammation via cytokine release, using LPS and reference nanomaterials as controls.
Materials:
- THP-1 cells differentiated with PMA (phorbol 12-myristate 13-acetate) into macrophages
- LPS (from E. coli), Reference TiO2 (NM-105), Test nanomaterial
- Human TNF-α or IL-1β ELISA kit
- Centrifuge, microplate washer, microplate reader
Procedure:
- Cell Differentiation: Seed THP-1 cells in 24-well plates at 2x10^5 cells/well in medium containing 100 nM PMA. Differentiate for 48h.
- Resting: Replace medium with fresh PMA-free medium and rest cells for 24h.
- Stimulation: Treat cells in triplicate with: a) Vehicle control, b) LPS (100 ng/mL, positive control), c) Reference TiO2 (100 µg/mL), d) Test nanomaterial at relevant concentrations.
- Incubation: Incubate for 6h (TNF-α) or 24h (IL-1β).
- Sample Collection: Centrifuge supernatant at 500 x g for 5 min to remove particles/cells. Collect clear supernatant.
- ELISA: Perform assay per kit instructions.
- Validation Criterion: The assay is valid if LPS induces a statistically significant (p<0.01) increase in cytokine level (typically >10-fold over vehicle) AND the vehicle control reads at or near the kit's lower detection limit.
Visualization of Workflows and Pathways
Diagram 1: Control-Based Assay Validation Workflow (100 chars)
Diagram 2: Control Material Signaling Pathways (99 chars)
Introduction Within the framework of ISO 10993-22 biocompatibility evaluation for nanomedical devices, a fundamental challenge is the distinct biological behavior of nanomaterials compared to their bulk counterparts from the same substance. This application note provides protocols for the comparative risk assessment of nano and bulk material profiles, essential for accurate safety evaluation in drug and device development.
Key Data Comparison Summary
Table 1: Comparative Physicochemical and Biological Properties of Nano vs. Bulk TiO₂
| Property | Bulk TiO₂ (Micron-scale) | Nano TiO₂ (~30 nm) | Key Implication for ISO 10993-22 |
|---|---|---|---|
| Primary Particle Size | >1000 nm | 20-100 nm | Nanoscale is intrinsic property for evaluation. |
| Agglomeration State | Low (stable powder) | High in biological media | Alters delivered dose and cellular interaction. |
| Surface Area (BET) | Low (<10 m²/g) | High (50-200 m²/g) | Increased reactive surface drives toxicity. |
| Reactivity & ROS Generation | Low | Significantly Elevated | Primary mechanism for oxidative stress. |
| Cellular Uptake | Minimal (phagocytosis) | High (multiple pathways) | Potential for intracellular organelle disruption. |
| Inflammatory Response | Low-grade, transient | Potent, persistent | Impacts chronic inflammation endpoints. |
| Biodistribution | Local to exposure site | Systemic translocation possible | Expands hazard identification scope. |
Table 2: In Vitro Cytotoxicity (ISO 10993-5) of Silver (Ag) Forms
| Material Form | Avg. IC₅₀ (MTS Assay in Macrophages) | LDH Release at 100 µg/mL | Notable Mechanism |
|---|---|---|---|
| Bulk Ag Powder | >200 µg/mL | <10% (control level) | Mechanistic irritation. |
| Ag Nanoparticles (50 nm) | 25 µg/mL | 45% | Ion dissolution, ROS, mitochondrial damage. |
| Ag+ Ions (AgNO₃ control) | 5 µg/mL (Ag-equivalent) | 60% | Highlights ionic contribution. |
Experimental Protocols
Protocol 1: Dispersion and Characterization of Test Materials (per ISO/TR 10993-22) Objective: To generate stable, characterized dispersions of nano and bulk materials for biological testing.
- Dispersion Preparation: Weigh material. Prepare a 2.5 mg/mL stock in relevant dispersion medium (e.g., 0.05% BSA in PBS, or cell culture medium without serum). Sonicate using a probe sonicator (e.g., 40% amplitude, 2 min pulse-on, 1 min pulse-off, on ice) to minimize agglomeration.
- Hydrodynamic Size & Zeta Potential: Dilute sonicated stock 1:100 in sterile, low-ionic-strength water or PBS. Measure immediately using Dynamic Light Scattering (DLS) for hydrodynamic diameter (Z-avg) and polydispersity index (PDI). Measure zeta potential using electrophoretic light scattering. Report mean of ≥3 measurements.
- Dosimetry Consideration: Calculate the delivered effective surface area dose using BET surface area and particle concentration, in addition to mass/volume concentration.
Protocol 2: Comparative Assessment of Reactive Oxygen Species (ROS) Generation Objective: To quantify and compare intrinsic oxidative potential of nano vs. bulk forms.
- Reagent: Prepare 10 mM DCFH-DA stock in DMSO. Dilute in serum-free medium to 10 µM working solution.
- Cell-free Assay: In a 96-well plate, add 100 µL of material dispersion (serial dilutions from 500 µg/mL) to 100 µL of 10 µM DCFH-DA. Include H₂O₂ (100 µM) as positive control and dispersion medium as blank. Protect from light.
- Incubation: Shake plate briefly, incubate at 37°C for 1-4 hours.
- Measurement: Read fluorescence (Ex/Em: 485/535 nm) at 30-min intervals. Express data as fluorescence intensity normalized to blank control over time. Compare EC₅₀ for nano vs. bulk.
Protocol 3: High-Content Screening for Cell Health Parameters Objective: Multiparametric in vitro screening aligned with ISO 10993-1 biological evaluation endpoints.
- Cell Seeding: Seed relevant cell line (e.g., L929 fibroblasts, THP-1 macrophages) in 96-well imaging plates. Incubate until ~70% confluency.
- Exposure: Treat cells with material dispersions (nano, bulk, vehicle control) across a logarithmic concentration series (e.g., 1, 10, 100 µg/mL) for 24 hours.
- Staining: Use a live-cell multiplex kit (e.g., CellEvent Caspase-3/7 for apoptosis, MitoTracker for mitochondrial membrane potential, HCS NuclearMask for viability). Follow manufacturer's protocol.
- Imaging & Analysis: Image plates using an automated high-content microscope (≥9 fields/well). Use analysis software to quantify: % viable cells, apoptosis index, mitochondrial intensity, and nuclear morphology. Generate benchmark dose (BMD) curves for each parameter.
Visualizations
Title: Differential Toxicity Pathways: Nano vs Bulk
Title: Comparative Risk Assessment Workflow
The Scientist's Toolkit: Research Reagent Solutions
| Item / Reagent | Function in Nano vs. Bulk Assessment |
|---|---|
| Bovine Serum Albumin (BSA), Low Endotoxin | Provides a consistent protein corona for stabilizing nano-dispersions in biological media, enabling reproducible dosing. |
| DCFH-DA / CellROX Reagents | Cell-permeable fluorescent probes for detecting and quantifying intracellular reactive oxygen species (ROS) generation. |
| High-Content Screening (HCS) Multiplex Kits | Allow simultaneous, automated quantification of multiple cell health endpoints (viability, apoptosis, MMP) from a single well. |
| CRISPR-modified Cell Lines | Isogenic cell lines with knockouts in specific pathways (e.g., Nrf2, NLRP3) to mechanistically link nanomaterial properties to biological outcomes. |
| Standard Reference Nanomaterials (e.g., from NIST) | Certified materials (e.g., Au nanoparticles, TiO₂) essential for assay calibration, instrument qualification, and inter-laboratory comparison. |
| Inductively Coupled Plasma Mass Spectrometry (ICP-MS) | Provides ultra-sensitive, quantitative detection of elemental dissolution (ionic release) and cellular uptake of metallic nanomaterials. |
| Asymmetric Flow Field-Flow Fractionation (AF4) | Separates and purifies nanoparticles by size in suspension, crucial for isolating monodisperse fractions from polydisperse samples before testing. |
This application note details methodologies for correlating physicochemical characterization (PCC) data of nanomaterials with in vitro and in vivo biological responses to build predictive safety models. This work is situated within the framework of ISO 10993-22, "Biological evaluation of medical devices — Part 22: Guidance on nanomaterials," which mandates rigorous material characterization as the cornerstone of risk assessment for nanomedical devices. The standard emphasizes that PCC data is not an endpoint but a critical starting point for understanding and predicting biological interactions. The ultimate goal is to establish Quantitative Structure-Activity Relationships (QSARs) or other in silico models that can reduce reliance on extensive animal testing, aligning with the 3Rs principles (Replacement, Reduction, Refinement) and accelerating the development of safe nanomedical products.
Foundational PCC Parameters & Their Biological Correlates
Effective predictive modeling requires mapping specific, measurable PCC parameters to potential biological endpoints. The following table summarizes the key parameters and their hypothesized or demonstrated links to biological responses.
Table 1: Core PCC Parameters and Their Biological Correlates
| PCC Parameter | Typical Measurement Technique | Relevant Biological Response(s) | Proposed Mechanism / Pathway Involvement |
|---|---|---|---|
| Size & Size Distribution | DLS, NTA, TEM, SEM | Cellular uptake, biodistribution, clearance, inflammation (e.g., IL-1β, NLRP3 inflammasome activation) | Endocytic pathway efficiency, complement activation, RES recognition. |
| Surface Charge (Zeta Potential) | Electrophoretic Light Scattering | Protein corona composition, membrane interaction, cytotoxicity, hemocompatibility | Electrostatic interaction with cell membranes (apoptosis/necrosis), opsonin dysopsonin adsorption. |
| Surface Chemistry / Functionalization | XPS, FTIR, Raman Spectroscopy | Targeting efficiency, stealth properties, immune recognition (e.g., cytokine release) | Ligand-receptor binding (e.g., EGFR, folate receptor), PEGylation-mediated reduced phagocytosis. |
| Surface Area | BET Analysis | Pro-inflammatory response, catalytic reactivity, dissolution rate | Increased reactive site density, radical generation (oxidative stress). |
| Shape / Aspect Ratio | TEM, SEM, AFM | Cellular internalization mechanism, phagocytosis, inflammation (frustrated phagocytosis) | Membrane wrapping energy, lysosomal disruption. |
| Degradation / Dissolution Rate | ICP-MS, Spectrophotometry (simulated body fluids) | Long-term toxicity, ion release, organ-specific accumulation (e.g., liver, spleen) | Trojan horse mechanism, ionic overload, disruption of metal homeostasis. |
| Elemental & Purity Analysis | ICP-MS, EDS | Genotoxicity, oxidative stress, impurity-driven toxicity | Catalyst residue (e.g., Pd, Ni) causing DNA damage, ROS generation via Fenton-like reactions. |
Detailed Experimental Protocols
Protocol: High-Throughput PCC Profiling for Model Input
Objective: To generate a standardized dataset of PCC parameters for a library of nanomaterials (variants in size, coating, charge) for correlation with biological assays. Materials:
- Nanomaterial library suspensions (e.g., 1 mg/mL in sterile, particle-free water or PBS).
- DLS/Zeta Potential analyzer.
- NTA system.
- TEM grid preparation supplies (glow discharger, uranyl acetate stain).
- BET surface area analyzer.
- ICP-MS calibration standards.
Procedure:
- Size & Charge (DLS/Zeta): Dilute samples to appropriate concentration (e.g., 20-50 μg/mL in 1 mM KCl). Measure hydrodynamic diameter (Z-average), PDI, and zeta potential (mV) in triplicate at 25°C. Report mean ± SD.
- Concentration & Size (NTA): Dilute further to meet instrument's ideal particle count (∼10⁸ particles/mL). Record 60-second videos in triplicate. Report particle concentration (particles/mL) and mode size.
- Morphology (TEM): Apply 5 μL of sample to glow-discharged carbon-coated grid. Incubate 1 min, wick away, rinse with water, and negatively stain with 1% uranyl acetate for 30 sec. Air dry and image at 80-120 kV. Measure dimensions of >100 particles using ImageJ.
- Surface Area (BET): Degas ∼50 mg of lyophilized powder at 100°C under vacuum for 12 hours. Perform N₂ adsorption-desorption isotherm analysis. Calculate specific surface area via the BET method.
- Elemental/Dissolution (ICP-MS): For dissolution, incubate material (100 μg/mL) in simulated lysosomal fluid (pH 4.5) at 37°C for 24h. Centrifuge (100,000 x g, 45 min). Filter supernatant (10 kDa MWCO). Digest filtrate in 2% HNO₃ and analyze via ICP-MS against matrix-matched standards.
Protocol:In VitroHemocompatibility & Innate Immune Response Assay
Objective: To measure key biological responses (hemolysis, cytokine secretion) for correlation with PCC data, particularly surface charge and chemistry. Materials:
- Fresh human whole blood (heparinized).
- RPMI-1640 medium.
- Human PBMCs isolated via Ficoll-Paque density gradient.
- LPS (1 μg/mL) as positive control.
- ELISA kits for IL-1β, IL-6, TNF-α.
- Spectrophotometer/plate reader.
Procedure: Part A: Hemolysis Assay (ASTM E2524-08 modified)
- Dilute nanomaterials in PBS to a range of concentrations (e.g., 10, 50, 100 μg/mL).
- Add 100 μL of diluted sample to 900 μL of 2% (v/v) red blood cell (RBC) suspension in PBS. Include PBS (0% lysis) and 1% Triton X-100 (100% lysis) controls.
- Incubate at 37°C for 3h with gentle agitation.
- Centrifuge at 800 x g for 10 min. Measure absorbance of supernatant at 540 nm.
- Calculate % Hemolysis = [(Sample Abs - PBS Abs) / (Triton Abs - PBS Abs)] * 100. Threshold: <5% hemolysis is considered non-hemolytic.
Part B: Cytokine Release from PBMCs
- Seed PBMCs in 96-well plates at 1x10⁶ cells/mL in RPMI + 10% FBS.
- Treat with nanomaterials at sub-cytotoxic concentrations (determined via MTT assay) for 24h.
- Collect supernatants by centrifugation. Store at -80°C.
- Perform ELISA per manufacturer's instructions. Quantify cytokine levels (pg/mL) against standard curves.
Data Integration & Predictive Modeling Workflow
Predictive Safety Model Workflow
The Scientist's Toolkit: Key Research Reagent Solutions
Table 2: Essential Materials for PCC-Biological Correlation Studies
| Item / Reagent | Function / Rationale |
|---|---|
| Standard Reference Nanomaterials (e.g., from NIST, JRC) | Critical for inter-laboratory calibration and validation of both PCC instruments and biological assays (e.g., Au nanoparticles, SiO₂). |
| Simulated Biological Fluids (PBS, SBF, SLF) | To assess material stability, dissolution, and protein corona formation under physiologically relevant conditions. |
| Fetal Bovine Serum (Charcoal-stripped or defined) | Provides a consistent protein source for in vitro studies to model protein corona formation. Charcoal-stripped reduces hormone/variable factors. |
| Cell Lines: THP-1 (monocytic) & RAW 264.7 (macrophage) | Standardized models for innate immune response (cytokine release, ROS, phagocytosis). THP-1 can be differentiated to macrophage-like cells with PMA. |
| Reactive Oxygen Species (ROS) Detection Kits (DCFH-DA, CellROX) | Quantify oxidative stress, a primary nanotoxicity mechanism, linking to PCC parameters like catalytic surface area. |
| Latex Beads (Fluorescent, various sizes) | Positive controls for phagocytosis assays and size-dependent uptake studies. |
| LysoTracker & pH-Sensitive Dyes (e.g., pHrodo) | To probe lysosomal integrity and phagolysosomal acidification, often disrupted by high-aspect-ratio or persistent materials. |
| High-Throughput Screening Plates (96-well, 384-well) | Enable dose-response studies and generate sufficient data points for robust statistical modeling. |
| Protein Corona Isolation Kits (e.g., magnetic pull-down) | To isolate the hard corona for subsequent proteomic analysis (LC-MS/MS), linking surface chemistry to adsorbed protein identity. |
Key Signaling Pathways Linking PCC to Pro-Inflammatory Responses
PCC-Triggered Inflammasome Activation
The systematic generation of PCC data, coupled with targeted biological assays as described, creates a robust dataset for computational modeling. Predictive models built from such data can inform the ISO 10993-22 biological evaluation strategy by: 1) Identifying high-risk material properties a priori, 2) Guiding the selection of necessary in vivo tests, and 3) Ultimately supporting a "safety by design" paradigm for nanomedical devices. This data-driven approach moves compliance from a checklist exercise to a scientifically grounded predictive science.
Within the framework of a thesis on ISO 10993-22 (Biological evaluation of medical devices — Part 22: Guidance on nanomaterials) for nanomedical devices, generating robust data is only the first step. Effective documentation and presentation of validated, nano-specific datasets are critical for successful regulatory submissions. This document provides application notes and detailed protocols for key experiments, focusing on the structured presentation of data required to address the unique physicochemical (PC) and biological interaction profiles of nanomaterials (NMs). The goal is to bridge the gap between comprehensive research and clear, defensible regulatory dossiers.
A complete submission must link NM PC properties to biological outcomes. Below are structured summaries of essential datasets.
Table 1: Tier 1 - Critical Physicochemical Characterization Dataset
| Parameter | Key Measurement Technique | Relevance to ISO 10993-22 | Target Acceptance Criteria (Example) |
|---|---|---|---|
| Size & Distribution | Dynamic Light Scattering (DLS), TEM | Dose calculation, biodistribution, cellular uptake. | PDI < 0.2 in relevant biological media. |
| Surface Charge | Zeta Potential (ζ) | Stability, protein corona formation, membrane interaction. | Report in serum-containing media; monitor agglomeration. |
| Surface Chemistry | X-ray Photoelectron Spectroscopy (XPS) | Understanding engineered surface modifications & batch consistency. | Atomic % of key surface elements within ±5% between batches. |
| Elemental Composition | Inductively Coupled Plasma Mass Spectrometry (ICP-MS) | Quantification of core material & potential impurities (e.g., catalytic residues). | >95% purity for core element; report all impurities >0.1%. |
| Degradation/Dissolution | Simulated biological fluids (e.g., lysosomal pH) with ICP-MS | Understanding biopersistence and ion release kinetics. | <5% dissolution over 72h in pH 7.4; >50% in pH 4.5 for biodegradable NM. |
Table 2: Tier 2 - Nano-Specific Biological Endpoint Dataset (In Vitro)
| Biological Endpoint | Validated Protocol (ISO/ASTM) | NM-Specific Adaptation | Key Quantitative Output |
|---|---|---|---|
| Cytotoxicity (Direct Contact) | ISO 10993-5 | Use extract and direct contact with well-dispersed NM. Test at multiple timepoints (24, 48, 72h). | Cell viability (% Control), IC50 value (µg/mL). |
| Reactive Oxygen Species (ROS) Generation | ASTM E2526 | Measure both acute (1-6h) and chronic (24h) ROS. Include relevant positive controls (e.g., CuO NPs). | Fold-increase in fluorescence vs. untreated control. |
| Endothelial Barrier Integrity | In vitro Transwell assay (TEER) | Expose endothelial monolayers to sub-cytotoxic NM doses. Monitor over 24h. | Transepithelial Electrical Resistance (% baseline). |
| Hemocompatibility | ISO 10993-4 | Test for hemolysis, platelet activation, and coagulation times. Critical for intravenous devices. | % Hemolysis; Platelet aggregation (%); PTT/PT times. |
| Genotoxicity (Nano-specific) | OECD 487 (Micronucleus) adapted | Ensure NM does not interfere with assay readout; confirm cellular uptake. Include kinesin inhibitor. | Micronucleus frequency per 1000 binucleated cells. |
Detailed Experimental Protocols
Protocol 3.1: Preparation of Stable Nanomaterial Dispersions for Biological Testing
- Objective: To generate reproducible, stable, and agglomerate-minimized dispersions of NMs in biological media.
- Materials: Dry NM powder or stock suspension; relevant dispersion medium (e.g., cell culture medium + 10% FBS); probe sonicator (with temperature control); bath sonicator.
- Procedure:
- Weigh NM mass for a final stock concentration 10x the highest test concentration.
- Add the NM to the pre-warmed (37°C) dispersion medium in a sterile vial.
- Primary Dispersion: Use a probe sonicator with a microtip. Sonicate for 2-5 minutes in pulsed mode (1 sec on, 1 sec off) at an amplitude calibrated for the material (e.g., 20-40% amplitude). Keep vial in an ice-water bath to prevent heating.
- Immediate Use Dispersion: Before each addition to cells, agitate the primary stock and subject it to a 1-minute bath sonication to re-disperse any settled aggregates.
- Characterization: Measure the hydrodynamic diameter and PDI of the final working dilution in the exposure medium via DLS immediately before addition to cells. Document this data for each experiment.
Protocol 3.2: In Vitro Assessment of Nano-Specific Oxidative Stress
- Objective: To quantify intracellular ROS generation induced by NM exposure using a validated fluorogenic probe.
- Materials: DCFH-DA (2',7'-Dichlorodihydrofluorescein diacetate) probe; positive control (e.g., 100 µM tert-Butyl hydroperoxide); black-walled 96-well plates; fluorescence plate reader.
- Procedure:
- Seed relevant cells (e.g., THP-1 macrophages, primary hepatocytes) at 80% confluence in black-walled plates. Culture overnight.
- Load cells with 10 µM DCFH-DA in serum-free medium for 45 minutes at 37°C.
- Wash cells twice with PBS to remove extracellular probe.
- Expose cells to NM dispersions (from Protocol 3.1) at a range of concentrations in fresh, phenol-red-free medium. Include negative (medium only) and positive controls.
- Kinetic Measurement: Immediately place plate in a pre-warmed (37°C) plate reader. Measure fluorescence (Ex/Em ~485/535 nm) every 30 minutes for 6 hours.
- Data Analysis: Calculate the area under the curve (AUC) for the fluorescence vs. time plot for each treatment. Express data as fold-change in AUC relative to the negative control.
Protocol 3.3: Assessment of Nanomaterial Dissolution in Simulated Biological Fluids
- Objective: To measure the rate of ion release from NMs under physiologically relevant conditions.
- Materials: Simulated body fluid (SBF, pH 7.4), Simulated lysosomal fluid (SLF, pH 4.5 with citrate); Amicon Ultra centrifugal filter units (10 kDa MWCO); ICP-MS.
- Procedure:
- Prepare a 1 mg/mL dispersion of NM in SBF and SLF separately using Protocol 3.1 (omitting protein).
- Incubate dispersions at 37°C with gentle agitation.
- At predetermined timepoints (e.g., 1, 24, 72h), withdraw aliquots.
- Separation: Centrifuge aliquots in 10 kDa filter units at 4000 x g for 30 min. The filtrate contains dissolved ions; the retentate contains particles and large aggregates.
- Analysis: Acidify the filtrate with 2% nitric acid (trace metal grade). Analyze via ICP-MS for the concentration of the NM's core element(s).
- Reporting: Report dissolution as a percentage of the total element mass added initially, plotted against time.
Visualization of Pathways and Workflows
Title: Integration Path from Nano-Properties to Regulatory Data
Title: Core Workflow for Generating Submission-Ready Nano Data
The Scientist's Toolkit: Key Research Reagent Solutions
Table 3: Essential Materials for Nano-Specific Biocompatibility Testing
| Item / Reagent | Function / Role | Nano-Specific Consideration |
|---|---|---|
| Protein-Containing Dispersion Media (e.g., FBS-supplemented medium) | Provides a biologically relevant corona, improving dispersion stability and simulating in vivo conditions. | Prevents agglomeration artifacts; essential for dose accuracy. |
| Calibrated Probe Sonicator with Microtip | Provides high-energy input to break apart NM agglomerates in liquid suspension. | Critical for reproducible primary stock creation; amplitude/time must be optimized per NM. |
| Temperature-Controlled Bath Sonicator | Provides mild, uniform energy to re-suspend NMs before each experiment without inducing degradation. | Ensures consistent dosing from a stock over the duration of an experiment. |
| Dynamic Light Scattering (DLS) / Zeta Potential Instrument | Measures hydrodynamic size distribution (PDI) and surface charge in the actual exposure medium. | Mandatory QC step before every biological assay to document exposure conditions. |
| Fluorogenic ROS Probes (e.g., DCFH-DA, CellROX) | Detect intracellular oxidative stress, a key nano-specific toxicity pathway. | Use with plate readers capable of kinetic measurements; confirm probe is not quenched or adsorbed by NM. |
| Inductively Coupled Plasma Mass Spectrometry (ICP-MS) | Quantifies ultra-trace levels of elemental dissolution and biodistribution. | Required for dissolution studies and quantifying cellular uptake (after washing). |
| Low-Protein Binding Filters & Tubes (e.g., PVDF membrane, siliconized tubes) | Minimize non-specific loss of NM during sample preparation and filtration steps. | Prevents underestimation of concentration; critical for accurate dosing and dissolution analysis. |
| Positive Control Nanomaterials (e.g., OECD reference NMs, CuO NPs) | Provide a benchmark for assay performance and expected biological responses. | Allows validation of protocols and inter-laboratory comparison of results. |
Conclusion
Successfully navigating ISO 10993-22 requires a paradigm shift from traditional biocompatibility evaluation, centering on rigorous physicochemical characterization as the non-negotiable foundation for all subsequent toxicological testing. By adopting the tiered, nano-aware framework outlined, researchers can systematically address unique risks, overcome methodological hurdles, and generate robust, validated data. The future of nanomedical device evaluation will increasingly integrate advanced techniques like high-throughput screening and computational modeling to predict bio-interactions. Mastering ISO 10993-22 is not merely a regulatory checkpoint but a critical discipline that enables the safe, effective, and accelerated translation of innovative nanomedical technologies from bench to bedside, ensuring patient safety while fostering responsible innovation.