Mastering LNP-mRNA Formulation: A Comprehensive Guide to Protocols, Optimization, and Characterization for Researchers
This article provides a systematic and detailed guide to Lipid Nanoparticle (LNP) formulation for mRNA delivery, tailored for researchers and drug development professionals.
Mastering LNP-mRNA Formulation: A Comprehensive Guide to Protocols, Optimization, and Characterization for Researchers
Abstract
This article provides a systematic and detailed guide to Lipid Nanoparticle (LNP) formulation for mRNA delivery, tailored for researchers and drug development professionals. It explores the foundational science of LNPs, including core composition and structure-function relationships. Step-by-step methodological protocols for microfluidic and bulk mixing are presented, followed by critical troubleshooting and optimization strategies for encapsulation efficiency, stability, and scalability. The guide concludes with validation techniques and comparative analysis of leading LNP platforms, offering a holistic resource for advancing mRNA therapeutics and vaccines from bench to clinic.
The Science of LNPs for mRNA: Core Components, Mechanisms, and Design Principles
Lipid Nanoparticles (LNPs) represent the leading non-viral platform for the systemic delivery of messenger RNA (mRNA). Their dominance stems from their ability to overcome the significant biological barriers to nucleic acid delivery, including serum nuclease degradation, renal clearance, immunogenic recognition, and, crucially, the efficient cellular uptake and endosomal escape necessary for functional protein translation. The success of LNP-mRNA COVID-19 vaccines has clinically validated the platform, spurring intensive research into its optimization for broader therapeutic applications, from protein replacement and gene editing to cancer immunotherapy.
Critical Barriers to mRNA Delivery & LNP Solutions
LNPs are engineered to address a sequence of fundamental challenges. The quantitative efficacy of each barrier is summarized below.
Table 1: Key Barriers to Systemic mRNA Delivery and LNP-Mediated Solutions
| Barrier | Consequence | LNP Solution & Mechanism | Typical Efficacy Metric (LNP) |
|---|---|---|---|
| Nuclease Degradation | Rapid mRNA cleavage in circulation (minutes). | Condensation & encapsulation in lipid core protects mRNA. | >95% payload protection in serum (in vitro). |
| Renal Clearance | Rapid filtration of small, uncomplexed RNA. | Size control (70-150 nm) prevents glomerular filtration. | Circulation t½: 2-6 hours (species dependent). |
| Immune Recognition | TLR activation, IFN response, reduced translation. | Use of purified/modified nucleotides (e.g., N1-methylpseudouridine). | 10-100x reduction in IFN-α secretion vs. unmodified mRNA. |
| Cellular Uptake | Poor internalization of anionic mRNA. | Ionizable lipid enables charge-mediated endocytosis. | >80% cellular uptake in hepatocytes (in vivo). |
| Endosomal Entrapment | Lysosomal degradation of cargo. | Ionizable lipid mediates endosomal membrane destabilization. | ~2-4% endosomal escape efficiency (leading candidates). |
| Payload Release | mRNA trapped in LNP or complexed inefficiently. | Controlled biodegradation of lipids enables release. | Translation onset: 1-4 hours post-transfection (in vitro). |
Data compiled from recent literature (2022-2024).
Core LNP Components and Functions
A standard, clinically relevant LNP formulation comprises four key lipid components, each with a distinct structural and functional role.
Table 2: Essential LNP Lipid Components
| Component | Typical Molar Ratio | Primary Function | Common Examples (Research Grade) |
|---|---|---|---|
| Ionizable Lipid | 35-50% | 1. Complexes mRNA at low pH. 2. Drives endosomal escape via destabilization. | DLin-MC3-DMA, SM-102, ALC-0315, C12-200 |
| Phospholipid | 10-20% | Structural lipid; forms LNP bilayer, influences fusogenicity. | DSPC, DOPE |
| Cholesterol | 38-50% | Modulates membrane fluidity, stability, and integrity. | Animal-derived, Plant-derived (Phyto) |
| PEG-lipid | 1.5-2% | Controls nanoparticle size during formulation; reduces opsonization and aggregation. | DMG-PEG2000, ALC-0159, DSG-PEG2000 |
The Scientist's Toolkit: Key Research Reagent Solutions
Table 3: Essential Materials for LNP-mRNA Formulation & Analysis
| Item | Function/Description | Example Vendor/Product |
|---|---|---|
| Microfluidic Mixer | Enables rapid, reproducible mixing for nanoprecipitation. | Precision NanoSystems Ignite; Dolomite Nano Assembler |
| Ionizable Lipid | Critical functional component for encapsulation & escape. | Avanti Polar Lipids; BroadPharm; MedChemExpress |
| CleanCap mRNA | Co-transcriptionally capped, modified mRNA for high translation. | TriLink Biotechnologies |
| Nuclepore Track-Etch Memb. | For sizing LNPs via extrusion (if required). | Cytiva Whatman |
| Dynamic Light Scattering (DLS) | Instrument for measuring particle size (Z-avg) and PDI. | Malvern Panalytical Zetasizer |
| RiboGreen Assay | Fluorescent quantification of encapsulation efficiency. | Invitrogen Quant-iT RiboGreen |
| HepG2 or HEK293 Cells | Standard in vitro models for transfection efficiency testing. | ATCC |
| Luciferase mRNA | Standard reporter for quantifying protein expression. | Trilink Biotech (CleanCap Fluc mRNA) |
| Mouse Models (e.g., C57BL/6) | For in vivo evaluation of mRNA expression & biodistribution. | Jackson Laboratory |
Experimental Protocols
Protocol 5.1: Standard Microfluidic LNP Formulation (Ethanol Injection)
Objective: Reproducibly formulate LNPs encapsulating mRNA using rapid mixing.
Materials:
- Lipid stock solutions in ethanol (Ionizable lipid, DSPC, Cholesterol, PEG-lipid).
- mRNA in citrate buffer (10 mM, pH 4.0).
- Microfluidic mixer (e.g., Ignite, NanoAssemblr).
- PBS (1X, pH 7.4).
- Dialysis cassettes (MWCO 10kDa) or TFF system.
Procedure:
- Prepare Lipid Phase: Combine ionizable lipid, phospholipid, cholesterol, and PEG-lipid in ethanol at the desired molar ratio. Total lipid concentration typically 5-10 mM.
- Prepare Aqueous Phase: Dilute mRNA in citrate buffer (pH 4.0) to a concentration of 0.1-0.2 mg/mL.
- Microfluidic Mixing: Load the lipid-ethanol phase and mRNA aqueous phase into separate syringes. Connect to microfluidic cartridge. Set parameters: Total Flow Rate (TFR) = 12 mL/min, Flow Rate Ratio (FRR, aqueous:ethanol) = 3:1. Initiate mixing. Collect effluent in a vial.
- Buffer Exchange & Dialysis: Immediately dilute the crude LNP suspension with an equal volume of 1X PBS (pH 7.4). Transfer to a dialysis cassette and dialyze against >1000 volumes of PBS for 18-24 hours at 4°C to remove ethanol and raise pH. Alternatively, use Tangential Flow Filtration (TFF).
- Sterile Filtration: Filter the dialyzed LNP through a 0.22 µm PES syringe filter.
- Storage: Aliquot and store at 4°C for short-term use (days) or -80°C for long-term storage.
Protocol 5.2: Characterization: Size, PDI, and Encapsulation Efficiency
Objective: Determine hydrodynamic diameter, polydispersity, and mRNA encapsulation efficiency.
Part A: Dynamic Light Scattering (DLS)
- Dilute 10 µL of purified LNP formulation into 990 µL of 1X PBS (pH 7.4) in a disposable plastic cuvette.
- Equilibrate to 25°C in the instrument for 2 minutes.
- Perform measurement with standard settings (e.g., 3 runs of 12 sub-runs each).
- Record Z-average diameter (nm) and Polydispersity Index (PDI). PDI < 0.2 is acceptable.
Part B: RiboGreen Encapsulation Assay
- Prepare two sets of triplicate samples in a black 96-well plate:
- Total mRNA (T): 2 µL LNPs + 98 µL TE buffer (1% Triton X-100).
- Unencapsulated mRNA (U): 2 µL LNPs + 98 µL TE buffer (without Triton).
- Incubate 5 min to lyse LNPs (T samples only).
- Add 100 µL of 1:2000 diluted RiboGreen reagent in TE to each well. Incubate 5 min protected from light.
- Measure fluorescence (ex: 485 nm, em: 535 nm).
- Calculate: Encapsulation Efficiency (%) = [1 - (U/T)] × 100.
Protocol 5.3: In Vitro Transfection Efficiency Assay
Objective: Assess functional mRNA delivery and protein expression in cultured cells.
Materials:
- HEK293 or HepG2 cells, seeded in a 96-well plate.
- LNP-mRNA (e.g., encoding Firefly Luciferase, Fluc).
- Luciferase Assay System.
- Plate reader with luminescence detection.
Procedure:
- Seed cells at 10,000 cells/well in 100 µL complete medium 24 hours prior.
- Dilute LNP-Fluc in serum-free medium to desired concentration (e.g., 10-100 ng mRNA/well).
- Aspirate medium from cells and add 100 µL of LNP-containing medium.
- Incubate cells at 37°C, 5% CO₂ for 4-6 hours, then replace with fresh complete medium.
- At 24 hours post-transfection, remove medium, lyse cells with 50 µL Passive Lysis Buffer (PLB) for 15 min with shaking.
- Transfer 20 µL lysate to a white plate, inject 100 µL Luciferase Assay Substrate, and measure luminescence immediately (integration time 1-2 sec).
- Normalize luminescence to total protein content (via BCA assay) for comparative analysis.
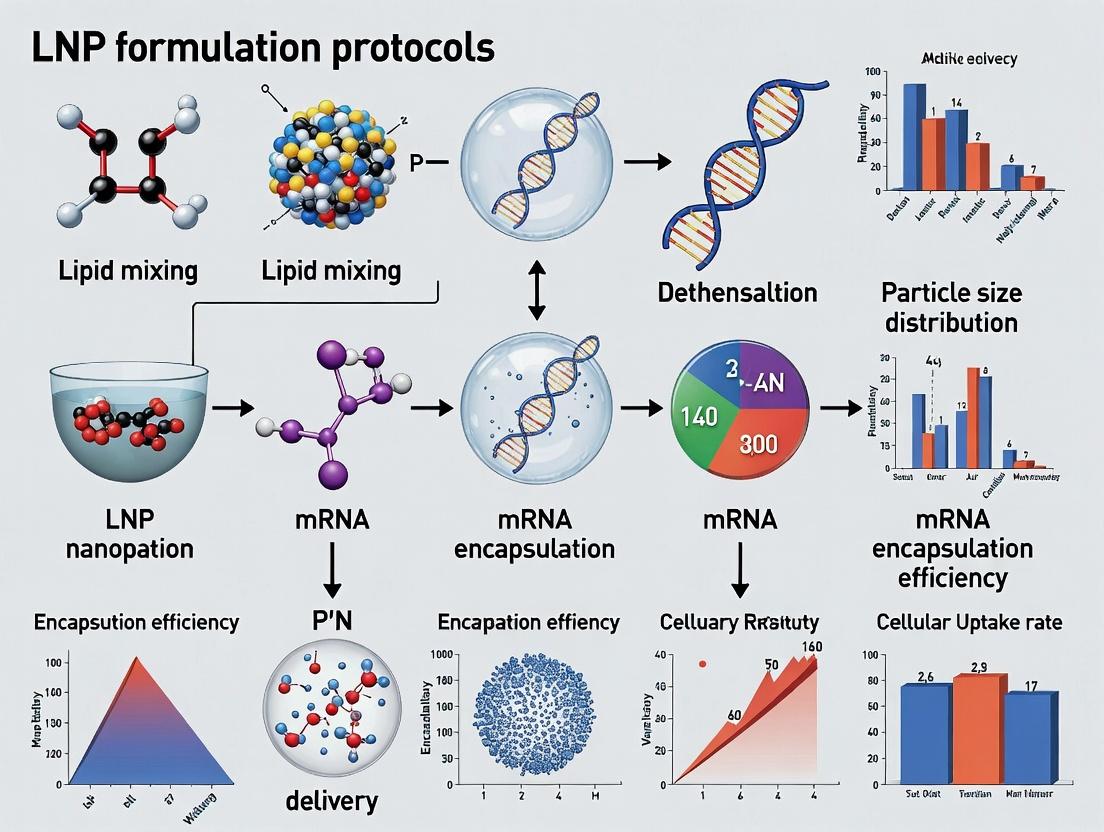
Visualizations
Title: LNP-mRNA Formulation and Purification Workflow
Title: Mechanism of LNP-mRNA Delivery from Injection to Translation
Application Notes: Role and Optimization of LNP Components
Lipid Nanoparticles (LNPs) are the leading non-viral delivery platform for mRNA therapeutics and vaccines. Their efficacy hinges on the precise formulation and molar ratio of four critical lipid components, each fulfilling a distinct structural and functional role within the broader thesis of optimizing mRNA delivery protocols for stability, efficacy, and targeted delivery.
1. Ionizable/Cationic Lipid
- Function: The cornerstone of mRNA encapsulation and endosomal escape. At low pH (e.g., in the endosome), the ionizable amine head group becomes positively charged, interacting with the negatively charged mRNA during formulation and facilitating disruption of the endosomal membrane to release the payload into the cytoplasm.
- Key Parameter: The pKa of the ionizable lipid should ideally be between 6.0 and 6.5 to be neutral at physiological pH (reducing toxicity) but cationic in the acidic endosome.
- Optimization Note: Novel biodegradable ionizable lipids (e.g., SM-102, ALC-0315) are now preferred over historical cationic lipids (e.g., DLin-MC3-DMA) to improve tolerability and therapeutic index.
2. Helper/Phospholipid
- Function: A structural lipid that contributes to the formation and stability of the LNP bilayer. It often resembles endogenous phospholipids (e.g., phosphatidylcholines) and enhances fusogenicity, aiding in cellular uptake and endosomal escape.
- Common Choice: DSPC (1,2-distearoyl-sn-glycero-3-phosphocholine) is widely used for its high phase transition temperature, which increases bilayer stability at physiological temperatures.
3. Cholesterol
- Function: A natural biomolecule that integrates into the LNP bilayer to fill gaps between lipid tails, enhancing structural integrity, stability, and fluidity. It is critical for promoting membrane fusion during cellular uptake and endosomal escape.
- Optimization Note: Cholesterol derivatives, such as β-sitosterol, have shown improved delivery efficiency in some preclinical models by modulating membrane properties and intracellular trafficking.
4. PEGylated Lipid (PEG-lipid)
- Function: A surface-acting lipid with a hydrophilic polyethylene glycol (PEG) chain. Its primary roles are to control particle size during formulation by preventing aggregation, improve colloidal stability in storage and circulation, and reduce nonspecific protein adsorption and clearance. The PEG-lipid gradually dissociates in vivo to allow cellular interaction.
- Key Parameter: The length of the PEG chain (e.g., PEG2000) and its molar percentage (typically 1.0-2.5%) are critical for balancing stability versus timely disassembly for cell uptake.
Table 1: Representative Molar Ratios of LNP Components in Clinical Formulations
| Lipid Component | Example Molecule | Typical Molar % Range | Function in Brief |
|---|---|---|---|
| Ionizable Lipid | SM-102, ALC-0315 | 35-50% | mRNA complexation, endosomal escape |
| Helper Lipid | DSPC | 10-20% | Bilayer structure, fusogenicity |
| Cholesterol | Pharmaceutical grade | 38-45% | Membrane integrity, fluidity |
| PEG-lipid | DMG-PEG2000, ALC-0159 | 1.0-2.5% | Size control, stability, stealth |
Table 2: Impact of Ionizable Lipid pKa on Key LNP Performance Metrics
| Ionizable Lipid pKa Range | Encapsulation Efficiency (%) | Endosomal Escape Efficiency | Observed In Vivo Tolerability |
|---|---|---|---|
| < 5.5 | Moderate to Low (70-85%) | Poor | High (Low toxicity) |
| 5.8 - 6.5 (Optimal) | High (> 90%) | Excellent | Moderate to High |
| > 7.0 | High (> 90%) | Moderate | Low (Increased toxicity) |
Experimental Protocols
Protocol 1: Microfluidic Formulation of mRNA-LNPs Objective: Reproducibly prepare mRNA-loaded LNPs using a rapid mixing technique. Materials: Ethanol reservoir, aqueous buffer reservoir (e.g., 50 mM citrate, pH 4.0), mRNA in citrate buffer, syringe pumps, microfluidic mixer chip (e.g., NanoAssemblr Ignite), collection tube, dialysis cassettes. Method:
- Lipid Stock Prep: Dissolve ionizable lipid, DSPC, cholesterol, and PEG-lipid in ethanol to a total lipid concentration of 10-12 mM. Maintain the desired molar ratio (e.g., 50:10:38.5:1.5).
- Aqueous Phase Prep: Dilute mRNA in aqueous citrate buffer to a concentration of 0.1-0.2 mg/mL.
- Mixing: Load the lipid-ethanol solution and the mRNA aqueous solution into separate syringes. Connect syringes to the microfluidic chip. Set a controlled total flow rate (e.g., 12 mL/min) and a flow rate ratio (aqueous:ethanol) of 3:1. Initiate simultaneous pumping.
- Collection: Collect the turbid solution effluent in a tube.
- Buffer Exchange & Purification: Dilute the collected LNP mixture with 1x PBS (pH 7.4) to reduce ethanol concentration. Perform tangential flow filtration (TFF) or dialysis against PBS for ≥ 4 hours to remove ethanol, exchange buffers, and remove unencapsulated mRNA.
- Sterile Filtration: Filter the final formulation through a 0.22 µm PES membrane.
Protocol 2: Characterization of mRNA-LNPs Objective: Determine critical quality attributes (CQAs) of the formulated LNPs. A. Particle Size and Polydispersity (PDI) by DLS: 1. Dilute 10 µL of LNP formulation in 1 mL of 1x PBS (filtered, 0.22 µm). 2. Load into a disposable cuvette or low-volume cassette. 3. Measure using Dynamic Light Scattering (DLS) instrument. Report Z-average diameter (nm) and PDI. Target: 70-100 nm, PDI < 0.2.
B. Encapsulation Efficiency (%) by Ribogreen Assay: 1. Prepare two sets of samples in a black 96-well plate: * Total RNA (T): 10 µL LNPs + 90 µL 0.5% Triton X-100. * Free RNA (F): 10 µL LNPs + 90 µL 1x PBS. 2. Incubate for 5 mins to lyse LNPs in Triton samples. 3. Add 100 µL of 1:200 diluted Quant-iT RiboGreen reagent to each well. Incubate 5 mins in the dark. 4. Measure fluorescence (excitation ~480 nm, emission ~520 nm). 5. Calculate: %EE = [1 - (FluorescenceF / FluorescenceT)] * 100.
Diagrams
Title: LNP Formulation Development Workflow
Title: mRNA Delivery Mechanism via LNP
The Scientist's Toolkit: Key Research Reagent Solutions
Table 3: Essential Materials for LNP-mRNA Formulation Research
| Item | Example/Catalog | Function & Application Notes |
|---|---|---|
| Ionizable Lipid | SM-102 (MedChemExpress HY-130456) | The key functional lipid for mRNA complexation. Store at -20°C under inert gas. |
| Structural Phospholipid | DSPC (Avanti 850365P) | Provides a stable, fusogenic lipid bilayer structure. Ensure high purity (>99%). |
| Cholesterol | Pharmaceutical Grade (Sigma C8667) | Stabilizes LNP structure. Use powder or prepared stock in ethanol. |
| PEG-lipid | DMG-PEG2000 (Avanti 880151P) | Controls nanoparticle size and provides stealth properties. Critical for reproducibility. |
| Microfluidic Mixer | NanoAssemblr Ignite (Precision NanoSystems) | Enables reproducible, scalable LNP production via rapid solvent exchange. |
| mRNA Template | CleanCap modified mRNA (Trilink) | Research-grade mRNA with 5' cap analog for enhanced stability and translation. |
| Buffer System | 50 mM Citrate Buffer, pH 4.0 (Thermo Fisher) | Acidic aqueous phase for protonating ionizable lipid during mixing. |
| Characterization Kit | Quant-iT RiboGreen RNA Assay (Invitrogen R11490) | Fluorescent assay for accurate determination of mRNA encapsulation efficiency. |
| Dialysis Device | Slide-A-Lyzer G2 Cassettes, 10K MWCO (Thermo Fisher) | For buffer exchange and removal of unencapsulated mRNA and organic solvent. |
| Size Analysis | Zetasizer Ultra (Malvern Panalytical) | Dynamic Light Scattering (DLS) instrument for measuring particle size, PDI, and zeta potential. |
The efficacy of mRNA-LNP therapeutics is intrinsically tied to the structural integrity of the mRNA payload. The mRNA molecule is a complex entity comprising several critical regions: the 5' cap, 5' untranslated region (UTR), coding sequence (CDS), 3' UTR, and poly(A) tail. Each element plays a distinct role in stability, translational efficiency, and immunogenicity. Within the context of LNP formulation research, preserving the chemical and topological integrity of mRNA from synthesis through to intracellular delivery is paramount for reproducible biological activity.
Quantitative Integrity Requirements and Specifications
The following tables summarize key quantitative benchmarks for mRNA payload integrity.
Table 1: Critical mRNA Purity and Integrity Specifications
| Parameter | Target Specification | Analytical Method | Impact on Performance |
|---|---|---|---|
| Purity (IVT Reaction Residuals) | dsRNA < 0.001% | dsRNA-Specific ELISA | Reduces innate immune activation (PKR, OAS). |
| Protein < 0.01% | Host Cell Protein ELISA | Minimizes carrier-independent immunogenicity. | |
| Aborted RNA Transcripts < 15% | HPLC or CE | Maximizes functional full-length product. | |
| Capping Efficiency | > 95% Cap 1 Structure | LC-MS/MS | Ensures high translation initiation and reduces RIG-I recognition. |
| Poly(A) Tail Length & Distribution | 100-150 nucleotides, low dispersity | PAS-PAGE or NGS | Directly correlates with translation longevity and protein yield. |
| Primary Integrity (Full-Length Content) | > 80% | Capillary Electrophoresis (CE) | Ensures delivery of intact coding sequence. |
| Secondary Integrity (Potency) | In vitro relative potency > 80% ref. std | Cell-based expression assay (e.g., luciferase) | Functional confirmation of biological activity. |
Table 2: Stability Thresholds for Formulated mRNA-LNPs
| Stress Condition | Acceptable Limit for Integrity Loss | Key Degradation Pathway Monitored |
|---|---|---|
| Thermal (2-8°C, long-term) | < 10% loss in potency over 24 months | Hydrolytic cleavage, particularly in poly(A) region. |
| Freeze-Thaw (3 cycles) | < 5% increase in fragment species | Physical shearing and LNP structural perturbation. |
| Agitation (mechanical stress) | < 3% increase in fragment species | Shear-induced mRNA breakage. |
Detailed Protocols for mRNA Integrity Assessment
Protocol 1: Analysis of mRNA Purity and Primary Integrity by Capillary Electrophoresis (CE)
Objective: To quantify the percentage of full-length mRNA and detect fragment impurities. Materials: Fragment Analyzer or Bioanalyzer system, RNA-specific sensitivity kit, ladder, RNA sample. Procedure:
- Denaturation: Dilute mRNA sample to ~50 ng/µL in nuclease-free water. Heat at 70°C for 2 minutes, then immediately place on ice.
- Gel-Prime/Instrument Prep: Load the gel matrix and conditioning solution as per instrument manual.
- Sample Loading: Mix 1 µL of denatured sample with 19 µL of marker/loading buffer. Include an RNA ladder in a separate well.
- Run Method: Execute the predefined method for RNA size and integrity (typically 15-40 seconds injection, 15-30 minute separation).
- Analysis: Software calculates the molar concentration of peaks. The percentage full-length is calculated as: (Area of primary peak / Total area of all RNA peaks) x 100. Record electropherogram.
Protocol 2: Determination of Capping Efficiency by Liquid Chromatography-Mass Spectrometry (LC-MS/MS)
Objective: To accurately quantify the ratio of Cap 0, Cap 1, and uncapped mRNA species. Materials: Nuclease P1, Antarctic Phosphatase, LC-MS/MS system with reverse-phase column, synthetic cap standards. Procedure:
- Digestion: Digest 2 µg of mRNA with Nuclease P1 (0.5 U) and Antarctic Phosphatase (5 U) in 20 µL buffer at 37°C for 2 hours.
- Analysis: Inject the digest onto the LC-MS/MS. Use a gradient elution (water/acetonitrile with ammonium acetate).
- Detection & Quantification: Monitor multiple reaction monitoring (MRM) transitions for m7GpppG (Cap 0), m7GpppGm (Cap 1), and GpppG (uncapped). Use calibration curves from pure standards.
- Calculation: Capping Efficiency (%) = [(Peak Area Cap 1) / (Peak Area Cap 0 + Cap 1 + Uncapped)] x 100.
Protocol 3: In Vitro Potency Assay for mRNA Integrity
Objective: To functionally assess the translatability of the mRNA payload. Materials: HEK293T or other relevant cell line, transfection reagent (for naked mRNA control) or prepared LNP formulation, luciferase assay kit, plate reader. Procedure:
- Cell Seeding: Seed cells in a 96-well plate at a density ensuring 80-90% confluency at time of assay (e.g., 20,000 cells/well) 24 hours prior.
- Dosing: For LNP testing, dilute LNPs in serum-free medium to desired mRNA concentration (e.g., 10-100 ng/well). For naked mRNA control, use a standard transfection reagent. Apply to cells. Include a negative control (buffer only).
- Incubation: Incubate cells for a defined period (e.g., 6-24h post-transfection) at 37°C, 5% CO2.
- Lysis & Measurement: Aspirate medium, lyse cells with passive lysis buffer. Transfer lysate to a white assay plate. Add luciferase substrate and measure luminescence immediately.
- Analysis: Calculate relative potency: (Mean RLU of Test Sample / Mean RLU of Reference Standard) x 100%. Report as a percentage of the reference.
Visualizations
Title: mRNA Structural Components Map
Title: mRNA Integrity Control Workflow
Title: mRNA Degradation Pathways & Causes
The Scientist's Toolkit: Key Research Reagent Solutions
Table 3: Essential Reagents for mRNA Integrity Research
| Item | Function/Description | Key Consideration |
|---|---|---|
| RNase Inhibitors (e.g., recombinant RNasin) | Inhibits a broad spectrum of RNases, critical for handling naked mRNA during analytical prep. | Use at a consistent concentration (e.g., 0.5 U/µL) in all buffers for sample prep. |
| dsRNA-Specific Monoclonal Antibody (J2 clone) | Selective detection and removal of dsRNA impurities via ELISA or pulldown. | Critical for reducing immunostimulatory profile; targets >40 bp dsRNA. |
| Cap Analogues (CleanCap, ARCA) | Co-transcriptional capping agents that yield high % of Cap 1 structure. | CleanCap AG provides >95% Cap 1 efficiency, superior to traditional ARCA. |
| In Vitro Transcription Kit (T7 polymerase) | High-yield synthesis of mRNA. Kit components (NTPs, buffer) affect dsRNA byproduct levels. | Choose kits with optimized buffers to minimize dsRNA formation. |
| Capping & Poly(A) Tailing Enzymes | Enzymatic post-transcriptional modification (if not co-transcriptional). | Ensure high-efficiency capping enzymes (e.g., Vaccinia Capping System) and poly(A) polymerase. |
| Size-Based Purification Beads (e.g., magnetic oligo-dT) | Selection of polyadenylated mRNA and removal of short abortive transcripts. | Provides superior length homogeneity compared to standard LiCl precipitation. |
| Reference Standard mRNA | A fully characterized, stable mRNA batch used as a comparator in potency and integrity assays. | Essential for calculating relative potency; must be stored in single-use aliquots at -80°C. |
| Stable-Luciferase Reporter mRNA Control | Non-therapeutic mRNA encoding a luciferase for standardized potency assessment across experiments. | Allows for normalization and system suitability testing of delivery platforms. |
This Application Note details the spontaneous assembly of Lipid Nanoparticles (LNPs) for mRNA delivery, a cornerstone technology for modern therapeutics, including mRNA vaccines. The process leverages the inherent physicochemical properties of ionizable cationic lipids, phospholipids, cholesterol, and PEG-lipids to form stable, self-assembled nanostructures that encapsulate and protect mRNA.
Key Application Areas:
- Prophylactic & Therapeutic Vaccines: Rapid development and deployment of mRNA-based vaccines against infectious diseases.
- Protein Replacement Therapy: Delivery of mRNA encoding functional proteins to compensate for genetic deficiencies.
- Gene Editing: Delivery of mRNA encoding CRISPR-Cas9 components for targeted genomic modifications.
- Cancer Immunotherapy: Delivery of mRNA encoding tumor-associated antigens or immunomodulators.
Mechanistic Insight: The formulation is driven by the pH-dependent behavior of ionizable lipids. At low pH (e.g., pH 4.0 in an aqueous buffer), the ionizable lipid becomes positively charged, enabling electrostatic complexation with negatively charged mRNA. Upon mixing this ethanol-lipid solution with a neutral-pH aqueous buffer (e.g., citrate or Tris buffer), the lipids experience a polarity shift, causing a rapid decrease in solubility. This, combined with the hydrophobic effect, drives spontaneous self-assembly into nanoparticles, entrapping the mRNA in an aqueous core surrounded by a lipid bilayer. The final preparation is then dialyzed or diafiltrated into a neutral, isotonic buffer (e.g., PBS, pH 7.4) for stabilization and storage.
Table 1: Representative Lipid Compositions for mRNA-LNPs
| Lipid Component | Function | Typical Molar % Range | Common Examples |
|---|---|---|---|
| Ionizable Cationic Lipid | mRNA complexation & endosomal escape | 35-50% | DLin-MC3-DMA, SM-102, ALC-0315 |
| Phospholipid | Bilayer structure & fusogenicity | 10-20% | DSPC, DOPE, POPC |
| Cholesterol | Membrane stability & fluidity modulation | 38-45% | Cholesterol (plant-derived) |
| PEG-lipid | Stability, steric hindrance, size control | 1.5-3% | DMG-PEG2000, ALC-0159, DSG-PEG2000 |
Table 2: Critical Quality Attributes (CQAs) of mRNA-LNPs
| CQA | Target Range | Analytical Method | Impact on Performance |
|---|---|---|---|
| Particle Size (Z-avg) | 70-120 nm | Dynamic Light Scattering (DLS) | Biodistribution, cellular uptake |
| Polydispersity Index (PDI) | < 0.2 | DLS | Batch homogeneity & reproducibility |
| Encapsulation Efficiency | > 90% | Ribogreen Assay | Potency, stability, reactogenicity |
| mRNA Integrity | > 95% full-length | Capillary Gel Electrophoresis | Translational efficacy |
| Zeta Potential (in PBS) | -10 to +10 mV | Electrophoretic Light Scattering | Colloidal stability in vivo |
Detailed Experimental Protocols
Protocol 1: Microfluidic Preparation of mRNA-LNPs
Objective: To reproducibly formulate mRNA-encapsulating LNPs via rapid mixing using a microfluidic device.
Materials:
- Lipid Stock Solution: Ionizable lipid, DSPC, cholesterol, and DMG-PEG2000 dissolved in ethanol at a total lipid concentration of 10-25 mM.
- Aqueous Phase: mRNA diluted in 50 mM citrate buffer, pH 4.0, at a target concentration (e.g., 0.1 mg/mL).
- Microfluidic Device: (e.g., NanoAssemblr Ignite or similar staggered herringbone mixer).
- Dialysis Tubing/TFF System: MWCO 20-100 kDa.
- Dialysis Buffer: 1X PBS, pH 7.4.
- Sterile Filters: 0.22 µm pore size.
Procedure:
- Preparation: Warm the aqueous mRNA solution to room temperature. Ensure lipid stock is fully dissolved.
- Loading: Load the lipid-ethanol solution and the aqueous mRNA solution into separate syringes.
- Mixing: Set the total flow rate (TFR) on the microfluidic instrument. A typical TFR is 12 mL/min with a flow rate ratio (FRR) of 3:1 (aqueous:ethanol). Initiate mixing. The formation occurs instantaneously within the mixing chamber.
- Collection: Collect the crude LNP suspension in a sterile container.
- Buffer Exchange: Transfer the crude LNP suspension into dialysis tubing or a TFF system. Dialyze against ≥200 volumes of 1X PBS, pH 7.4, for a minimum of 18 hours at 4°C, with at least one buffer change. Alternatively, perform diafiltration with 10-20 volumes of PBS.
- Sterile Filtration & Storage: Filter the dialyzed LNP formulation through a 0.22 µm sterile filter. Aliquot and store at 2-8°C or -80°C for long-term storage.
Protocol 2: Characterization of mRNA-LNPs
Part A: Particle Size and PDI by DLS
- Dilute the LNP sample 1:50 in 1X PBS or 1 mM KCl to achieve an optimal scattering intensity.
- Load into a disposable cuvette or microcuvette.
- Equilibrate to 25°C in the instrument.
- Perform measurement with at least 3 runs of 10-15 seconds each.
- Report the Z-average diameter and PDI from the cumulants analysis.
Part B: mRNA Encapsulation Efficiency by Ribogreen Assay
- Prepare two sets of triplicate samples in a black 96-well plate:
- Total mRNA (T): 5 µL LNP + 195 µL TE buffer with 0.5% Triton X-100.
- Free mRNA (F): 5 µL LNP + 195 µL TE buffer without detergent.
- Incubate for 5 minutes.
- Add 100 µL of diluted Ribogreen reagent (1:200 in TE) to each well. Protect from light.
- Incubate for 5 minutes, then measure fluorescence (ex/em ~480/520 nm).
- Calculate % Encapsulation = [1 - (F/T)] x 100%.
Visualizations
LNP Formulation Workflow from Lipids to Final Product
Molecular Organization of an mRNA-LNP
The Scientist's Toolkit: Research Reagent Solutions
Table 3: Essential Materials for LNP Formulation Research
| Item / Reagent | Function / Role | Example Product / Note |
|---|---|---|
| Ionizable Cationic Lipids | Core functional lipid for nucleic acid complexation and endosomal escape via the proton sponge effect. | SM-102, ALC-0315. Critical for efficacy. |
| Helper Lipids (DSPC, DOPE) | Provide structural integrity to the bilayer; DOPE promotes fusogenicity. | 1,2-distearoyl-sn-glycero-3-phosphocholine (DSPC). |
| Cholesterol | Modulates membrane fluidity and stability, enhances in vivo tolerability. | Use high-purity, synthetic or plant-derived. |
| PEGylated Lipids | Controls particle size during formulation, reduces aggregation, prolongs circulation. | DMG-PEG2000. Critical for manufacturing reproducibility. |
| Microfluidic Mixer | Enables rapid, reproducible, and scalable mixing of lipid and aqueous phases. | NanoAssemblr platforms, microfluidic chips. |
| Tangential Flow Filtration (TFF) System | For efficient buffer exchange, concentration, and purification of LNP formulations. | KrosFlo systems, hollow fiber filters. |
| Ribogreen Quantitation Kit | Fluorescent assay for accurate, high-throughput measurement of mRNA encapsulation efficiency. | Quant-iT RiboGreen RNA Assay Kit. |
| Dynamic Light Scattering (DLS) Instrument | Measures particle size (Z-avg), size distribution (PDI), and zeta potential. | Malvern Zetasizer Nano series. |
Within the broader thesis on advancing LNP formulation for mRNA delivery, understanding the precise relationship between component ratios, biophysical properties, and biological outcomes is paramount. These Application Notes detail the core principles and protocols for systematically analyzing how ionizable lipid structure, helper lipid selection, cholesterol percentage, and PEG-lipid content dictate LNP efficacy, stability, and cellular/organ tropism.
Quantitative Composition-Property Relationships
The table below summarizes key quantitative relationships derived from recent high-throughput screening studies and in vivo analyses.
Table 1: Impact of LNP Component Variation on Critical Parameters
| Component & Variation | Key Biophysical Property Affected | Typical Measurement Change | Observed Biological Outcome (Tropism/Efficacy) |
|---|---|---|---|
| Ionizable Lipid pKa | Endosomal Disruption Efficiency | pKa 5.0-6.2 optimal for acid-triggered ionization | pKa ~6.0-6.5: Maximizes hepatic delivery. pKa <6.0: Enhances extrahepatic tropism (e.g., lung, spleen). |
| PEG-lipid Molar % | Particle Size, Stability, & Opsonization | 0.5-2.0% range; >1.5% reduces APC uptake | High % (>1.5%): Reduced immunogenicity, longer circulation, decreased cellular uptake. Low % (<0.5%): Rapid clearance, increased aggregation. |
| Cholesterol % | Membrane Rigidity & Integrity | Typically 35-50% of total lipid; Tuning ±10% | High % (~50%): Enhanced stability, increased hepatic delivery. Reduced % (~35%): Potentially increased endosomal escape, altered tropism. |
| Helper Lipid Type | Surface Charge & Fusogenicity | DOPE promotes hexagonal phase; DSPC enhances bilayer stability | DOPE: Favors endosomal escape, often higher efficacy in vitro. DSPC: Enhances particle stability in vivo, supports hepatic targeting. |
| A:P Ratio | mRNA Encapsulation & Release | Optimal (3:1 to 6:1) for >90% encapsulation | Low Ratio (<3:1): Poor encapsulation, rapid mRNA degradation. High Ratio (>8:1): Potential cytotoxicity, aggregation. |
Core Protocol: Microfluidic Formulation & Characterization
This standardized protocol is essential for generating reproducible LNPs to study structure-function relationships.
Protocol 1: High-Throughput LNP Screening via Microfluidics
Objective: To formulate a matrix of LNPs with systematic variation in ionizable lipid:PEG-lipid ratio and characterize their biophysical properties.
Materials:
- Ethanol Phase: Ionizable lipid (e.g., DLin-MC3-DMA), DSPC, Cholesterol, DMG-PEG2000 dissolved in anhydrous ethanol.
- Aqueous Phase: mRNA in 10 mM citrate buffer, pH 4.0.
- Equipment: Microfluidic mixer (e.g., NanoAssemblr Ignite), syringe pumps, dialysis cassettes (MWCO 10 kDa).
- Buffers: 1x PBS, pH 7.4.
Procedure:
- Prepare Lipid Stock: Combine lipids in ethanol at a total lipid concentration of 10 mM. Create variations where the molar % of PEG-lipid is 0.5, 1.0, 1.5, and 2.0%, adjusting ionizable lipid accordingly.
- Prepare mRNA Solution: Dilute mRNA in citrate buffer to 0.1 mg/mL.
- Microfluidic Mixing: Set total flow rate (TFR) to 12 mL/min and flow rate ratio (FRR, aqueous:ethanol) to 3:1. Load solutions into syringes and initiate mixing. Collect LNP suspension in a vial.
- Dialysis: Immediately dialyze the formed LNPs against 1x PBS (pH 7.4) for 2 hours at room temperature to remove ethanol and buffer exchange.
- Characterization: Measure particle size (PDI) via DLS, encapsulation efficiency using Ribogreen assay, and surface charge via zeta potential.
Analysis: Plot PEG-lipid % vs. Size, PDI, and Encapsulation Efficiency to identify the optimal window for desired properties.
Protocol: Evaluating Tropism viaIn VivoBioluminescence Imaging
Protocol 2: Organ Tropism Analysis of Formulated LNPs
Objective: To compare the biodistribution and protein expression profiles of LNPs with differing ionizable lipid pKa.
Materials:
- LNPs: Formulated with ionizable lipids of pKa 5.8 (Lipid A) and 6.5 (Lipid B), encapsulating firefly luciferase mRNA.
- Animals: C57BL/6 mice (n=5 per group).
- Equipment: In vivo imaging system (IVIS), living image software.
- Reagents: D-luciferin potassium salt (15 mg/mL in PBS), isoflurane anesthesia.
Procedure:
- LNP Administration: Inject mice intravenously via tail vein with 0.5 mg/kg mRNA dose in 100 µL total volume.
- Imaging Time Course: At 4, 24, and 48 hours post-injection, administer D-luciferin (150 mg/kg IP). Anesthetize mice and place in the IVIS chamber.
- Image Acquisition: Acquire bioluminescent images with consistent exposure settings (1-60 sec).
- Quantification: Using region-of-interest (ROI) analysis, quantify total radiant efficiency ([p/s/cm²/sr] / [µW/cm²]) for liver, spleen, and lungs.
- Statistical Analysis: Perform one-way ANOVA with Tukey's post-hoc test to compare signal between groups at each time point and organ.
Expected Outcome: Lipid A (pKa 5.8) will show significant signal in the spleen and lungs, while Lipid B (pKa 6.5) will show dominant hepatic signal.
Visualization: LNP Design-to-Function Workflow
LNP Design and Screening Iterative Cycle
Visualization: Mechanism of Ionizable Lipid-Mediated Endosomal Escape
Ionizable Lipid Mechanism in Endosomal Escape
The Scientist's Toolkit: Key Reagent Solutions
Table 2: Essential Materials for LNP Structure-Function Research
| Reagent/Material | Function & Rationale | Example Product/Catalog |
|---|---|---|
| Ionizable Lipid Library | Systematic variation of pKa & tail structure to correlate with tropism. Critical for QSPR studies. | E.g., Custom synthesis or libraries from BroadPharm, Avanti. |
| mRNA (Luciferase/GFP) | Reporter mRNA for rapid, quantitative evaluation of delivery efficacy in vitro and in vivo. | TriLink CleanCap Luciferase (mRNA) or GFP mRNA. |
| Microfluidic Mixer | Enables reproducible, scalable LNP formation with precise control over mixing parameters. | NanoAssemblr Ignite or Blaze; Dolomite Microfluidic chips. |
| Ribogreen Assay Kit | Quantifies percent mRNA encapsulated within LNPs vs. free mRNA. Essential for QA. | Quant-iT RiboGreen RNA Assay (Thermo Fisher, R11490). |
| In Vivo Imaging System (IVIS) | Non-invasive, longitudinal tracking of biodistribution and functional protein expression. | PerkinElmer IVIS Spectrum or Lumina series. |
| Size Exclusion Columns | Rapid purification of LNPs from unencapsulated mRNA for in vivo studies. | Illustra NAP-25 Columns (Cytiva) or similar. |
| Lipidomics Standards | Internal standards for quantifying lipid component metabolism and clearance in vivo. | SPLASH LIPIDOMIX Mass Spec Standard (Avanti, 330707). |
This application note is framed within a broader thesis research program focused on advancing Lipid Nanoparticle (LNP) formulation for optimized mRNA delivery. The landmark approval of mRNA-LNP vaccines for COVID-19 represented a paradigm shift in vaccinology and nucleotherapeutics, validating the LNP platform. This document details key advances, quantitative benchmarks, and standardized protocols that define the current state of the field, providing a foundation for next-generation formulation research.
Key Quantitative Advances in Clinical-Stage LNP Formulations
The table below summarizes critical quantitative parameters for landmark and emerging LNP formulations, highlighting the evolution of the technology.
Table 1: Comparative Analysis of Key mRNA-LNP Formulations
| Formulation (Commercial/Code Name) | Key Lipid Components & Molar Ratios (Ionizable Lipid:Phospholipid:Cholesterol:PEG-Lipid) | mRNA Payload (Encapsulation Efficiency %) | Mean Particle Size (nm) & PDI | Key Advance / Clinical Indication | Primary Administration Route |
|---|---|---|---|---|---|
| Comirnaty (Pfizer-BioNTech) | ALC-0315:DSPC:Cholesterol:ALC-0159 (46.3:9.4:42.7:1.6) | 30 µg mod-mRNA (>95%) | ~80-100 nm (PDI <0.1) | First FDA-approved mRNA vaccine; on-dense-particle-ionizable lipid ALC-0315. | Intramuscular |
| Spikevax (Moderna) | SM-102:DSPC:Cholesterol:DMG-PEG 2000 (50:10:38.5:1.5) | 100 µg mod-mRNA (>95%) | ~100 nm (PDI ~0.1) | Proprietary ionizable lipid SM-102; higher dose formulation. | Intramuscular |
| Onpattro (Patisiran) | DLin-MC3-DMA:DSPC:Cholesterol:DMG-PEG 2000 (50:10:38.5:1.5) | siRNA (~95%) | ~80 nm | First FDA-approved LNP therapeutic; benchmark ionizable lipid MC3. | Intravenous |
| ARCT-154 (Self-Amplifying mRNA Vaccine) | Proprietary Lipid: DSPC:Cholesterol:PEG-Lipid | 5 µg sa-mRNA (>90%) | ~100 nm | Demonstrated potent immunogenicity with significantly lower sa-mRNA dose. | Intramuscular |
| LNP for Hepatic Delivery (Research Standard) | DLin-MC3-DMA or Moderna Lipid 5:DSPC:Cholesterol:DMG-PEG 2000 (50:10:38.5:1.5) | Variable mRNA/siRNA (>90%) | 70-100 nm | Benchmark for hepatocyte tropism via ApoE-mediated uptake. | Intravenous |
Core Protocols for LNP Formulation and Characterization
Protocol 3.1: Microfluidic Mixing for LNP Preparation (Bench-Scale)
Aim: Reproducibly formulate mRNA-LNPs using staggered herringbone micromixer (SHM) technology. Materials: Ethanol phase (ionizable lipid, phospholipid, cholesterol, PEG-lipid in ethanol), aqueous phase (mRNA in citrate or acetate buffer, pH ~4.0), syringe pumps, SHM chip (e.g., Precision NanoSystems Ignite or Dolomite Microfluidic Chip), PBS (pH 7.4), dialysis cassettes or TFF system. Procedure:
- Prepare lipid stock in ethanol to a total concentration of 10-20 mM. Prepare mRNA in aqueous buffer at 0.1-0.2 mg/mL.
- Load solutions into separate syringes on syringe pumps. Use equal volumetric flow rates (TR=1:1). Typical total flow rate (TFR) is 10-12 mL/min for rapid mixing.
- Initiate mixing by simultaneously pumping the ethanol and aqueous phases through the SHM chip into a collection vessel. The LNPs form instantaneously upon mixing.
- Dilute the formed LNP suspension immediately with 1X PBS (pH 7.4) at a 1:1 ratio to neutralize the acidic environment and stabilize particles.
- Dialyze against PBS (pH 7.4) for 2 hours at 4°C using a 20kDa MWCO membrane or use Tangential Flow Filtration (TFF) to remove ethanol and exchange buffer.
- Filter sterilize through a 0.22 µm PES membrane. Store at 4°C for short-term use or -80°C for long-term storage.
Protocol 3.2: Critical Quality Attribute (CQA) Assessment
Aim: Characterize the physical and chemical properties of formulated mRNA-LNPs. Methods:
- Particle Size & PDI: Use Dynamic Light Scattering (DLS). Dilute LNPs 1:50 in nuclease-free water. Measure three readings at 25°C. Report Z-average and PDI.
- mRNA Encapsulation Efficiency: a. Method A (Ribogreen Assay): Dilute LNPs 1:100 in Tris-EDTA buffer (TE). Add Ribogreen dye to one aliquot (Total RNA). To a second aliquot, add 0.1% Triton X-100 and Ribogreen (Released RNA). To a third aliquot, add Ribogreen without Triton (Background). Incubate 5 min, protect from light. Measure fluorescence (ex/em ~480/520 nm). Calculate % Encapsulation = [1 - (Released - Background) / (Total - Background)] x 100. b. Method B (SDS/Prot K Digestion): Treat LNP sample with 1% SDS and Proteinase K, incubate at 50°C for 15 min, then quantify RNA by UV-Vis (A260).
- mRNA Integrity: Analyze extracted mRNA by capillary electrophoresis (e.g., Fragment Analyzer, Bioanalyzer). Intact mRNA should show a single sharp peak. Report percentage of full-length RNA.
Visualizing Key Pathways and Workflows
Diagram 1: LNP Cellular Uptake and Endosomal Escape Pathway
Title: LNP Uptake and Endosomal Escape Mechanism
Diagram 2: Microfluidic LNP Formulation Workflow
Title: Microfluidic LNP Production Process
The Scientist's Toolkit: Key Research Reagent Solutions
Table 2: Essential Reagents and Materials for mRNA-LNP Research
| Item / Reagent | Function in LNP Research | Example Vendor/Product Note |
|---|---|---|
| Ionizable Lipids | Critical for mRNA complexation, endosomal escape, and biodegradability. Key structure-function component. | MC3 (Medicinal Chemistry Standard), SM-102, ALC-0315 (Commercial), Lipid 5 (Modern proprietary). |
| PEG-Lipids | Stabilizes LNP surface, controls size, moderates immunogenicity, and influences pharmacokinetics. | DMG-PEG 2000, ALC-0159, DSG-PEG 2000. PEG chain length and lipid anchor are critical variables. |
| Phospholipid | Structural lipid that contributes to bilayer stability and fusogenicity. | DSPC (1,2-distearoyl-sn-glycero-3-phosphocholine) is the clinical standard. DOPE is sometimes used in research. |
| Cholesterol | Enhances bilayer integrity, stability, and modulates membrane fluidity/fusion. | Molecular biology grade. Often used at ~40 mol%. |
| Microfluidic Device | Enables reproducible, scalable, and rapid mixing for LNP formation with low polydispersity. | Dolomite chips, Precision NanoSystems Ignite or NanoAssemblr systems. |
| Ribogreen Assay Kit | Fluorescent quantitation of RNA encapsulation efficiency within LNPs. | Quant-iT RiboGreen RNA Assay Kit (Thermo Fisher). Requires detergent lysis control. |
| In vitro Transcription Kit | For research-scale production of high-quality, capped, and polyadenylated mRNA. | MEGAscript T7 or HiScribe T7 kits. Co-transcriptional capping (e.g., CleanCap) is superior. |
| HepG2 or HEK293 Cells | Standard cell lines for in vitro evaluation of LNP delivery efficiency and protein expression. | HepG2 for hepatocyte tropism studies (ApoE/LDLR pathway). |
| Animal Models | For in vivo biodistribution, efficacy, and toxicity studies of LNPs. | C57BL/6 mice (standard), Sprague-Dawley rats (for patisiran-like studies). |
Step-by-Step LNP-mRNA Formulation Protocols: From Microfluidics to In Vitro Testing
Application Notes
This document details essential pre-formulation protocols within a broader thesis on Lipid Nanoparticle (LNP) formulation for mRNA delivery. The integrity, stability, and compatibility of starting materials—mRNA, lipids, and buffers—are critical determinants of LNP physicochemical characteristics, encapsulation efficiency, and ultimately, in vivo performance.
1. mRNA Preparation: The therapeutic mRNA must be of high purity, integrity, and possess appropriate structural motifs. The 5' cap (e.g., CleanCap) and 3' poly(A) tail are mandatory for stability and translation. Nucleoside modifications (e.g., N1-methylpseudouridine) reduce immunogenicity. Storage as ethanol-precipitated pellets at -80°C is recommended for long-term stability, while short-term use requires nuclease-free buffers at -80°C.
2. Lipid Stock Solutions: The lipid composition (ionizable lipid, phospholipid, cholesterol, PEG-lipid) defines LNP formation, mRNA encapsulation, stability, and cellular delivery. Precise molar ratios are critical. Lipids are typically dissolved in pure ethanol at standardized concentrations (e.g., 50 mM total lipid) to ensure reproducibility in microfluidic mixing. Stock solutions must be stored under inert gas (argon or nitrogen) at -20°C or -80°C to prevent oxidation and hydrolysis.
3. Buffer Considerations: The aqueous buffer (typically citrate or acetate, pH ~4.0) protonates the ionizable lipid, enabling mRNA complexation during LNP formation. Its osmolarity and pH must be tightly controlled. The final diafiltration/buffer exchange into a neutral, isotonic buffer (e.g., Tris-sucrose, PBS) is essential for colloidal stability and in vivo compatibility. All buffers require 0.22 µm filtration and must be nuclease-free.
Protocols
Protocol 1: mRNA Integrity and Purity Assessment
Objective: To verify the concentration, purity, and structural integrity of in vitro transcribed (IVT) mRNA prior to LNP formulation.
Materials:
- Purified mRNA sample
- RNase-free water
- UV-Vis spectrophotometer (e.g., NanoDrop)
- Agarose gel electrophoresis system or Fragment Analyzer/Bioanalyzer
- Denaturing agarose gel (1-2%) or commercial capillary electrophoresis kit
Method:
- Quantification and Purity: Dilute 1-2 µL mRNA in RNase-free water. Measure absorbance at 260 nm (A260) for concentration and ratios A260/A280 (target: ~2.0) and A260/A230 (target: >2.0) for protein/organic contaminant assessment.
- Integrity Analysis: Option A (Agarose Gel): a. Prepare a denaturing (with formaldehyde or glyoxal) 1% agarose gel. b. Load 100-500 ng mRNA per lane alongside an RNA ladder. c. Run at 5-6 V/cm until adequate separation. d. Visualize with ethidium bromide or SYBR Gold stain. Option B (Capillary Electrophoresis): a. Follow manufacturer's protocol (e.g., Agilent RNA Nano Kit). b. Load 1 µL of mRNA sample (~25-500 ng/µL). c. Analyze electropherogram for a single, sharp peak corresponding to the full-length transcript.
Acceptance Criteria: A260/A280 ≥ 1.9; A260/A230 ≥ 2.0; RNA Integrity Number (RIN) or equivalent ≥ 8.5; single band/peak at expected size.
Protocol 2: Preparation of Ethanol Lipid Stock Solutions for Microfluidics
Objective: To prepare stable, homogenous, and accurately concentrated stock solutions of the LNP lipid components in ethanol.
Materials:
- Ionizable lipid (e.g., DLin-MC3-DMA, SM-102)
- Phospholipid (e.g., DSPC)
- Cholesterol
- PEG-lipid (e.g., DMG-PEG2000)
- Anhydrous Ethanol (200 proof, stored over molecular sieves)
- Glass vials with PTFE-lined caps
- Analytical balance (high precision)
- Argon or nitrogen gas supply
- Bath sonicator
Method:
- Weighing: In a controlled, low-humidity environment, accurately weigh each lipid component into a clean, tared glass vial. Record masses.
- Dissolution: Add anhydrous ethanol to achieve the desired final molar concentration for each individual lipid stock (e.g., 50 mM ionizable lipid, 100 mM cholesterol) or a combined "lipid mix" stock at the desired molar ratio. The final total lipid concentration in the ethanol stock should typically be 12.5-50 mM.
- Degassing and Homogenization: Sparge the headspace of the vial with argon/nitrogen for 1 minute to displace oxygen. Seal tightly.
- Sonication: Place the vial in a bath sonicator at 30-40°C for 10-15 minutes or until the solution is clear and homogeneous.
- Storage: Aliquot the stock solution under inert atmosphere into smaller vials. Store at -20°C (for frequent use) or -80°C (long-term) under argon. Avoid repeated freeze-thaw cycles.
Protocol 3: Preparation of Nuclease-Free Acidic and Formulation Buffers
Objective: To prepare filtered, sterile, and nuclease-free aqueous buffer phases for LNP formation and final buffer exchange.
Materials:
- Trisodium citrate dihydrate, Citric acid (or Sodium acetate, Acetic acid)
- Sucrose
- Tris(hydroxymethyl)aminomethane (Tris)
- Sodium chloride (NaCl)
- Diethyl pyrocarbonate (DEPC)-treated or certified nuclease-free water
- pH meter
- 0.22 µm sterile, low-protein-binding filters (PES membrane)
- Vacuum filtration system
Method: Part A: Acidic Complexation Buffer (pH 4.0)
- Prepare 100 mM citrate buffer by dissolving citric acid and trisodium citrate in DEPC-water to achieve pH 4.0 ± 0.05. Verify with pH meter.
- Adjust osmolarity to ~300 mOsm/kg with NaCl or sucrose if needed for isotonicity during mixing.
- Filter buffer through a 0.22 µm PES filter into a sterile, RNase-free container.
Part B: Final Formulation Buffer (e.g., Tris-Sucrose, pH 7.4)
- Prepare 20 mM Tris, 10% (w/v) sucrose buffer. Dissolve Tris and sucrose in DEPC-water.
- Adjust to pH 7.4 ± 0.1 using HCl or NaOH.
- Verify osmolarity (target: ~300 mOsm/kg).
- Filter buffer through a 0.22 µm PES filter into a sterile, RNase-free container.
- Store all buffers at 2-8°C for short-term use (≤1 month).
Data Tables
Table 1: Typical Lipid Composition and Stock Solution Parameters for mRNA LNPs
| Lipid Component | Functional Role | Typical Molar Ratio (%) | Common Stock Conc. in Ethanol | Storage Conditions |
|---|---|---|---|---|
| Ionizable Lipid | mRNA complexation, endosomal escape | 35-50 | 25-50 mM | -80°C, under Argon |
| Phospholipid (e.g., DSPC) | Structural, bilayer integrity | 10-15 | 10-20 mM | -20°C |
| Cholesterol | Membrane fluidity & stability | 38.5-40 | 100 mM | -20°C |
| PEG-Lipid | Surface charge shield, stability | 1.5-2 | 25-50 mM | -80°C, under Argon |
Table 2: Standard Buffer Compositions for LNP Formulation
| Buffer Name | Primary Function | Key Components | Target pH | Target Osmolarity | Storage |
|---|---|---|---|---|---|
| Acidic Complexation Buffer | Protonates ionizable lipid for mRNA loading | 25-50 mM Citrate or Acetate | 4.0 ± 0.1 | ~300 mOsm/kg | 2-8°C, ≤1 month |
| Final Formulation Buffer | Provides colloidal & biological stability | 20 mM Tris, 10% Sucrose (or PBS) | 7.4 ± 0.1 | 290-310 mOsm/kg | 2-8°C, ≤1 month |
| Dilution Buffer (TFF) | Diafiltration/Buffer Exchange | Matching Final Formulation Buffer | 7.4 | Isotonic | 2-8°C |
Diagrams
Title: LNP Pre-Formulation Workflow
Title: Buffer Role in LNP Self-Assembly
The Scientist's Toolkit: Research Reagent Solutions
| Item | Function in Pre-Formulation |
|---|---|
| Nuclease-Free Water | Solvent for all aqueous phases and mRNA resuspension; eliminates RNase contamination. |
| Anhydrous Ethanol (200 proof) | Solvent for lipid stocks; must be dry to prevent lipid hydrolysis. |
| CleanCap AG (3' OMe) | Co-transcriptional capping reagent for producing translation-competent, low-immunogenicity mRNA. |
| N1-Methylpseudouridine-5'-Triphosphate | Modified nucleotide for IVT mRNA; reduces TLR recognition and increases translational yield. |
| Ionizable Lipid (e.g., SM-102) | Key structural/functional lipid; positively charged at low pH to complex mRNA, neutral at physiological pH. |
| DMG-PEG2000 | Polyethylene glycol-lipid conjugate; controls particle size, provides steric stabilization, and reduces opsonization. |
| Sterile PES Syringe Filters (0.22 µm) | For sterilizing and clarifying all buffers and some final LNP formulations. |
| RNaseZap or equivalent | Surface decontaminant to eliminate RNases from labware and work surfaces. |
| TFF Cassette (e.g., 100kDa MWCO) | For tangential flow filtration to exchange LNP buffer and remove unencapsulated mRNA/ethanol. |
| pH/Ion Analyzer | For precise measurement and adjustment of buffer pH, conductivity, and osmolarity. |
Within the thesis "Scalable and Reproducible LNP Formulation for mRNA Delivery," the microfluidic mixing step is identified as the critical determinant of LNP size, polydispersity (PDI), encapsulation efficiency, and ultimately, in vivo transfection potency. This protocol details two gold-standard microfluidic mixing geometries—the T-mixer and the Staggered Herringbone Mixer (SHM)—providing the granularity required for robust, thesis-grade LNP production.
Research Reagent Solutions & Essential Materials
| Item | Function in LNP Formulation |
|---|---|
| Ethanol Phase (Organic) | Contains ionizable lipid, phospholipid, cholesterol, and PEG-lipid dissolved in pure ethanol. The solute carrier phase. |
| Aqueous Phase | Contains mRNA in citrate or acetate buffer (e.g., 10 mM, pH 4.0). The active cargo phase. |
| PBS Buffer (1X, pH 7.4) | Used for dilution/dialysis post-mixing to neutralize lipids and form stable LNPs in physiological buffer. |
| Precision Syringes (e.g., Hamilton) | For accurate, pulse-free delivery of fluid streams. Critical for reproducible Total Flow Rate (TFR) and Flow Rate Ratio (FRR) control. |
| Syringe Pumps | Provide stable, precise pressure-driven flow. Dual-syringe pumps are essential for independent phase control. |
| Microfluidic Chip | PDMS or glass chip with specified mixer architecture (T-mixer or SHM). The core reaction vessel. |
| Tubing & Fittings | PEEK or fluoropolymer tubing with low-dead-volume fittings for fluid delivery to chip. |
Quantitative Comparison of Mixer Performance
Table 1: Characteristic Output Parameters for LNP Formulation (Representative Data)
| Parameter | T-Mixer (Standard) | Staggered Herringbone Mixer (SHM) | Notes |
|---|---|---|---|
| Typical LNP Size Range | 50 - 150 nm | 20 - 100 nm | SHM promotes more rapid mixing. |
| Achievable Polydispersity (PDI) | 0.15 - 0.25 | 0.05 - 0.15 | SHM produces more monodisperse populations. |
| Encapsulation Efficiency | 80 - 95% | >95% | Enhanced mixing improves cargo capture. |
| Optimal Total Flow Rate (TFR) | 1 - 12 mL/min | 1 - 4 mL/min | SHM is efficient at lower TFRs. |
| Critical Mixing Parameter | Reynolds Number (Re) | Herringbone cycle number & TFR | SHM uses chaotic advection. |
| Scalability Path | Linear scale-out (parallelization) | Linear scale-out (parallelization) | Both are scalable via numbered-up architectures. |
Detailed Experimental Protocols
Protocol 1: LNP Formulation Using a T-Mixer
Objective: To formulate mRNA-LNPs using a planar hydrodynamic flow-focusing T-mixer. Materials: Ethanol phase (lipid stock), aqueous mRNA phase (pH 4), T-mixer chip (e.g., 250 µm channel width), syringe pumps, collection vial with PBS buffer.
- Preparation: Load the ethanol phase (lipid) and aqueous phase (mRNA) into separate glass syringes. Attach via tubing to the two inlets of the T-mixer. Place a waste tube or vial at the outlet.
- Priming: Prime each line separately with its respective solvent to remove air bubbles. Ensure confluence at the T-junction is bubble-free.
- Mixing & Formulation: Set syringe pumps to achieve the desired FRR (3:1 aqueous:organic typical) and TFR (start at 4 mL/min). Start pumps simultaneously. The rapid diffusion at the laminar interface upon confluence initiates LNP self-assembly.
- Collection & Dilution: Collect the effluent stream directly into a >10x volume of 1X PBS, pH 7.4, under gentle agitation. This dilutes ethanol and raises pH, stabilizing the LNPs.
- Post-processing: Immediately process LNPs by dialysis or tangential flow filtration against PBS to remove residual ethanol and buffer exchange.
Protocol 2: LNP Formulation Using a Staggered Herringbone Mixer
Objective: To formulate mRNA-LNPs using chaotic advection for superior mixing efficiency. Materials: As in Protocol 1, but with an SHM chip (typically 12-15 herringbone cycles).
- Preparation & Priming: Identical to Protocol 1.
- Mixing & Formulation: Set pumps for desired FRR (3:1 typical). Use a lower TFR (e.g., 2 mL/min) due to enhanced mixing efficiency. The staggered herringbone grooves create chaotic flow, splitting and reorienting fluid streams for complete 3D mixing within ~10-100 ms.
- Collection & Dilution: Identical to Protocol 1. The rapid mixing often yields higher encapsulation efficiency.
- Post-processing: Identical to Protocol 1.
Protocol 3: Characterization of Mixed LNPs (Essential for Thesis Validation)
Size & PDI: Analyze by Dynamic Light Scattering (DLS). Dilute formulated LNP sample 1:50 in PBS, measure triplicates. Encapsulation Efficiency: Use Ribogreen assay. Compare fluorescence of LNPs +/- Triton X-100 detergent. Calculate % mRNA encapsulated. Potency: Perform in vitro transfection on relevant cell line (e.g., HEK293) and measure luciferase or GFP expression 24-48h post-transfection.
Microfluidic Mixing Workflow in LNP Thesis Research
LNP Formulation via Microfluidic Mixing Workflow
Mechanism of Microfluidic LNP Self-Assembly
LNP Self-Assembly Mechanism at Microfluidic Junction
Application Notes
Within the broader thesis on advancing Lipid Nanoparticle (LNP) formulation for mRNA delivery, the shift from microfluidic-based rapid mixing to scalable production methods is critical for clinical translation and commercialization. These alternative methods—bulk mixing, ethanol injection, and in-line techniques—prioritize throughput, reproducibility, and GMP compliance while managing the fundamental challenge of controlled lipid self-assembly and nucleic acid encapsulation.
Bulk Mixing: This method involves the direct combination of aqueous and organic phases in a single vessel under controlled stirring. While operationally simple and capable of large batch sizes, it often results in heterogeneous particle populations with lower encapsulation efficiency due to inconsistent mixing kinetics. Its primary application is in early-stage, large-scale proof-of-concept production where absolute homogeneity is secondary to yield.
Ethanol Injection: A classic method where an ethanolic lipid solution is rapidly injected into a vigorously stirred aqueous buffer containing mRNA. The instantaneous dilution of ethanol promotes LNP formation. Scalability is achieved through controlled injection parameters and mixing dynamics. Recent advances focus on precise temperature and pH control during injection to improve monodispersity and stability, making it suitable for preclinical and some clinical-scale manufacturing.
In-Line Techniques: These represent the most advanced scalable approaches, employing continuous flow systems where aqueous and organic streams meet in a defined mixing zone (e.g., a T-connector, staggered herringbone micromixer, or confined impinging jet mixer). They offer superior control over mixing kinetics (the Reynolds number, Re) and particle characteristics compared to batch methods. In-line techniques are the leading candidate for GMP production of mRNA-LNP therapeutics, enabling continuous manufacturing with real-time monitoring and process analytical technology (PAT) integration.
The selection of a method involves a trade-off between control (size, PDI, encapsulation efficiency) and volumetric throughput. The following table summarizes key comparative data from recent studies (2023-2024):
Table 1: Quantitative Comparison of Scalable LNP Formulation Methods
| Method | Typical Batch Volume | Mean Particle Size (nm) | Polydispersity Index (PDI) | Encapsulation Efficiency (%) | Key Advantage | Key Limitation |
|---|---|---|---|---|---|---|
| Bulk Mixing | 100 mL - 10 L | 80 - 150 | 0.2 - 0.4 | 65 - 85 | Maximum simplicity & volume | High heterogeneity, poor control |
| Ethanol Injection | 10 mL - 5 L | 70 - 120 | 0.15 - 0.25 | 75 - 95 | Good balance of scale & quality | Mixing efficiency depends on injection site |
| In-Line (Continuous) | 1 mL/min - 1 L/min | 60 - 100 | 0.05 - 0.15 | 90 - 99 | Superior control & reproducibility | Higher initial setup complexity |
Detailed Protocols
Protocol 1: Ethanol Injection for Preclinical-Grade mRNA-LNP
Objective: To formulate mRNA-LNPs using scalable ethanol injection for in vivo studies.
Materials: See "The Scientist's Toolkit" below.
Procedure:
- Lipid Stock Preparation: Dissolve ionizable lipid, DSPC, cholesterol, and DMG-PEG₂₀₀₀ in anhydrous ethanol to a total lipid concentration of 10 mM (typical molar ratio 50:10:38.5:1.5). Maintain at 35°C under inert gas.
- Aqueous Phase Preparation: Dilute mRNA in 25 mM sodium acetate buffer (pH 4.0) to a concentration of 0.1 mg/mL. Filter through a 0.22 µm sterile filter.
- Injection and Mixing: Place the aqueous mRNA solution in a jacketed beaker on a magnetic stirrer at 600 rpm, maintaining temperature at 35°C. Using a programmable syringe pump, rapidly inject the ethanolic lipid solution at a flow rate of 1 mL/min (1:3 volumetric ratio organic:aqueous).
- Initial Dilution: Immediately after injection, dilute the formed LNP mixture with 1x PBS (pH 7.4) at a 1:1 volume ratio to reduce ethanol concentration <20%.
- Buffer Exchange & Concentration: Transfer the solution to a tangential flow filtration (TFF) system with a 100 kDa MWCO membrane. Diafilter against 10 volumes of 1x PBS (pH 7.4) to remove ethanol and exchange buffer. Concentrate to the desired final mRNA concentration (e.g., 0.5 mg/mL).
- Sterile Filtration: Filter the final LNP formulation through a 0.22 µm PES syringe filter into a sterile vial.
- Analysis: Determine particle size and PDI by dynamic light scattering, encapsulation efficiency by Ribogreen assay, and mRNA integrity by agarose gel electrophoresis.
Protocol 2: In-Line Continuous Mixing Using a Confined Impinging Jet (CIJ) Mixer
Objective: To produce homogeneous mRNA-LNPs using a continuous, scalable in-line mixing process.
Materials: See "The Scientist's Toolkit" below. Includes a dual-syringe pump system and CIJ mixer.
Procedure:
- Phase Preparation:
- Organic Stream: Prepare lipid mixture in ethanol as in Protocol 1, Step 1.
- Aqueous Stream: Dilute mRNA in citrate buffer (50 mM, pH 3.0) to 0.2 mg/mL. Filter sterilize.
- System Setup: Load the organic and aqueous phases into separate syringes on a dual- or multi-channel syringe pump. Connect each syringe to the CIJ mixer inlet ports using PEEK or PTFE tubing of identical length and inner diameter (e.g., 0.5 mm ID). Connect the mixer outlet to a collection vessel.
- Continuous Formulation: Initiate simultaneous pumping of both phases at defined flow rates. A typical Total Flow Rate (TFR) is 20 mL/min with a 1:3 organic:aqueous flow rate ratio (e.g., 5 mL/min organic, 15 mL/min aqueous). The impingement of jets within the CIJ mixer ensures rapid, turbulent mixing (Re > 2000).
- Instantaneous Dilution & Buffer Exchange: Direct the outlet stream immediately into a reservoir containing 4 volumes of 1x PBS (pH 7.4) under gentle stirring. This quenches particle formation and raises the pH.
- Downstream Processing: Transfer the diluted LNP solution to a TFF system for concentration and buffer exchange into final storage buffer (e.g., PBS-sucrose), as described in Protocol 1, Step 5.
- Process Monitoring: Collect samples from the outlet stream periodically for real-time analysis of size and PDI.
Visualizations
The Scientist's Toolkit: Key Research Reagent Solutions
Table 2: Essential Materials for Scalable LNP Formulation
| Item | Function/Description | Example Product/Catalog |
|---|---|---|
| Ionizable Cationic Lipid | Structurally defines LNP, enables endosomal escape. Critical for efficacy. | SM-102, ALC-0315, DLin-MC3-DMA |
| Helper Lipids | DSPC: Stabilizes bilayer structure.Cholesterol: Modulates membrane fluidity and stability. | 1,2-distearoyl-sn-glycero-3-phosphocholineCholesterol (Pharma Grade) |
| PEGylated Lipid | Provides steric stabilization, controls particle size, and reduces clearance. | DMG-PEG2000, ALC-0159 (PEG2000-DMG) |
| mRNA Construct | The payload; purified, modified (e.g., N1-methylpseudouridine) for stability & translation. | CleanCap modified mRNA |
| Acidic Buffer | Creates protonation gradient for ionizable lipid; crucial for self-assembly. | 25-50 mM Sodium Acetate or Citrate Buffer, pH 3.0-4.0 |
| Dilution/Buffer Exchange Buffer | Quenches particle formation, provides physiological storage conditions. | 1X Phosphate-Buffered Saline (PBS), pH 7.4, ± Sucrose/Trehalose |
| Syringe Pump (Dual-Channel) | Provides precise, pulseless flow of organic and aqueous phases for in-line mixing. | Harvard Apparatus Pumps, NE-1000 Series |
| In-Line Mixer | Engineered device for rapid, continuous mixing of fluid streams. | CIJ Mixer, Microfluidic Staggered Herringbone Mixer (SHM) |
| Tangential Flow Filtration (TFF) System | For efficient buffer exchange, ethanol removal, and concentration of final LNP product. | Repligen KrosFlo System with 100kDa mPES hollow fiber filter |
Application Notes
Within the context of formulating lipid nanoparticles (LNPs) for mRNA delivery, downstream processing is critical for achieving the correct particle characteristics, purity, and stability required for therapeutic efficacy. Following initial formulation via rapid mixing (e.g., microfluidics), the crude LNP mixture contains unencapsulated mRNA, residual solvents, excess lipids, and buffers unsuitable for storage or administration. Dialysis, Tangential Flow Filtration (TFF), and Concentration are the core unit operations to address these issues.
Dialysis is employed for the gentle removal of small molecular weight impurities, such as ethanol from the formulation process, and for buffer exchange into a final storage buffer (e.g., citrate, PBS, Tris-sucrose). It is a diffusion-driven process across a semi-permeable membrane, minimizing shear stress which is crucial for preserving the integrity of delicate LNP structures.
Tangential Flow Filtration (TFF), specifically diafiltration, is the industry-preferred scalable method for efficient buffer exchange and the removal of unencapsulated nucleic acids. Unlike dialysis, the tangential flow minimizes membrane fouling. The selection of molecular weight cut-off (MWCO) is paramount; a 100-300 kDa membrane typically retains LNPs while allowing free mRNA and smaller molecules to pass through. The number of diavolumes (DV) directly dictates purification efficiency.
Concentration is often integrated with TFF to achieve the target particle concentration (e.g., 0.1-1 mg/mL mRNA) for dosing, stability, and analytical characterization. Careful control of transmembrane pressure (TMP) and cross-flow rate during concentration is essential to prevent LNP aggregation or shear-induced degradation.
The success of these steps is quantified by critical quality attributes (CQAs): particle size (PDI), mRNA encapsulation efficiency (%EE), concentration, and buffer composition.
Table 1: Performance Comparison of Downstream Processing Methods for LNPs
| Parameter | Dialysis (Static) | Tangential Flow Filtration (TFF) | Ultracentrifugation |
|---|---|---|---|
| Primary Function | Buffer exchange, solvent removal | Buffer exchange, purification, concentration | Purification, concentration |
| Typical Scale | Lab-scale (µL to mL) | Lab to commercial (mL to 100s L) | Lab-scale (µL to mL) |
| Processing Time | 4-24 hours | 1-4 hours (for 10-15 DV) | 2-6 hours (incl. setup/cleanup) |
| Encapsulation Efficiency (EE) Recovery | High (>95%) | High (95-98%) with optimized TMP | Variable; can cause pellet fusion/ loss |
| Shear Stress Risk | Very Low | Moderate (controlled by TMP/flow) | Very High (during pelleting) |
| Scalability | Poor | Excellent | Poor |
| Key Process Control | Buffer volume ratio, time | TMP, Cross-flow rate, Diavolumes | g-force, time, rotor type |
Table 2: Optimized TFF Parameters for mRNA-LNP Buffer Exchange & Concentration
| Process Step | MWCO | Target TMP | Cross-Flow Rate | Key Outcome Metric |
|---|---|---|---|---|
| Initial Diafiltration (DF) | 100 kDa | 1-3 psi | 60-100 mL/min/㎡ | Removal of >99.9% free mRNA |
| Concentration | 100 kDa | 2-4 psi | 80-120 mL/min/㎡ | Concentrate to target [mRNA] |
| Final DF (Buffer Exchange) | 100 kDa | 1-3 psi | 60-100 mL/min/㎡ | Achieve >99% buffer exchange |
Experimental Protocols
Protocol 1: Dialysis for Lab-Scale LNP Buffer Exchange
Objective: To exchange the formulation buffer (e.g., ethanol-containing) for a final storage buffer (e.g., 1x PBS, pH 7.4) and remove small impurities. Materials: Formulated LNP suspension, dialysis tubing (e.g., 100 kDa MWCO), large-volume dialysis buffer (≥1000x sample volume), stir plate.
- Prepare Dialysis Tubing: Cut tubing to size, activate per manufacturer's instructions, and clamp one end.
- Load Sample: Transfer the crude LNP formulation into the tubing. Remove air bubbles and clamp the top end securely.
- Dialyze: Immerse the sealed dialysis bag in a large reservoir of pre-chilled (4°C) dialysis buffer. Stir gently at 4°C.
- Buffer Exchange: Change the dialysis buffer reservoir at least twice at intervals (e.g., 2, 4, and 16 hours).
- Recover Sample: After total dialysis time (typically 18-24 hours), carefully retrieve the LNP suspension from the tubing. Filter through a 0.22 µm sterile filter if needed.
- Analyze: Measure particle size, PDI, and pH. Quantify ethanol residual via GC if required.
Protocol 2: TFF for Scalable LNP Purification and Concentration
Objective: To concentrate and diafilter LNP formulations into a final buffer, removing unencapsulated mRNA and residual solvents. Materials: TFF system (peristaltic or cassette system), 100 kDa MWCO Pellicon or similar cassette, pressure gauges, formulation and diafiltration buffers.
- System Preparation: Flush the TFF system and cassette with WFI (Water for Injection), followed by equilibration with 3-5 DV of diafiltration buffer. Ensure all lines are purged of air.
- Load & Prime: Load the crude LNP sample into the feed reservoir. Start the pump at a low cross-flow rate to prime the system without applying pressure.
- Initial Concentration (Optional): Increase cross-flow to target (e.g., 80 mL/min/㎡). Slowly close the permeate line to increase TMP to 2-4 psi. Concentrate the sample to ~1/3 of its initial volume.
- Diafiltration: Initiate diafiltration by adding diafiltration buffer to the feed reservoir at the same rate as permeate generation (constant volume). Continue for 10-15 DV to ensure complete buffer exchange and purification.
- Final Concentration: Stop buffer addition. Continue filtration to concentrate the retentate to the desired final mRNA concentration.
- Flush & Recover: Reduce TMP to ~1 psi. Use a small volume (~1 DV) of final buffer to flush the retentate line and recover the maximum product yield into a collection vessel.
- Clean-in-Place (CIP): Immediately flush system with WFI, then 0.1-0.5M NaOH, followed by WFI again for storage.
Visualization
TFF-Based mRNA-LNP Purification Workflow
TFF Parameter Impact on LNP Quality
The Scientist's Toolkit: Research Reagent Solutions
Table 3: Essential Materials for LNP Downstream Processing
| Item | Function & Relevance | Example Product/Criteria |
|---|---|---|
| Dialysis Tubing/Cassettes | Semi-permeable membrane for diffusion-based buffer exchange; MWCO choice (e.g., 20-300 kDa) is critical for LNP retention. | Spectra/Por membranes, Slide-A-Lyzer cassettes. |
| TFF Cassette/Module | Hollow fiber or flat sheet cartridge for scalable, controlled purification. MWCO (100-300 kDa) must retain LNPs while passing impurities. | Pellicon cassettes (Merck), mPES hollow fibers (Repligen). |
| Final Formulation Buffer | Stabilizes LNPs for long-term storage; typically contains cryoprotectants (sucrose) and buffers (Tris, citrate). | 10 mM Tris, 10% sucrose, pH 7.4. |
| Process Pressure Monitors | Gauges to monitor TMP and inlet/outlet pressure; essential for optimizing TFF and preventing membrane damage/aggregation. | In-line analog or digital pressure sensors. |
| Sterile Filtration Unit | 0.22 µm PES or PVDF membrane syringe filter for final sterile filtration of the LNP product before vialing. | Millex-GV PVDF filters. |
| Nucleic Acid Quantitation Assay | Fluorescent dye-based assay to quantify total and free mRNA, enabling calculation of encapsulation efficiency post-processing. | Quant-iT RiboGreen assay. |
Sterile Filtration and Aseptic Handling for In Vivo Applications
Within the broader thesis on Lipid Nanoparticle (LNP) formulation for mRNA delivery, the transition from in vitro characterization to in vivo evaluation presents a critical juncture. The sterility and apyrogenicity of the final mRNA-LNP product are non-negotiable prerequisites for animal studies and eventual clinical translation. Contaminants can induce severe immune responses, confounding experimental results and posing significant safety risks. This application note details current, rigorous protocols for sterile filtration and aseptic handling tailored specifically to the sensitive nature of mRNA-LNP complexes, ensuring the integrity of both the formulation and the subsequent in vivo data.
Key Considerations for mRNA-LNP Filtration
mRNA-LNP formulations present unique challenges: the particles are relatively large (typically 70-120 nm), sensitive to shear stress, and can interact with filter materials. The primary goal is to remove microbial contaminants (bacteria, fungi) without significant loss of product, alteration of particle size, or disruption of the lipid bilayer.
Table 1: Comparative Analysis of Common Sterile Filtration Methods for mRNA-LNPs
| Filtration Method | Pore Size | Typical LNP Recovery Yield | Key Advantages | Primary Risks/Considerations |
|---|---|---|---|---|
| Polyethersulfone (PES) | 0.22 µm | 85-95% | Low protein binding, high flow rates, high throughput. | Potential for nonspecific LNP adsorption; requires pre-wetting. |
| Hydrophilic PVDF | 0.22 µm | 90-98% | Low adsorption, high chemical compatibility. | Slightly higher cost; ensures minimal lipid loss. |
| Cellulose Acetate | 0.22 µm | 80-90% | Low adsorption, good for shear-sensitive products. | Lower flow rates; less robust mechanically. |
| Asymmetric PES | 0.22 µm | 92-97% | Graded pore structure reduces fouling, high recovery. | Optimal for polydisperse LNP populations. |
Detailed Protocols
Protocol 1: Sterile Filtration of mRNA-LNP Formulations
Objective: To render a bulk mRNA-LNP formulation sterile for in vivo administration without compromising physicochemical properties.
Materials:
- mRNA-LNP suspension (post-dialysis or TFF)
- Sterile, low-protein-binding syringe filters (e.g., hydrophilic PVDF, 0.22 µm, 33 mm diameter)
- Sterile syringes (10-60 mL, Luer-Lok)
- Sterile collection vial (e.g., glass vial, cryovial)
- Laminar flow hood (Class II A2 or BSC)
- Particle size analyzer (e.g., DLS) for QC check
Procedure:
- Aseptic Setup: Perform all steps inside a validated laminar flow hood. Wipe down all surfaces, materials, and gloves with 70% ethanol.
- Filter Priming: Aseptically attach a sterile syringe to the filter unit. Draw 1-2 mL of sterile, particle-free buffer (e.g., 1 mM Tris-HCl, pH 7.4) through the filter to wet the membrane and minimize initial product adsorption. Discard the priming buffer.
- Sample Filtration:
- Draw the mRNA-LNP suspension into a new sterile syringe. Avoid introducing air bubbles.
- Attach the syringe to the pre-primed filter unit.
- Apply gentle, steady pressure to the syringe plunger. Do not exceed 30 psi. The flow should be smooth and continuous.
- Collect the filtrate directly into a sterile, labeled collection vial.
- Post-Filtration Quality Control:
- Immediately analyze the filtrate for critical quality attributes (CQAs):
- Particle Size & PDI: Via DLS. A significant shift (>5 nm) or increase in PDI (>0.05) may indicate aggregation or filter interaction.
- Concentration: Measure RNA concentration via UV-Vis (A260) or fluorometric assay to calculate recovery yield.
- Sterility Test: Aliquot a portion for microbial culture test (USP <71> or equivalent).
- Immediately analyze the filtrate for critical quality attributes (CQAs):
- Documentation: Record filter type, lot number, pressure applied, volume processed, recovery yield, and post-filtration CQAs.
Protocol 2: Aseptic Handling and Aliquotting forIn VivoDosing
Objective: To maintain sterility during the preparation of individual doses for animal injection.
Materials:
- Sterile-filtered mRNA-LNP bulk solution
- Sterile microcentrifuge tubes (e.g., 1.5 mL) or glass vials
- Sterile pipette tips with aerosol barriers
- Positive displacement pipettes or automated liquid handler (optional)
- Refrigerated centrifuge (for post-thaw spin-down if frozen)
- Cold block or chilled rack
Procedure:
- Workspace Decontamination: UV-irradiate the biosafety cabinet (BSC) for 30 minutes prior to use. Clean surfaces with 70% ethanol and isopropyl alcohol.
- Material Transfer: Place the sterile bulk vial and all sterile receptacles inside the BSC. Arrange tools to minimize crossing over open containers.
- Aliquotting:
- Gently mix the bulk solution by inverting the vial 5-10 times. Do not vortex.
- Using sterile technique, draw the required volume for each dose + 5-10% overage using a sterile pipette.
- Dispense into individual, labeled sterile vials. Cap each vial immediately after filling.
- If the formulation is to be frozen, snap-freeze aliquots in liquid nitrogen or a -80°C ethanol bath before transferring to a -80°C freezer.
- Thawing for Use: Thaw frozen aliquots rapidly in a 25°C water bath until just ice-free. Immediately place on a cold block. Centrifuge briefly (e.g., 2000 x g, 1 min, 4°C) in a pre-cooled centrifuge to collect condensation before opening.
- In-Use Stability: Once an aliquot is pierced, use it immediately for dosing. Do not re-freeze or store punctured vials.
The Scientist's Toolkit: Essential Reagent Solutions
Table 2: Key Research Reagent Solutions for Sterile mRNA-LNP Processing
| Item | Function & Importance | Example Product/Brand |
|---|---|---|
| Sterile, Low-Binding Filters | Removes microorganisms while maximizing LNP recovery. Hydrophilic PVDF is often ideal. | Millex-GV (PVDF), Whatman Puradisc (PES) |
| Particle-Free Buffers | For dilution, priming filters, or as controls. Must be sterile-filtered (0.1 µm) to avoid background in DLS/NTA. | DPBS, Tris-HCl, sterile sucrose solutions |
| Aseptic Validation Indicators | Biological (liquid culture) and chemical (LAL) tests to confirm sterility and low endotoxin levels (<0.1 EU/mL). | Tryptic Soy Broth, Limulus Amebocyte Lysate (LAL) assay kits |
| Single-Use, Sterile Assemblies | Pre-assembled tubing, connectors, and syringes for closed-system processing, reducing contamination risk. | Corning Centrifugal Filter Units, C-Pak assemblies |
| Low-Adhesion Microtubes | For aliquot storage; minimize LNPs sticking to vial walls, preserving dose accuracy. | Protein LoBind tubes, Axygen Maxymum Recovery tubes |
Experimental Workflow and Pathway Visualization
Sterile mRNA-LNP Prep for In Vivo Dosing Workflow
Impact of Failed Sterility on In Vivo Study Outcomes
Within the broader thesis on lipid nanoparticle (LNP) formulation for mRNA delivery, the primary in vitro characterization of size, polydispersity index (PDI), and zeta potential is critical. These parameters dictate the stability, biodistribution, cellular uptake, and overall efficacy of the mRNA-LNP therapeutic. This application note provides detailed protocols for the dynamic light scattering (DLS) and electrophoretic light scattering (ELS) measurements essential for robust LNP characterization.
Key Parameters and Their Significance
Table 1: Key Characterization Parameters and Their Implications for LNPs
| Parameter | Ideal Range for mRNA-LNPs | Measurement Technique | Physiological & Formulation Implication |
|---|---|---|---|
| Hydrodynamic Diameter | 70-150 nm | Dynamic Light Scattering (DLS) | Impacts systemic circulation, cellular uptake, and biodistribution. Smaller particles (<100 nm) favor tissue penetration. |
| Polydispersity Index (PDI) | < 0.2 | Dynamic Light Scattering (DLS) | Indicates sample homogeneity. PDI < 0.2 is considered monodisperse and critical for batch reproducibility and predictable in vivo behavior. |
| Zeta Potential | Slightly negative to mildly positive (±5 to +15 mV) | Electrophoretic Light Scattering (ELS) | Surface charge influencing colloidal stability (via electrostatic repulsion) and interactions with cell membranes and serum proteins. |
Detailed Experimental Protocols
Protocol 1: Sample Preparation for DLS and Zeta Potential Measurements
Objective: To prepare a stable, contaminant-free LNP sample suitable for light scattering analysis.
Materials & Reagents:
- Purified LNP formulation.
- Appropriate buffer (e.g., 1 mM KCl for zeta potential, PBS or HEPES for size). Note: For zeta potential, low ionic strength buffers (< 10 mM) are preferred.
- Disposable, low-protein-binding syringe filters (0.22 µm or 0.45 µm pore size).
- Clean, disposable sizing cuvettes and zeta potential folded capillary cells.
Procedure:
- Dilution: Thaw or resuspend the LNP sample gently (avoid vortexing). Dilute the sample in the appropriate pre-filtered buffer to achieve a final particle concentration suitable for the instrument (typically 0.1-0.5 mg/mL lipid). Optimal scattering intensity is key.
- Filtration/Clarification: Gently pass the diluted sample through a 0.22 µm or 0.45 µm syringe filter into a clean vial to remove dust and large aggregates. This step is critical for reliable DLS measurements.
- Loading: Using a clean pipette, load the filtered sample into a disposable sizing cuvette for DLS. For zeta potential, carefully inject the sample into a folded capillary cell via syringe, avoiding bubble formation.
Protocol 2: Dynamic Light Scattering (DLS) for Size and PDI Measurement
Objective: To determine the intensity-weighted mean hydrodynamic diameter (Z-Average) and the PDI of the LNP sample.
Instrument: Malvern Zetasizer Nano ZS or equivalent.
Procedure:
- Equilibration: Allow the loaded cuvette to thermally equilibrate in the instrument at the set temperature (typically 25°C) for 2 minutes.
- Measurement Setup: In the software, select the material properties (refractive index ~1.45, absorption ~0.001 for lipids). Set the measurement angle to 173° (backscatter, NIBS default) to minimize multiple scattering.
- Run Measurement: Perform a minimum of 3-13 sequential measurements per sample, with an automatic measurement duration.
- Data Analysis: The software calculates the Z-Average size (d.nm) and the PDI from the autocorrelation function using the Cumulants analysis. Review the correlation function and size distribution plot. A single, smooth peak in the intensity distribution indicates a monodisperse sample.
- Validation: Ensure the count rate (scattering intensity) is stable and within the instrument's optimal range. Report the Z-Average ± standard deviation and mean PDI from at least three independent sample preparations.
Protocol 3: Electrophoretic Light Scattering (ELS) for Zeta Potential Measurement
Objective: To determine the surface charge (zeta potential) of LNPs via their electrophoretic mobility.
Instrument: Malvern Zetasizer Nano ZS or equivalent.
Procedure:
- Cell Loading: Ensure the folded capillary cell is clean and correctly oriented (electrodes aligned). Load the prepared sample carefully to avoid bubbles.
- Measurement Setup: Input the solvent properties (viscosity, dielectric constant, refractive index) for the buffer used. Set the temperature to 25°C.
- Voltage Optimization: Use the software's "Zeta Potential Measurement Assistant" to determine the optimal voltage for the measurement.
- Run Measurement: Perform a minimum of 3-12 runs per sample. The instrument applies an electric field, and the velocity of the moving particles (electrophoretic mobility) is measured via laser Doppler velocimetry.
- Data Analysis: The software converts the electrophoretic mobility to zeta potential (mV) using the Henry equation and the Smoluchowski approximation. Report the mean zeta potential ± standard deviation from at least three independent sample preparations.
The Scientist's Toolkit
Table 2: Essential Research Reagent Solutions for LNP Characterization
| Item | Function/Benefit | Key Considerations for mRNA-LNPs |
|---|---|---|
| Zetasizer Nano ZS (or equivalent) | Integrated system for DLS (size, PDI) and ELS (zeta potential) measurements. | Gold standard for nanoparticle characterization. Enables measurement in high-conductivity buffers with M3-PALS technology. |
| Disposable Sizing Cuvettes | Low-volume, single-use cells for DLS measurements. | Prevents cross-contamination between samples. Essential for reproducible size measurements. |
| DTS1070 Folded Capillary Cells | Disposable cells for zeta potential measurements. | Features gold-plated electrodes. Eliminates cleaning issues and ensures consistent electrode performance. |
| 1 mM KCl Solution | Standard, low-conductivity electrolyte for zeta potential measurements. | Minimizes ion shielding of surface charge, providing a stable and readable measurement of the true zeta potential. |
| 0.22 µm PES Syringe Filters | For sample clarification prior to DLS. | Removes dust and large aggregates that can skew DLS results. Polyethersulfone (PES) membrane is low-binding for lipids. |
Workflow and Data Interpretation Diagrams
Title: LNP Physicochemical Characterization Workflow
Title: Data Interpretation Decision Matrix
The systematic application of DLS and ELS protocols outlined here provides the foundational characterization data required for any thesis on mRNA-LNP formulation. Consistent measurement of size, PDI, and zeta potential is non-negotiable for establishing robust structure-activity relationships, ensuring batch-to-batch reproducibility, and predicting the in vivo performance of novel LNP delivery systems.
Solving LNP-mRNA Challenges: A Troubleshooting Guide for Encapsulation, Stability, and Scalability
Application Notes: LNP-mRNA Formulation Challenges
This document outlines critical challenges encountered during lipid nanoparticle (LNP) formulation for mRNA delivery, providing context for a broader thesis on optimizing reproducible, clinical-grade protocols. The instability of mRNA and the complex physicochemical nature of LNPs necessitate precise control over formulation parameters to ensure efficacy, stability, and safety.
Aggregation of Lipid Nanoparticles
Aggregation compromises colloidal stability, increases particle heterogeneity, and can lead to capillary occlusion upon administration. It is primarily driven by insufficient surface charge (zeta potential), inadequate steric stabilization (e.g., from PEG-lipids), and improper buffer excipients.
Key Quantitative Data on Aggregation Triggers: Table 1: Common Formulation Conditions Leading to Aggregation
| Condition | Typical Range Promoting Aggregation | Mechanism |
|---|---|---|
| Ionic Strength | > 150 mM NaCl | Screens electrostatic repulsion |
| pH | Near lipid pKa (e.g., 4.0-6.5 for ionizable lipids) | Reduces net charge on particles |
| PEG-lipid Mol % | < 1.5% | Insufficient steric barrier |
| Buffer Type | Citrate (divalent anions) | Can bridge particle surfaces |
| Freeze-Thaw | Without cryoprotectants | Ice crystal formation & particle fusion |
Low Encapsulation Efficiency (EE%)
Low EE% results in wasted mRNA payload, increased cost, and potential immunogenicity from free mRNA. It is influenced by the kinetics of LNP self-assembly and the efficiency of mRNA entrapment within the internal aqueous core.
Key Quantitative Data on Factors Affecting EE%: Table 2: Impact of Formulation Parameters on mRNA Encapsulation Efficiency
| Parameter | Optimal Range for High EE% (>90%) | Effect on EE% |
|---|---|---|
| N/P Ratio (amine to phosphate) | 3:1 to 6:1 | Maximizes charge-driven condensation |
| Flow Rate Ratio (FRR) | 3:1 (aq:eth) | Controls mixing kinetics & particle size |
| Total Lipid Concentration | 5-10 mM | Provides sufficient lipid for complete entrapment |
| mRNA Concentration | 0.05-0.2 mg/mL | Avoids saturation of lipid capacity |
| Ionizable Lipid pKa | 6.0 - 6.8 | Facilitates protonation at low pH for mRNA complexation |
Rapid mRNA Degradation
mRNA integrity is critical for protein expression. Degradation can occur enzymatically, chemically (hydrolysis), or via oxidative stress, both before and after encapsulation.
Key Quantitative Data on mRNA Stability: Table 3: Major Causes of mRNA Degradation in LNP Formulations
| Degradation Pathway | Critical Control Points | Stability Target |
|---|---|---|
| Ribonuclease (RNase) Contamination | Use of RNase-free reagents, environment, & consumables | No detectable RNase activity |
| Hydrolytic Degradation | Formulation pH 6.5-7.4; avoid long-term storage in liquid state at > -20°C | >80% intact mRNA after 3mo at -80°C |
| Oxidative Degradation | Use of antioxidants (e.g., EDTA); inert gas headspace (N2) during storage | Maintains mRNA activity post-lyophilization |
Detailed Experimental Protocols
Protocol 1: Assessing and Mitigating Aggregation
Aim: Quantify particle aggregation and identify root causes. Materials: Formulated LNPs, PBS pH 7.4, DLS/Zetasizer, 0.22 µm filter. Procedure:
- Dilution: Dilute LNP sample 1:100 in 1x PBS (pre-filtered, 0.22 µm).
- DLS Measurement: Load sample into cuvette. Measure hydrodynamic diameter (Z-avg) and PDI at 25°C, performing ≥3 runs.
- Size Trend Analysis: Incubate LNPs at 4°C, 25°C, and 37°C. Measure diameter at 0, 24, 48, and 72 hours.
- Mitigation Test: If aggregation (increased size & PDI >0.25) is observed: a. Add sterile sucrose to final 10% (w/v) as cryoprotectant. b. Adjust PEG-lipid content from 1.0% to 2.0% molar ratio in formulation. c. Filter LNPs through a 0.22 µm sterile filter (if size <200 nm).
- Validation: Re-measure size and PDI post-mitigation. Successful mitigation yields PDI <0.2 and stable size over 72h.
Protocol 2: Quantifying mRNA Encapsulation Efficiency
Aim: Precisely determine the percentage of mRNA encapsulated within LNPs. Materials: LNPs, SYBR Gold dye, Triton X-100, RNase-free tubes, plate reader. Procedure:
- Prepare Dye Solution: Dilute SYBR Gold 1:10,000 in TE buffer (RNase-free).
- Create Standards: Dilute unencapsulated mRNA standard (same batch as in LNPs) in TE buffer to 0, 25, 50, 100, 200 ng/mL.
- Prepare Samples:
- Total mRNA (A): Dilute LNPs 1:100 in TE buffer with 1% Triton X-100. Incubate 15 min to lyse particles.
- Free mRNA (B): Dilute LNPs 1:100 in TE buffer alone. Centrifuge at 14,000 x g for 10 min. Carefully take supernatant.
- Assay: Mix 50 µL of each standard/sample with 50 µL SYBR Gold dye in black 96-well plate. Incubate 10 min protected from light.
- Measurement: Read fluorescence (ex/em: 495/537 nm). Generate standard curve.
- Calculation:
Total mRNA (from A) = [mRNA] from standard curve x dilution factorFree mRNA (from B) = [mRNA] from standard curve x dilution factorEE% = [(Total - Free) / Total] x 100
Protocol 3: Monitoring mRNA Integrity Within LNPs
Aim: Assess chemical integrity of encapsulated mRNA over time. Materials: LNPs, Proteinase K, TRIzol LS, Chloroform, Isopropanol, Bioanalyzer RNA Pico Chip. Procedure:
- mRNA Extraction: a. Treat LNPs (200 µL) with Proteinase K (2 µL, 20 mg/mL) for 15 min at 37°C to degrade lipid/protein. b. Add 750 µL TRIzol LS, vortex. Incubate 5 min. c. Add 200 µL chloroform, shake vigorously, incubate 3 min. d. Centrifuge at 12,000 x g, 15 min, 4°C. e. Transfer aqueous phase. Add 500 µL isopropanol, incubate 10 min. f. Centrifuge at 12,000 x g, 10 min, 4°C. Wash pellet with 75% ethanol. g. Air dry, resuspend in RNase-free water.
- Analysis: Run extracted mRNA on Agilent Bioanalyzer using RNA Pico Chip per manufacturer's instructions.
- Quantification: The percentage of intact mRNA is calculated as the area of the peak corresponding to the full-length mRNA (e.g., ~1000-5000 nt) divided by the total area of all RNA peaks.
Visualizations
Diagram 1: LNP-mRNA Formulation Pitfalls & Solution Pathways (84 chars)
Diagram 2: Standard LNP-mRNA Formulation Workflow (72 chars)
The Scientist's Toolkit: Research Reagent Solutions
Table 4: Essential Materials for LNP-mRNA Formulation & Analysis
| Item | Function & Rationale | Example/Target Specification |
|---|---|---|
| Ionizable Cationic Lipid | Key structural/functional component; binds and condenses mRNA via electrostatic interaction at low pH. | DLin-MC3-DMA (Onpattro), SM-102 (Spikevax), ALC-0315 (Comirnaty). |
| PEG-lipid (PEG-DMG) | Provides steric stabilization, controls particle size, and prevents aggregation. Short half-life aids cellular uptake. | DMG-PEG2000 at 1.5-2.5 mol%. |
| Cholesterol | Enhances structural integrity and stability of the LNP bilayer; promotes membrane fusion. | Pharmaceutical grade, >99% purity. |
| Phospholipid (Helper) | Supports bilayer structure and fluidity. DOPE often used for its fusogenic properties. | DSPC or DOPE. |
| Microfluidic Device | Enables rapid, reproducible mixing of lipid and aqueous phases via laminar flow, creating homogeneous LNPs. | NanoAssemblr, staggered herringbone mixer chip. |
| SYBR Gold Nucleic Acid Gel Stain | Ultra-sensitive fluorescent dye for quantifying free vs. total mRNA in encapsulation efficiency assays. | High signal-to-noise vs. ethidium bromide. |
| Tangential Flow Filtration (TFF) System | For efficient buffer exchange (dialysis) and concentration of LNP formulations post-mixing. | 100-500 kDa MWCO membranes. |
| Dynamic Light Scattering (DLS) Instrument | Measures hydrodynamic diameter, polydispersity index (PDI), and zeta potential of LNPs. | Z-average diameter, PDI <0.2 ideal. |
| Agilent Bioanalyzer | Capillary electrophoresis system for assessing mRNA integrity (RNA Integrity Number equivalent) with high sensitivity. | RNA Pico Chip for low concentration samples. |
Optimizing the N/P Ratio and Lipid-to-mRNA Ratio for Maximum Performance
1. Introduction & Thesis Context Within the broader thesis on advancing Lipid Nanoparticle (LNP) formulation for mRNA delivery, the optimization of two critical formulation parameters—the Nitrogen-to-Phosphate (N/P) ratio and the total lipid-to-mRNA weight ratio—is foundational. These ratios directly dictate the efficiency of mRNA complexation/encapsulation, the physicochemical properties of the resulting LNPs (size, charge, stability), and ultimately, in vitro and in vivo transfection performance. This application note provides detailed protocols and data for systematically optimizing these ratios to achieve maximum mRNA delivery efficacy.
2. Key Concepts & Quantitative Data Summary
Table 1: Impact of N/P and Lipid-to-mRNA Ratios on LNP Characteristics
| Parameter | Typical Optimization Range | Key Influence on LNP Properties | Optimal Range for in vivo mRNA Delivery |
|---|---|---|---|
| N/P Ratio (Ionizable lipid amines : mRNA phosphates) | 3:1 to 12:1 | mRNA encapsulation efficiency, particle stability, surface charge (pKa), endosomal escape. | 4:1 to 8:1 (Balances encapsulation & tolerability) |
| Total Lipid-to-mRNA Ratio (wt:wt) | 10:1 to 50:1 | Particle size, polydispersity, lipid bilayer structure, potency, and in vivo clearance. | 20:1 to 30:1 (Common for IV administration) |
| Resulting Encapsulation Efficiency (%) | 70% - >95% | Directly correlates with N/P ratio up to a saturation point. | >90% (Target for most applications) |
| Resulting Particle Size (nm) | 60 - 150 nm | Primarily controlled by lipid ratio, mixing conditions, and total flow rate. | 70 - 100 nm (For systemic targeting) |
| Resulting Zeta Potential (mV) | -10 to +5 (near neutral) | Low surface charge reduces nonspecific interactions and improves stability. | -5 to +2 mV (Stealth characteristic) |
3. Experimental Protocols
Protocol 3.1: High-Throughput Microfluidic Formulation Screening Objective: Systematically generate LNPs across a matrix of N/P and lipid-to-mRNA ratios.
- Materials: Ionizable lipid (e.g., DLin-MC3-DMA), phospholipid (DSPC), cholesterol, PEG-lipid (DMG-PEG2000), mRNA (cleanCap GFP mRNA), 1x PBS pH 7.4, acetic acid buffer (25 mM, pH 4.0), microfluidic mixer (e.g., NanoAssemblr), syringes.
- Method:
- Prepare Lipid Stock in Ethanol: Combine ionizable lipid, DSPC, cholesterol, and PEG-lipid at a defined molar ratio (e.g., 50:10:38.5:1.5) in absolute ethanol. Adjust the total lipid concentration to vary the lipid-to-mRNA ratio.
- Prepare mRNA Solution: Dilute mRNA to 0.1 mg/mL in 25 mM acetate buffer, pH 4.0.
- Microfluidic Mixing: Load the lipid-ethanol solution and the mRNA aqueous solution into separate syringes. Set the total flow rate (TFR) to 12 mL/min and a flow rate ratio (FRR, aqueous:ethanol) of 3:1. Initiate simultaneous mixing in the microfluidic cartridge.
- Formulation Array: Repeat Step 3, varying the initial lipid stock concentration to achieve lipid-to-mRNA ratios of 10:1, 20:1, 30:1, and 40:1 (wt:wt). For each lipid ratio, adjust the amount of ionizable lipid to achieve N/P ratios of 3, 6, and 9.
- Buffer Exchange & Filtration: Immediately dilute the formed LNPs 1:1 with 1x PBS. Dialyze against 1x PBS (pH 7.4) for 2 hours using a 20kD MWCO cassette or perform tangential flow filtration. Sterile-filter through a 0.22 µm PES membrane.
Protocol 3.2: Analytical Characterization of Formulated LNPs
- A. Encapsulation Efficiency (RiboGreen Assay):
- Dilute LNPs 100-fold in either TE buffer (for total mRNA) or TE buffer with 0.5% Triton X-100 (for unencapsulated mRNA).
- Add Quant-iT RiboGreen reagent to each sample and incubate for 5 mins.
- Measure fluorescence (ex/em ~480/520 nm). Calculate % Encapsulation = [1 - (Unencapsulated Fluorescence / Total Fluorescence)] x 100.
- B. Particle Size and Zeta Potential (DLS):
- Dilute LNP samples 1:50 in 1 mM KCl.
- Measure hydrodynamic diameter (Z-average) and PDI via Dynamic Light Scattering.
- Measure zeta potential using Laser Doppler Micro-electrophoresis.
Protocol 3.3: In Vitro Potency Assessment
- Cell Culture & Transfection:
- Seed HEK293 or HeLa cells in a 96-well plate at 20,000 cells/well.
- After 24h, treat cells with LNP formulations (normalized to 50 ng mRNA/well) in serum-free medium.
- After 4h, replace with complete medium.
- Analysis (GFP mRNA Reporter):
- At 24h post-transfection, harvest cells and analyze GFP expression via flow cytometry.
- Report results as % GFP-positive cells and mean fluorescence intensity (MFI).
4. Visualization of Workflow and Relationship
Title: LNP Optimization and Testing Workflow
Title: Interplay of Formulation Ratios on LNP Traits
5. The Scientist's Toolkit: Key Research Reagent Solutions
Table 2: Essential Materials for LNP Ratio Optimization
| Item | Function & Rationale | Example Product/Catalog |
|---|---|---|
| Ionizable Cationic Lipid | Critical for mRNA complexation via electrostatic interaction at low pH; its pKa dictates endosomal escape. Key component for N/P ratio. | DLin-MC3-DMA (MedChemExpress, HY-130026) |
| mRNA Construct | The payload; purity and integrity are critical for consistent encapsulation and activity. | cleanCap GFP mRNA (TriLink BioTechnologies, L-7601) |
| Microfluidic Mixer | Enables reproducible, rapid mixing for consistent LNP generation at small scales for screening. | NanoAssemblr Ignite (Precision NanoSystems) |
| RiboGreen Assay Kit | Fluorescent nucleic acid stain for sensitive, quantitative determination of mRNA encapsulation efficiency. | Quant-iT RiboGreen (Thermo Fisher, R11490) |
| Dynamic Light Scattering (DLS) Instrument | Measures hydrodynamic particle size, polydispersity index (PDI), and zeta potential. | Zetasizer Ultra (Malvern Panalytical) |
| PEG-lipid (PEG-DMG) | Stabilizes LNP surface, controls size, reduces aggregation, and modulates pharmacokinetics. | ALC-0159 (Avanti Polar Lipids, 880151P) |
| Size Exclusion Chromatography Columns | For purifying formulated LNPs from unencapsulated mRNA and free lipids. | Sepharose CL-4B (Cytiva, 17015001) |
1. Introduction
This application note, framed within a broader thesis on lipid nanoparticle (LNP) formulation for mRNA delivery, details the critical interplay between process parameters in microfluidic mixing. The precise encapsulation of nucleic acids within LNPs is governed by the self-assembly process during mixing, which is directly controlled by the Flow Rate Ratio (FRR) of aqueous to organic phases, the Total Flow Rate (TFR), and the resultant mixing efficiency. These parameters dictate particle size, polydispersity (PDI), encapsulation efficiency (EE%), and ultimately, the potency and stability of the final mRNA therapeutic. This document provides standardized protocols for systematic optimization.
2. Quantitative Data Summary
Table 1: Impact of Process Parameters on LNP Critical Quality Attributes (CQAs)
| Parameter | Typical Range | Effect on Particle Size | Effect on PDI | Effect on EE% | Primary Mechanistic Influence |
|---|---|---|---|---|---|
| FRR (Aq:Org) | 1:1 to 5:1 | Decreases with increasing FRR | Optimized at mid-range; increases at extremes | Peaks at optimal FRR (often 3:1) | Controls lipid concentration at mixing interface, nucleation rate. |
| TFR (mL/min) | 1 - 20 mL/min | Decreases with increasing TFR | Decreases with increasing TFR (to a point) | Generally increases with TFR | Governs Reynolds number, turbulence, and mixing time (τ_mix). |
| Mixing Efficiency | Laminar to Turbulent | Lower efficiency yields larger particles. | Lower efficiency yields higher PDI. | Critical for high EE%; poor mixing leads to loss. | Determines homogeneity of solvent displacement and lipid self-assembly. |
Table 2: Example Optimization Dataset from Recent Literature (Simulated Chip, 100 nm Target)
| Exp. ID | FRR (Aq:Org) | TFR (mL/min) | Estimated τ_mix (ms) | Size (nm) | PDI | EE% |
|---|---|---|---|---|---|---|
| OPT-01 | 1:1 | 5 | ~10 | 135 ± 8 | 0.22 | 85% |
| OPT-02 | 3:1 | 5 | ~10 | 102 ± 5 | 0.08 | 97% |
| OPT-03 | 5:1 | 5 | ~10 | 88 ± 4 | 0.12 | 92% |
| OPT-04 | 3:1 | 2 | ~25 | 115 ± 12 | 0.18 | 90% |
| OPT-05 | 3:1 | 12 | ~4 | 95 ± 3 | 0.05 | 98% |
3. Experimental Protocols
Protocol 3.1: Systematic Screening of FRR and TFR Objective: To map the design space for FRR and TFR and identify the optimal window for target LNP CQAs. Materials: See "The Scientist's Toolkit" (Section 5). Procedure:
- Preparation: Prepare the organic phase (lipids in ethanol) and aqueous phase (mRNA in citrate buffer, pH 4.0). Filter through 0.22 µm membranes. Pre-cool aqueous phase if needed.
- Setup: Prime a staggered herringbone micromixer (SHM) chip or equivalent. Connect syringes containing each phase to a dual-syringe pump. Ensure all tubing is purged of air.
- FRR Screen (Constant TFR): Set TFR to a moderate rate (e.g., 5 mL/min). Perform sequential runs, varying the FRR from 1:1 to 5:1 in increments (e.g., 1:1, 2:1, 3:1, 4:1, 5:1). Collect the effluent in a vessel containing a large volume of neutral pH buffer (e.g., 1:10 dilution into PBS) to quench mixing.
- TFR Screen (Constant Optimal FRR): Based on step 3, select the FRR yielding the best PDI/EE. Perform sequential runs, varying TFR (e.g., 2, 5, 8, 12, 15 mL/min) while maintaining this FRR.
- Post-Processing: Dialyze or tangential flow filter (TFF) all formulations against PBS to remove ethanol and perform buffer exchange.
- Analysis: Measure particle size and PDI via DLS, EE% via Ribogreen assay, and visualize morphology by cryo-TEM.
Protocol 3.2: Quantifying Mixing Efficiency via Visualization Objective: To experimentally validate the mixing efficiency of a given chip geometry and flow condition. Materials: As above, plus 1 M NaOH, 0.1% phenolphthalein in ethanol. Procedure:
- Test Solution Preparation: Organic phase simulant: Ethanol with 0.1% phenolphthalein. Aqueous phase simulant: 1 M NaOH in DI water.
- Setup: Use a transparent microfluidic chip (e.g., PDMS). Set up syringe pumps with the test solutions.
- Visualization Run: Run the two phases at the target FRR and TFR. The base (NaOH) will diffuse into the ethanol stream, causing the phenolphthalein to turn pink.
- Image Capture: Use a high-speed camera mounted on a microscope to capture the mixing pattern immediately downstream of the junction.
- Analysis: Use image analysis software (e.g., ImageJ) to quantify the coefficient of variation (CV) of pixel intensity across the channel width. Lower CV indicates more homogeneous mixing (higher efficiency).
4. Visualizations
Title: How FRR & TFR Drive LNP Quality via Mixing
Title: Sequential Optimization Protocol for FRR and TFR
5. The Scientist's Toolkit
Table 3: Essential Research Reagent Solutions for LNP Process Optimization
| Item | Function & Rationale |
|---|---|
| Ionizable Cationic Lipid (e.g., DLin-MC3-DMA, SM-102) | The key functional lipid for complexing mRNA and enabling endosomal escape. Its pKa is critical for performance. |
| Phospholipid (e.g., DSPC) | Provides structural integrity to the LNP bilayer and enhances stability. |
| Cholesterol | Modulates membrane fluidity and stability, and promotes fusion with endosomal membranes. |
| PEG-lipid (e.g., DMG-PEG2000) | Controls particle size during formation and reduces aggregation; impacts pharmacokinetics. |
| mRNA in Citrate Buffer (pH 4.0) | The aqueous phase cargo. Acidic pH promotes protonation of ionizable lipid for efficient encapsulation. |
| Ethanol (Absolute, >99.9%) | Organic solvent for lipids. High purity ensures consistent self-assembly and prevents impurities. |
| Staggered Herringbone Micromixer (SHM) Chip | Induces chaotic advection for rapid, homogeneous mixing at Reynolds numbers typical for LNP formation (∼1-100). |
| Precision Syringe Pump (Dual-channel) | Provides precise, pulseless control over FRR and TFR, the primary independent variables. |
| In-line Static Mixer | Alternative to microfluidic chips for larger-scale process development; offers different mixing dynamics. |
| Tangential Flow Filtration (TFF) System | For efficient buffer exchange, concentration, and ethanol removal post-formulation. |
Within the development of Lipid Nanoparticle (LNP) formulations for mRNA delivery, achieving long-term stability is a critical barrier to clinical translation and commercial viability. mRNA is inherently labile, and LNPs are dynamic, metastable systems prone to aggregation, payload degradation, and lipid hydrolysis over time. This application note details three cornerstone strategies—cryoprotection, lyophilization, and optimized storage—within the context of a comprehensive thesis on advancing LNP-mRNA formulation protocols. The methodologies herein are designed for researchers and drug development professionals seeking to enhance shelf-life from months to years.
Key Stability Challenges for LNP-mRNA Formulations
The primary degradation pathways include:
- Chemical Degradation: Hydrolysis of ionizable/cationic lipids and PEG-lipids; dephosphorylation of helper lipids.
- Physical Instability: Particle aggregation, fusion, and size growth; mRNA leakage.
- mRNA Integrity Loss: Ribonuclease (RNase)-mediated degradation or hydrolytic cleavage of the phosphodiester backbone.
Strategy I: Cryoprotection for Frozen Storage
Cryoprotection aims to mitigate ice crystal formation and osmotic stress during freezing, which can disrupt LNP structure and cause mRNA leakage.
Application Note & Protocol
Objective: To preserve particle size, PDI, encapsulation efficiency, and potency of LNP-mRNA formulations during freeze-thaw cycles and long-term frozen storage.
Research Reagent Solutions:
| Reagent/Category | Example Products/Brands | Primary Function in Cryoprotection |
|---|---|---|
| Sugars (Disaccharides) | Sucrose (Sigma-Aldrich), Trehalose (Pfanstiehl) | Form amorphous glassy matrix, sterically stabilize particles, replace water molecules. |
| Polyols | Mannitol (MilliporeSigma), Sorbitol | Provide bulking agent properties, moderate glass transition temperature. |
| Cryoprotective Buffers | Tris-sucrose, Phosphate-Trehalose | Maintain pH and ionic strength while providing cryoprotection. |
| Specialized Cryoprotectants | CryoStor CS10 (BioLife Solutions) | Proprietary, serum-free, GMP solutions designed for cell and biologics preservation. |
Detailed Protocol:
- Formulation & Mixing: Prepare LNP-mRNA via standard microfluidic mixing. Dialyze or buffer exchange into the desired cryoprotectant-containing buffer (e.g., 10% w/v sucrose in 10 mM Tris, pH 7.4).
- Characterization Pre-Freeze: Measure particle size (DLS), PDI, zeta potential, RNA encapsulation efficiency (Ribogreen assay), and in vitro potency.
- Aliquoting: Aliquot formulation into cryovials suitable for long-term storage (e.g., 0.5-2.0 mL fill volume).
- Controlled-Rate Freezing: Use a programmable freezer. A standard protocol: Cool from +4°C to -5°C at -1°C/min; hold for 5 min (nucleation); cool to -40°C at -1°C/min; finally cool to -80°C at -5°C/min. Do not use a -80°C freezer directly without controlled rate freezing.
- Storage: Transfer vials to long-term storage at -80°C or below (e.g., vapor phase liquid nitrogen).
- Thawing: Thaw rapidly in a 37°C water bath with gentle agitation until just ice-free. Analyze immediately post-thaw.
Quantitative Data Summary (Representative): Table 1: Impact of Cryoprotectants on LNP-mRNA Stability After 3 Freeze-Thaw Cycles (-80°C to 25°C)
| Cryoprotectant Formulation | Size (nm) Pre-Freeze | Size (nm) Post-Freeze | % Encapsulation Pre-Freeze | % Encapsulation Post-Freeze | % In Vitro Activity Retention |
|---|---|---|---|---|---|
| No Additive (Control) | 85.2 ± 2.1 | 452.3 ± 45.6 | 98.1 ± 0.5 | 72.4 ± 5.2 | 25 ± 8 |
| 10% Sucrose | 86.5 ± 1.8 | 92.1 ± 3.5 | 97.8 ± 0.7 | 95.1 ± 1.1 | 95 ± 5 |
| 5% Trehalose + 2% Mannitol | 84.9 ± 2.4 | 88.7 ± 2.9 | 98.3 ± 0.4 | 96.8 ± 0.9 | 98 ± 3 |
| Commercial CryoStor CS10 | 87.1 ± 1.5 | 89.5 ± 3.1 | 97.5 ± 0.9 | 96.2 ± 1.3 | 97 ± 4 |
Strategy II: Lyophilization for Solid-State Storage
Lyophilization (freeze-drying) removes water to create a stable solid cake, eliminating aqueous degradation pathways and enabling storage at 2-8°C or even ambient temperatures.
Application Note & Protocol
Objective: To produce a stable, readily reconstitutable lyophilized cake of LNP-mRNA with minimal activity loss.
Research Reagent Solutions:
| Reagent/Category | Example Products/Brands | Primary Function in Lyophilization |
|---|---|---|
| Lyoprotectants | Trehalose (Pfanstiehl), Sucrose | Form stable amorphous matrix, protect during drying, prevent collapse. |
| Bulking Agents | Mannitol, Glycine | Provide crystalline structure for elegant cake, improve reconstitution. |
| Buffering Agents | Tromethamine (Tris), Histidine | Maintain pH stability during process and in solid state. |
| Lyophilization Vials | 3 mL Tubular Vials (Schott, DWK Life Sciences) | Chemically resistant, low adsorption, suitable for stopper placement. |
| Lyostoppers | 13 mm Lyophilization Stoppers (West Pharmaceutical Services) | Designed for lyo use, allow vapor escape during primary drying. |
Detailed Protocol:
- Formulate Lyoprotectant Solution: Prepare final formulation buffer containing 5-10% w/v trehalose and 1-3% w/v mannitol in a low-salt buffer (e.g., 20 mM Tris-HCl, pH 7.4). Filter sterilize (0.22 µm).
- Buffer Exchange: Use tangential flow filtration (TFF) or dialysis to exchange the LNP-mRNA formulation into the lyoprotectant solution.
- Fill & Load: Aseptically fill vials (e.g., 1.0 mL fill for a 3 mL vial). Partially insert lyostoppers. Load onto pre-cooled (-45°C) shelf of lyophilizer.
- Freezing: Ramp shelf to -45°C at 1°C/min, hold for 2-4 hours.
- Primary Drying: Reduce chamber pressure to 50-100 mTorr. Gradually increase shelf temperature to -25°C over 10 hours, hold for 40-60 hours (until product temperature matches shelf).
- Secondary Drying: Gradually increase shelf temperature to +25°C over 10 hours. Hold at +25°C for 10-20 hours at low pressure.
- Backfill & Seal: Backfill chamber with dry nitrogen or argon. Hydraulically press stoppers closed under vacuum/inert gas.
- Reconstitution: Add sterile Water for Injection (WFI) to original volume, gently swirl or invert until cake fully dissolves. Do not vortex aggressively.
Quantitative Data Summary (Representative): Table 2: Stability of Lyophilized LNP-mRNA Formulations Stored at 5°C
| Time Point | Formulation | Cake Appearance | Reconstitution Time (s) | Size (nm) Post-Reconstitution | % Encapsulation Retention | % In Vivo Luciferase Expression Retention |
|---|---|---|---|---|---|---|
| Initial (t=0) | LNP + 8% Trehalose | White, intact | 30 ± 5 | 89.3 ± 2.2 | 100 ± 1 | 100 ± 10 |
| 3 Months | LNP + 8% Trehalose | White, intact | 35 ± 8 | 93.1 ± 3.5 | 98.5 ± 0.8 | 97 ± 12 |
| 6 Months | LNP + 8% Trehalose | White, slight shrinkage | 40 ± 10 | 95.5 ± 4.1 | 97.1 ± 1.2 | 92 ± 15 |
| 6 Months | Control (Liquid, -80°C) | N/A | N/A | 90.2 ± 2.8 | 98.9 ± 0.5 | 98 ± 8 |
Strategy III: Optimized Liquid and Solid Storage Conditions
Defining precise storage parameters is essential for maximizing shelf-life.
Application Note & Protocol
Objective: To determine the ideal storage temperature and atmospheric conditions for liquid or solid LNP-mRNA.
Detailed Protocol for Stability Study:
- Sample Preparation: Prepare identical aliquots of cryoprotected (liquid) or lyophilized LNP-mRNA.
- Storage Conditions Setup:
- Liquid: Store at -80°C, -20°C, 2-8°C, and 25°C/60% RH (controlled stability chamber).
- Lyophilized: Store at -20°C, 2-8°C, 25°C/60% RH, and 40°C/75% RH (accelerated conditions).
- For inert atmosphere studies, purge vials with argon and seal before storage.
- Time Points: Pull samples at t=0, 1, 3, 6, 9, 12, 18, and 24 months.
- Stability Indicating Assays: At each time point, assess: particle size/PDI (DLS), mRNA encapsulation (Ribogreen), mRNA integrity (cGE or RNA TapeStation), lipid degradation (HPLC-ELSD/CAD), and biological potency (cell-based assay).
Quantitative Data Summary (Representative): Table 3: Recommended Storage Conditions & Expected Stability
| Formulation State | Recommended Storage | Max Recommended Duration | Key Stability Indicators at End Point |
|---|---|---|---|
| Liquid (Cryoprotected) | -80°C ± 10°C, inert headspace | 24 months | Size change < 10%, Encapsulation > 95%, Potency > 90% |
| Liquid (Cryoprotected) | -20°C ± 5°C, inert headspace | 6 months | Size change < 15%, Encapsulation > 90%, Potency > 80% |
| Lyophilized (Optimized) | 2-8°C, protected from light | 24 months | Reconstitution < 60s, Size change < 15%, Potency > 80% |
| Lyophilized (Optimized) | 25°C/60% RH (for clinical use) | 3 months | Reconstitution < 60s, Size change < 20%, Potency > 70% |
Visualizations
Application Notes and Protocols
1. Introduction Within the critical research field of Lipid Nanoparticle (LNP) formulation for mRNA delivery, batch-to-batch variability presents a significant hurdle in translating preclinical success to clinical application. This variability can manifest in differences in particle size, polydispersity index (PDI), encapsulation efficiency, and ultimately, biological potency. This document outlines standardized protocols and analytical approaches to minimize variability and ensure the reproducibility of LNP-mRNA formulations, a core requirement for robust therapeutic development.
2. Key Sources of Variability and Control Strategies Primary sources of variability are summarized in Table 1.
Table 1: Key Sources of LNP Variability and Control Parameters
| Source Category | Specific Parameter | Target Range/Standard | Impact on Reproducibility |
|---|---|---|---|
| Lipid Stock Solutions | Lipid purity, solvent grade, concentration accuracy, storage conditions (-80°C, under argon) | >99% purity, anhydrous ethanol/chloroform, verified by NMR/MS, sealed vials | Directly affects lipid molar ratios, the core driver of self-assembly and morphology. |
| mRNA Input | Integrity (RIN/DIN), purity (HPLC), concentration, sequence/structure | RIN >9.0, >90% purity, accurate spectrophotometric (A260) quantification | Impacts encapsulation efficiency, stability, and translational activity. |
| Formulation Process | Mixing method (T/Jet, microfluidics), flow rate ratio (FRR), total flow rate (TFR), temperature | Controlled via syringe pumps (±1% accuracy), FRR 3:1 (aq:eth), TFR 12 mL/min, 20-25°C | Governs nanoprecipitation kinetics, determining size, PDI, and lamellar structure. |
| Buffer & Aqueous Phase | pH, ionicity, chelating agents (EDTA), RNase-free water | pH 6.5-7.0 (e.g., 25 mM acetate), 0-50 mM NaCl, 0.1 mM EDTA, nuclease-free grade | Affects mRNA stability during mixing and final LNP surface charge (zeta potential). |
| Post-Formulation | Dialysis/TFF buffer, duration, membrane pore size, concentration method | 100x volume PBS, 4 hours, 100 kDa MWCO, controlled centrifugal concentration | Determines final buffer exchange efficiency and removes residual ethanol. |
3. Core Experimental Protocols
Protocol 3.1: Standardized Microfluidic Preparation of mRNA-LNPs Objective: To reproducibly formulate LNPs with consistent physicochemical characteristics. Materials: Precision syringe pumps (2), microfluidic mixer (e.g., staggered herringbone or T-junction), lipid stock solutions in ethanol, mRNA in citrate/acetate buffer (pH 4.0), dialysis cassettes (MWCO 100 kDa), sterile PBS. Procedure:
- Prepare Lipid Mixture: Combine ionizable lipid, phospholipid, cholesterol, and PEG-lipid at the desired molar ratio (e.g., 50:10:38.5:1.5) in ethanol. Filter (0.22 µm PTFE) and store on ice.
- Prepare Aqueous Phase: Dilute mRNA in 25 mM sodium acetate buffer (pH 4.0) to a target concentration (e.g., 0.1 mg/mL). Filter (0.22 µm cellulose acetate).
- Prime System: Load lipid and aqueous solutions into separate glass syringes. Prime tubing and mixer with respective solutions.
- Formulation: Set Total Flow Rate (TFR) to 12 mL/min and Flow Rate Ratio (FRR, aqueous:ethanol) to 3:1. Initiate simultaneous pumping. Collect effluent in a vial containing 5x volume of PBS, pH 7.4, under gentle stirring.
- Buffer Exchange: Immediately transfer the crude LNP solution into a dialysis cassette. Dialyze against 1 L PBS (pH 7.4) at 4°C for 4 hours, with one buffer change after 2 hours.
- Concentration & Sterilization: Concentrate LNPs using centrifugal filters (100 kDa MWCO) to desired mRNA concentration. Sterile-filter (0.22 µm PES) and aliquot.
- QC Sampling: Immediately analyze aliquot for size, PDI, and encapsulation efficiency (Protocol 3.2).
Protocol 3.2: Critical Quality Attribute (CQA) Assessment Objective: To quantitatively assess key physicochemical CQAs for batch release and comparison. Materials: Dynamic Light Scattering (DLS) instrument, Ribogreen assay kit, electrophoresis system, HPLC system with size exclusion column (SEC). Procedure:
- Size & PDI: Dilute LNP sample 1:100 in PBS. Measure by DLS. Record Z-average diameter and PDI. Acceptance Criteria: PDI < 0.2.
- Encapsulation Efficiency (EE):
- Dilute LNP sample in TE buffer (with/without 1% Triton X-100) to disrupt particles.
- Add Ribogreen dye, incubate in the dark.
- Measure fluorescence. Calculate EE% = [1 - (RNA signal without detergent / RNA signal with detergent)] x 100. Target: >90%.
- mRNA Integrity: Analyze LNP samples (disrupted) by denaturing agarose gel electrophoresis or capillary electrophoresis. Compare to unformulated mRNA control.
- Particle Concentration: Use nanoparticle tracking analysis (NTA) or tunable resistive pulse sensing (TRPS) for absolute particle count.
4. Visualization of Workflow and Relationships
Diagram Title: LNP-mRNA Formulation and QC Workflow
Diagram Title: Variability Control Leads to Reproducibility
5. The Scientist's Toolkit: Essential Research Reagent Solutions
| Item / Reagent | Function / Role in Ensuring Reproducibility | Key Specification / Note |
|---|---|---|
| Ionizable Lipid (e.g., DLin-MC3-DMA, SM-102) | Structural lipid, critical for mRNA complexation and endosomal escape. | High purity (>99%), defined storage under inert gas, quantified by LC-MS. |
| Phospholipid (e.g., DSPC) | Structural lipid, enhances bilayer stability and fusogenicity. | Synthetic, >99% purity, stored in chloroform at -80°C. |
| Cholesterol | Modulates membrane fluidity and stability. | Pharmaceutical grade, source-traceable. |
| PEG-lipid (e.g., DMG-PEG2000) | Controls particle size, reduces aggregation, modulates pharmacokinetics. | Defined PEG chain length and lipid anchor, monitor for degradation. |
| Nuclease-Free Water/Buffers | Aqueous phase preparation; prevents mRNA degradation. | Certified nuclease-free, DEPC-treated or 0.1 µm filtered. |
| mRNA (Research Grade) | The active pharmaceutical ingredient (API). | Defined cap analog, poly(A) tail length, HPLC-purified, verified integrity. |
| Precision Syringe Pumps | Enforces precise control over TFR and FRR during nanoprecipitation. | Calibrated, with low pulsation, capable of >10 mL/min combined flow. |
| Microfluidic Mixer Chip | Engineered geometry ensures consistent, rapid mixing. | Cleanroom-fabricated, consistent channel dimensions between batches. |
| Dynamic Light Scattering (DLS) Instrument | Primary tool for measuring particle size (Z-avg) and PDI. | Daily calibration with standard latex beads, consistent measurement temperature. |
| Fluorescent Nucleic Acid Stain (e.g., Ribogreen) | Enables sensitive quantification of encapsulation efficiency. | Use fresh dilution from stock, consistent incubation time for assays. |
This document provides application notes and protocols for scaling lipid nanoparticle (LNP) formulation for mRNA delivery from laboratory microfluidic devices to pilot and Good Manufacturing Practice (GMP) production. This content supports a broader thesis investigating optimized, scalable, and reproducible mRNA-LNP formulation protocols, critical for translating bench research into clinical therapeutics.
Key Scaling Challenges and Quantitative Comparisons
Table 1: Comparative Analysis of Microfluidic Platforms Across Scales
| Parameter | Lab/Bench Scale (e.g., NanoAssemblr Ignite) | Pilot Scale (e.g., NanoAssemblr Blaze) | GMP Production (e.g., Precision NanoSystems NxGen or Inline Mixers) |
|---|---|---|---|
| Typical Flow Rate Range | 1 - 20 mL/min total combined flow | 20 - 500 mL/min total combined flow | 100 mL/min - 10 L/min+ total combined flow |
| Volumetric Throughput | 0.5 - 100 mL batch size | 100 mL - 10 L batch size | 1 L - 1000 L batch size |
| Mixing Mechanism | Staggered Herringbone Micromixer (SHM) or Confined Impinging Jet | Scalable SHM or Multi-lamination | Continuous flow, static mixer, or scalable SHM |
| Residence Time | ~1 - 10 ms | ~1 - 50 ms | Configurable, typically 1-100 ms |
| Critical Quality Attributes (CQA) Impact | Particle Size: 60-100 nm, PDI: 0.05-0.2, Encapsulation: >90% | Particle Size: 70-110 nm, PDI: 0.05-0.15, Encapsulation: >90% | Particle Size: 70-120 nm, PDI: <0.2, Encapsulation: >85% |
| Key Scaling Factor | Flow Rate Ratio (FRR), Total Flow Rate (TFR) | Constant Reynolds Number, TFR, mixer geometry | Constant mixing energy (ε), Power/Volume, pressure control |
Table 2: Impact of Process Parameters on LNP CQAs During Scale-Up
| Process Parameter | Impact on Particle Size (nm) | Impact on Polydispersity Index (PDI) | Impact on Encapsulation Efficiency (%) | Optimal Scaling Strategy |
|---|---|---|---|---|
| Total Flow Rate (TFR) | Inverse correlation: Higher TFR → smaller size. Scale by maintaining TFR per channel or constant ε. | Higher TFR generally reduces PDI. | Minimal direct impact if mixing is efficient. | Linear scaling of TFR while maintaining FRR and mixer geometry. |
| Flow Rate Ratio (FRR) | Higher aqueous:organic ratio → larger size. Critical to fix at optimal point (e.g., 3:1). | Deviations from optimum increase PDI. | Significant impact; optimal ratio is cargo/lipid dependent. | Keep constant across all scales. |
| Lipid Concentration | Increased concentration → larger size. Must be optimized for scale. | Increased concentration can increase PDI. | Lower concentration can improve encapsulation kinetics. | May require re-optimization at high concentration; consider viscosity effects. |
| Temperature Control | Minor effect if within range. Aggregation at high T. | Poor control increases PDI. | mRNA integrity at high T is a risk. | Implement jacketed mixing units and cooling loops at pilot/GMP. |
| Mixer Geometry/Type | Direct determinant of nucleation rate. Geometry must be preserved. | Largest impact; consistent geometry is key to consistent PDI. | Impacts lipid mixing kinetics and mRNA capture. | Geometric similarity (e.g., SHM groove depth/width ratio) is essential. |
Detailed Experimental Protocols
Protocol 3.1: Lab-Scale Optimization for Scale-Up (NanoAssemblr Ignite)
Objective: Establish a robust formulation process defining Critical Process Parameters (CPPs) for scale-up. Materials: See "The Scientist's Toolkit" (Section 5). Procedure:
- Lipid Stock Preparation: Prepare ionizable lipid, DSPC, cholesterol, and PEG-lipid in ethanol at a master stock concentration (e.g., 50 mM total lipids). Filter through 0.2 µm PTFE syringe filter.
- mRNA Solution Preparation: Dilute mRNA in citrate buffer (e.g., 10 mM, pH 4.0) to target concentration (e.g., 0.1 mg/mL). Keep on ice.
- Microfluidic Operation: a. Prime instrument with respective solvents. b. Set Flow Rate Ratio (FRR, aqueous:organic) to 3:1. Set Total Flow Rate (TFR) to 12 mL/min. c. Load mRNA solution into aqueous syringe and lipid solution into organic syringe. d. Initiate mixing. Collect formulated LNPs in a vessel.
- Post-Formulation Processing: Dilute collected LNPs 1:1 with 1X PBS (pH 7.4). Perform buffer exchange into final storage buffer via dialysis or tangential flow filtration (TFF).
- Analysis: Measure particle size and PDI by DLS, encapsulation efficiency by RiboGreen assay.
Protocol 3.2: Direct Scale-Up to Pilot Scale (NanoAssemblr Blaze)
Objective: Translate optimized CPPs from lab-scale to pilot-scale, producing 1 L batch. Materials: As per Protocol 3.1, with larger volume sterile bags, peristaltic pump tubing, and in-line 0.2 µm sterilizing filter. Procedure:
- Solution Preparation: Scale lipid and mRNA solutions proportionally for 1 L final volume. Pre-filter both solutions through 0.2 µm filters.
- System Setup & Sanitization: Flush pilot-scale system with 70% ethanol, followed by sterile Water for Injection (WFI).
- Parameter Translation: Calculate pilot TFR to maintain equivalent mixing energy (ε) or Reynolds number. If mixer geometry is identical, TFR can be scaled linearly (e.g., from 12 mL/min to 300 mL/min for 25x scale). Maintain the exact FRR (3:1).
- Formulation Run: Pump solutions from sterile bags through the sanitized mixer. Collect output in a sterile, cooled vessel.
- Large-Scale Buffer Exchange: Use a TFF system with a 100 kDa MWCO cartridge. Diafilter against 10 volumes of final buffer (e.g., PBS, sucrose). Concentrate to target mRNA concentration.
- Sterile Filtration: Pass concentrated LNP through a 0.2 µm sterile filter into a final container. Sample for QC testing.
Protocol 3.3: Process Characterization for GMP Readiness
Objective: Define the design space for CPPs using a Design of Experiments (DoE) approach. Procedure:
- Define Factors & Ranges: Select 3-4 CPPs (e.g., TFR, FRR, lipid concentration, buffer pH). Set ranges based on lab and pilot experiments.
- Run DoE: Execute a fractional factorial or response surface design. For each run, measure CQAs: particle size, PDI, encapsulation efficiency, and potency (in vitro expression).
- Data Analysis: Use statistical software to build models linking CPPs to CQAs. Identify the design space where all CQAs meet specifications.
- Edge of Failure Studies: Deliberately operate at CPP extremes to establish proven acceptable ranges (PARs).
Visualizations
Title: LNP Scale-Up Workflow from Lab to GMP
Title: CPP and CQA Relationship Map
The Scientist's Toolkit: Research Reagent Solutions
Table 3: Essential Materials for Scalable LNP Formulation
| Item | Function & Importance | Example/Catalog Consideration |
|---|---|---|
| Ionizable Cationic Lipid | Key structural/functional lipid for mRNA complexation and endosomal escape. Critical for potency. | SM-102, ALC-0315, proprietary lipids. High purity (>99%) is essential for GMP. |
| Helper Lipids (DSPC, Cholesterol) | Modulate bilayer fluidity, stability, and fusogenicity. DSPC provides structural integrity. | Synthetic, plant-derived for GMP. Defined compendial quality (e.g., USP). |
| PEGylated Lipid (PEG-DMG, PEG-DSPE) | Controls particle size during formation, reduces aggregation, modulates pharmacokinetics. | Defined PEG chain length and lipid anchor. Low polydispersity index. |
| mRNA Drug Substance | The active pharmaceutical ingredient (API). Integrity and purity are paramount. | GMP-grade, cap-1, polyA tail, modified nucleosides, HPLC-purified. |
| Microfluidic Mixer | Engineered device for reproducible nano-precipitation. Geometry dictates scalability. | NanoAssemblr cartridges (SHM), T-mixers, impinging jets. Single-use for GMP. |
| Tangential Flow Filtration (TFF) System | For buffer exchange, concentration, and diafiltration at scales >100 mL. | Systems with sanitary fittings, scalable cartridge area (100 kDa MWCO). |
| Process Analytical Technology (PAT) | In-line monitoring of CPPs (pressure, flow, temp) and CQAs (size, concentration). | In-line DLS, UV-Vis flow cells, pressure transducers for feedback control. |
| Sterile Single-Use Assemblies | Bioreactor bags, tubing, filters, and connectors for aseptic processing. | SUS with validated extractables/leachables, gamma-irradiated. |
Validating LNP-mRNA Formulations: Characterization, Functional Assays, and Platform Comparisons
Within the thesis on LNP formulation for mRNA delivery, rigorous characterization of critical quality attributes is paramount. This Application Notes document details a comprehensive analytical toolkit for assessing mRNA encapsulation, purity, and integrity. The synergy of these methods ensures robust LNP product characterization, directly impacting efficacy and safety in therapeutic applications.
Table 1: Performance Metrics of Key Analytical Techniques for LNP-mRNA Characterization
| Technique | Key Parameter Measured | Typical Range for Optimized LNPs | Detection Limit | Assay Time (approx.) |
|---|---|---|---|---|
| RiboGreen Assay | Encapsulation Efficiency (%) | 90% - 95% (mRNA-specific) | 1 ng/mL dsRNA | 1 hour |
| RP-HPLC | mRNA Purity / Impurity Profile | > 95% mRNA main peak | ~ 10 ng (on-column) | 30-45 min |
| Denaturing Agarose Gel | mRNA Integrity | Clear, single band at expected size | ~ 5 ng/band | 2.5 hours |
Table 2: Common LNP Formulation Interference Assessment in RiboGreen Assay
| Interference Source | Effect on Fluorescence Signal | Recommended Mitigation Strategy |
|---|---|---|
| Empty LNPs (Lipids) | Minimal to moderate quenching | Include matched empty LNP controls in standard curve |
| Detergent (Triton X-100) | Signal enhancement (unquenching) | Standardize detergent concentration (e.g., 0.1-1.0%) |
| Buffer Components | Variable | Validate assay in final formulation buffer |
Detailed Protocols
RiboGreen Assay for mRNA Encapsulation Efficiency
Principle: The fluorescent dye RiboGreen binds to RNA. Its fluorescence is dramatically enhanced upon binding and is proportional to RNA concentration. Encapsulated mRNA is shielded; a detergent disrupts the LNP, allowing total RNA measurement. Comparison with untreated samples gives the free (unencapsulated) RNA.
Protocol:
- Reagent Preparation: Dilute RiboGreen dye 1:200 in TE buffer (10 mM Tris-HCl, 1 mM EDTA, pH 7.5). Prepare mRNA standards in the same buffer as the sample (e.g., 10 mM Tris, pH 7.4) from 1 µg/mL to 0 ng/mL.
- Sample Preparation:
- Total mRNA (T): Dilute LNP-mRNA sample 100-1000 fold in TE buffer containing 0.1% (v/v) Triton X-100. Incubate for 5-10 minutes at room temperature to disrupt LNPs.
- Free mRNA (F): Dilute an aliquot of the same LNP-mRNA sample identically but in TE buffer without detergent.
- Assay Procedure:
- In a black 96-well plate, add 100 µL of each standard, sample (T and F), and appropriate blanks (buffer + detergent, buffer alone).
- Add 100 µL of diluted RiboGreen reagent to each well. Protect from light.
- Incubate at room temperature for 5-10 minutes.
- Measure fluorescence (excitation ~480 nm, emission ~520 nm).
- Calculations:
- Generate a standard curve from the mRNA standards.
- Determine the RNA concentration in the Total (CT) and Free (CF) samples from the curve.
- Encapsulation Efficiency (%) = [1 - (CF / CT)] x 100.
- mRNA Loading (wt/wt %) = (Mass of encapsulated mRNA / Mass of total lipids) x 100.
Reverse-Phase HPLC (RP-HPLC) for mRNA Purity Analysis
Principle: mRNA is separated from impurities (plasmid DNA, truncated transcripts, proteins) based on hydrophobicity on a C4 or C8 column under ion-pairing conditions.
Protocol:
- Column: Polymer or silica-based C4 or C8 column, 300Å pore size, 5 µm particle size, 4.6 x 150 mm.
- Mobile Phase:
- A: 0.1 M Triethylammonium acetate (TEAA), pH 7.0.
- B: Acetonitrile (or a 90:10 v/v mix of Acetonitrile:Isopropanol).
- Sample Prep: Dilute LNP-mRNA formulation to ~0.1 mg/mL mRNA in 0.1% Triton X-100/TE buffer, vortex, incubate 10 min, centrifuge (14,000 x g, 5 min). Use supernatant. Filter through 0.22 µm PVDF syringe filter.
- Gradient:
- 0-5 min: 20% B.
- 5-25 min: 20% to 60% B (linear gradient).
- 25-26 min: 60% to 90% B.
- 26-30 min: Hold at 90% B.
- 30-35 min: Re-equilibrate at 20% B.
- Detection: UV at 260 nm.
- Analysis: Identify the main mRNA peak (typically eluting ~15-22 min). Integrate peak areas. Purity is calculated as (Area of main peak / Total area of all peaks) x 100.
Denaturing Agarose Gel Electrophoresis for mRNA Integrity
Principle: Under denaturing conditions (formaldehyde), mRNA migrates according to its linear length, allowing visualization of intact full-length product versus degraded fragments.
Protocol:
- Gel Preparation: Prepare a 1% agarose gel by dissolving agarose in 1X MOPS buffer. Cool to ~60°C, add formaldehyde to a final concentration of 2.2 M (in a fume hood). Pour gel and let set.
- Sample Preparation:
- Mix: 2 µL 10X MOPS, 3.5 µL 37% formaldehyde, 10 µL formamide.
- Add 1-2 µL of LNP-mRNA sample (disrupted with 0.5% SDS) or mRNA standard (50-200 ng).
- Heat at 70°C for 10 minutes, then place on ice.
- Add 2 µL of loading dye containing EDTA.
- Electrophoresis: Run gel in 1X MOPS running buffer at 5-6 V/cm for 60-90 minutes with circulation.
- Staining & Visualization: Stain gel with SYBR Gold or Ethidium Bromide for 20-30 minutes. Destain in water if needed. Image using a gel documentation system with UV transillumination.
Visualizations
Diagram Title: RiboGreen Assay Workflow for LNP EE
Diagram Title: Complementary mRNA Purity & Integrity Analysis
The Scientist's Toolkit
Table 3: Essential Research Reagent Solutions for LNP-mRNA Analytical Characterization
| Reagent/Material | Supplier Examples | Primary Function in Analysis |
|---|---|---|
| Quant-iT RiboGreen RNA Assay Kit | Thermo Fisher Scientific | Fluorescent dye for sensitive, selective quantification of dsRNA (mRNA). Core of EE assay. |
| Triton X-100 Detergent | Sigma-Aldrich, Thermo Fisher | Non-ionic detergent used to disrupt LNP bilayer, releasing encapsulated mRNA for total RNA measurement. |
| Triethylammonium Acetate (TEAA) | Merck, Thermo Fisher | Volatile ion-pairing agent for RP-HPLC, enabling separation of nucleic acids on hydrophobic columns. |
| SYBR Gold Nucleic Acid Gel Stain | Thermo Fisher Scientific | High-sensitivity, fluorescent stain for visualizing RNA in denaturing agarose gels. |
| RNA Millennium Markers | Thermo Fisher, NEB | Size ladder for denaturing gels to confirm mRNA size and identify degradation fragments. |
| Formamide (Molecular Biology Grade) | Ambion, Sigma-Aldrich | Denaturing agent used in gel sample buffer to keep mRNA linear during electrophoresis. |
| C4 or C8 RP-HPLC Columns (300Å) | Agilent, Waters, Phenomenex | Stationary phase for separating full-length mRNA from impurities based on hydrophobicity. |
| Nuclease-Free Water & Tubes | Various (Ambion) | Critical for all steps to prevent sample degradation by environmental RNases. |
Within the broader thesis on LNP formulation for mRNA delivery, establishing robust structure-function relationships is paramount. The efficacy, stability, and safety of LNPs are dictated by their complex physicochemical properties. This application note details the integrated use of two advanced analytical techniques: Cryo-Electron Microscopy (Cryo-EM) for direct visualization of nanostructure and morphology, and Differential Scanning Calorimetry (DSC) for probing the thermal phase behavior and stability of lipid components. Together, they provide a comprehensive analytical framework to guide rational LNP design and optimization.
Cryo-EM for LNP Structural Analysis
Cryo-EM enables the visualization of LNPs in a near-native, hydrated state, revealing details such as lamellarity, size distribution, internal mRNA compartmentalization, and surface morphology.
Key Quantitative Data from Recent Cryo-EM Studies of mRNA LNPs
Table 1: Representative Cryo-EM Structural Data for Varied LNP Formulations
| LNP Lipid Composition | Average Diameter (nm) | Internal Structure Observed | mRNA Electron Density Location | Key Structural Insight |
|---|---|---|---|---|
| ALC-0315:DSPC:Chol:DMG-PEG2000 | 70-90 | Disordered, electron-dense core | Core-localized, heterogeneous | Classical "Lipid Nanoparticle" morphology with amorphous core. |
| DLin-MC3-DMA:DOPE:Chol: PEG-lipid | 80-100 | Multilamellar or inverted hexagonal | Between lipid layers | Helper lipid (DOPE) can drive non-bilayer structure, potentially enhancing endosomal escape. |
| Ionizable Cationic Lipid: DSPC:Chol:PEG-lipid (High PEG%) | 40-60 | Uniform, vesicular | Peripheral or absent | High PEG content can form PEGylated vesicles with reduced mRNA loading. |
| Fresh vs. Aged (4°C, 1 month) Formulation | Initial: 85 ± 10; Aged: 110 ± 25 | Increased aggregation, fusion | More diffuse | Cryo-EM directly visualizes physical instability phenomena not always captured by DLS. |
Detailed Protocol: Cryo-EM Sample Preparation and Imaging for LNPs
Objective: To vitrify LNP samples for high-resolution imaging of native structure. Materials: LNP formulation (~3-5 mg/mL lipids), Quantifoil R 1.2/1.3 or UltraAufoil holy carbon grids, Vitrobot Mark IV (or equivalent), Filter paper, Liquid ethane, Cryo-EM microscope (e.g., Talos Arctica, Krios). Procedure:
- Glow Discharge: Place a carbon grid in a glow discharger for 30-45 seconds at medium power. This renders the grid hydrophilic, ensuring even sample spread.
- Vitrobot Setup: Set the Vitrobot environmental chamber to >95% humidity and 4°C (or 22°C, per experimental design) to prevent sample evaporation.
- Sample Application: Pipette 3.5 µL of the LNP suspension onto the glow-discharged grid inside the Vitrobot chamber.
- Blotting: Initiate the automated blotting process. Parameters are critical: Blot time = 3-5 seconds, Blot force = 0-5. The goal is to leave a thin, vitreous ice film (~50-200 nm thick) spanning the grid holes.
- Plunge-Freezing: Immediately after blotting, plunge the grid rapidly into liquid ethane cooled by liquid nitrogen. This achieves vitrification, preventing ice crystal formation.
- Grid Storage: Transfer the vitrified grid under liquid nitrogen to a cryo-grid box for storage until imaging.
- Screening & Data Collection: Load the grid into the cryo-EM. Use a low-dose protocol to locate suitable ice areas. Collect micrographs at a defocus range of -1.5 to -3.0 µm. For structural analysis, collect thousands of particle images.
- Image Processing: Use software suites (RELION, cryoSPARC) for particle picking, 2D classification (to assess structural heterogeneity), and 3D reconstruction if sufficient symmetry or particle numbers exist.
Diagram 1: Cryo-EM Workflow for LNP Analysis
DSC for Analyzing LNP Thermal Properties
DSC measures heat flow into or out of a sample as a function of temperature, revealing phase transitions (e.g., gel-to-liquid crystalline) of lipid components within the LNP. This informs on lipid mixing, stability, and the potential impact of mRNA encapsulation on membrane properties.
Key Quantitative Data from DSC Studies of LNP Lipids
Table 2: DSC Thermal Transition Data for LNP Lipid Components and Formulations
| Sample | Phase Transition Temperature (Tm, °C) | Enthalpy Change (ΔH, kJ/mol) | Interpretation in LNP Context |
|---|---|---|---|
| DSPC (pure) | 55.0 ± 0.5 | 40.5 ± 2.0 | Reference Tm for saturated phospholipid. |
| Cholesterol (pure) | 41-42 (broad) | - | Can broaden and suppress phospholipid transitions. |
| Ionizable Lipid (e.g., DLin-MC3-DMA) | < -20 (broad) | Low | Remains fluid at physiological temps, aiding fusion. |
| LNP Bilayer (DSPC:Chol:Ionizable) | ~52.5 (broadened) | ~15.0 (reduced) | Broadening & ΔH reduction indicate lipid mixing & bilayer destabilization. |
| mRNA-loaded LNPs vs. Empty LNPs | ΔTm shift of -1 to -3°C | ΔH reduction ~10-20% | mRNA interaction can further disorder lipid packing. |
| LNP after Lyophilization | Tm may increase, peak may split | ΔH may change | Indicates potential lipid segregation or altered morphology. |
Detailed Protocol: DSC Measurement of LNP Phase Transitions
Objective: To characterize the thermal phase behavior of LNP formulations. Materials: Differential Scanning Calorimeter (e.g., TA Instruments DSC 250, Malvern MicroCal PEAQ-DSC), LNP sample (≥ 1 mg lipid), Reference buffer (identical to LNP buffer, e.g., 10 mM Tris, pH 7.4), Degassing system, Hermetic Tzero pans & lids. Procedure:
- Sample Preparation: Concentrate the LNP suspension via centrifugal filtration to a lipid concentration of 2-5 mM. Precisely measure the lipid concentration (via phosphate assay or HPLC). Degas both the sample and reference buffer for 10 minutes to remove dissolved gases.
- Loading: Using a micro-syringe, load ~20 µL of the concentrated LNP sample into a Tzero pan. Load an equal mass (± 0.1 mg) of reference buffer into a second pan. Seal both pans hermetically.
- Instrument Equilibration: Place the sample and reference pans in the DSC cell. Purge the cell with dry nitrogen (50 mL/min flow rate).
- Method Programming: Set the following temperature method:
- Equilibration: 10°C for 10 min.
- Scan 1 (Heating): 10°C to 90°C at a scan rate of 1-2°C/min.
- Isothermal: 90°C for 5 min.
- Scan 2 (Cooling): 90°C to 10°C at 1-2°C/min.
- Scan 3 (Re-heating): 10°C to 90°C at 1-2°C/min. (Identical to Scan 1).
- Data Acquisition: Run the program. The instrument records the differential heat flow (µcal/sec) required to maintain sample and reference at the same temperature.
- Data Analysis: Use the instrument software (e.g., TRIOS, MicroCal PEAQ-DSC) to analyze the thermogram. Process the data: subtract a buffer-buffer baseline, normalize for scan rate and lipid concentration. Identify transition temperatures (Tm, peak maximum) and calculate transition enthalpy (ΔH, by integrating the peak area). Compare heating scans 1 and 3 to assess reversibility.
Diagram 2: DSC Data Analysis Pathway for LNPs
The Scientist's Toolkit: Research Reagent Solutions
Table 3: Essential Materials for Advanced LNP Physicochemical Analysis
| Item / Reagent | Function / Role | Example / Note |
|---|---|---|
| Ionizable/Cationic Lipids | Core structural & functional component; binds mRNA, enables endosomal escape. | DLin-MC3-DMA, ALC-0315, SM-102. Critical for Cryo-EM structure & DSC thermogram. |
| Helper Lipids | Modulate bilayer structure, fluidity, and stability. | DOPE (promotes non-bilayer phases), DSPC (adds bilayer rigidity). Key for Cryo-EM morphology. |
| PEGylated Lipids | Stabilize particles, reduce aggregation, modulate pharmacokinetics. | DMG-PEG2000, ALC-0159. High % can form vesicles (Cryo-EM), affect Tm (DSC). |
| Stable Buffer Systems | Maintain LNP integrity and pH during analysis. | 10 mM Tris, pH 7.4, or Histidine buffer. Essential for reproducible DSC & Cryo-EM. |
| Cryo-EM Grids | Support film for vitrified sample. | Quantifoil (holey carbon) or UltraAufoil grids. Choice affects ice thickness and quality. |
| Vitrification System | Creates vitreous ice for Cryo-EM. | Vitrobot (FEI/Thermo) or GP2 (Leica). Controls blotting conditions (humidity, time, force). |
| Hermetic DSC Pans | Encloses sample for controlled pressure DSC runs. | TA Instruments Tzero pans. Prevents solvent evaporation during heating scan. |
| Phosphate Assay Kit | Quantifies total phospholipid concentration for DSC normalization. | Malachite Green-based kits. Enables accurate ΔH calculation per mol lipid. |
Application Notes
Within the critical pathway of lipid nanoparticle (LNP) formulation development for mRNA delivery, three essential in vitro functional assays serve as the primary gatekeepers for candidate selection: Transfection Efficiency, Cell Viability, and Protein Expression. These assays provide a quantitative, high-throughput triage system before committing to costly in vivo studies.
Transfection Efficiency measures the cellular uptake and endosomal escape of the mRNA-LNP complex, typically using a reporter gene like eGFP or luciferase. It directly informs on the LNP's ability to overcome extracellular and intracellular barriers.
Cell Viability (e.g., via MTT or ATP-based assays) assesses the cytotoxicity of both the LNP components and the delivered therapeutic payload. For LNP-mRNA formulations, separating lipid-induced toxicity from potential protein-mediated toxicity is crucial.
Protein Expression quantifies the functional output of the delivered mRNA, confirming not just cellular entry but also the integrity of the mRNA, its translation efficiency, and the correct post-translational modification of the protein. This is the ultimate proof of concept for the delivery system.
The interplay of these assays allows researchers to calculate a therapeutic index in vitro: high transfection and expression with minimal cytotoxicity. Optimizing LNP formulations (ionizable lipid pKa, PEG-lipid percentage, phospholipid choice) requires iterative testing using this triad of assays to balance efficacy with safety.
Protocols
Protocol 1: High-Throughput Analysis of Transfection Efficiency Using Flow Cytometry
Objective: Quantify the percentage of cells successfully expressing a reporter protein (eGFP) after treatment with mRNA-LNPs.
- Seed Cells: Plate HEK293T or other relevant cells in a 96-well plate at 20,000 cells/well in complete growth medium. Incubate for 24 hours.
- Prepare LNP-mRNA Complexes: Dilute candidate LNP-formulated eGFP mRNA in serum-free medium to desired concentration range (e.g., 0.1-500 ng mRNA/well). Include a positive control (commercial transfection reagent) and negative control (untreated cells).
- Transfect: Aspirate medium from cells and add 100 µL of LNP-mRNA complexes per well. Incubate for 4-6 hours.
- Replace Medium: Replace transfection mixture with fresh complete growth medium. Incubate for an additional 24-48 hours.
- Harvest and Analyze: Trypsinize cells, resuspend in PBS containing 2% FBS and 1 µg/mL DAPI (viability stain). Analyze using a flow cytometer. Gate on single, live (DAPI-negative) cells and measure fluorescence in the FITC/GFP channel. Transfection efficiency = (% eGFP-positive cells) x (Mean Fluorescence Intensity of positive population).
Protocol 2: Cell Viability Assessment via ATP-based Luminescence Assay
Objective: Determine the metabolic activity and cytotoxicity of LNP-mRNA formulations.
- Seed and Treat Cells: Follow Protocol 1, Steps 1-3, using both reporter mRNA and blank LNPs (no payload).
- Incubate: Continue incubation for total of 24 or 48 hours post-transfection.
- Equilibrate Assay Reagent: Thaw CellTiter-Glo 2.0 reagent and equilibrate to room temperature.
- Add Reagent: Add a volume of reagent equal to the volume of medium in each well (e.g., 100 µL). Shake orbital for 2 minutes to induce cell lysis.
- Incubate and Read: Allow plate to incubate at RT for 10 minutes to stabilize luminescent signal. Read luminescence on a plate reader.
- Calculate: Normalize luminescence of treated wells to the average of untreated control wells (set as 100% viability).
Protocol 3: Quantification of Protein Expression via ELISA
Objective: Precisely quantify the amount of functional protein expressed from LNP-delivered mRNA.
- Seed and Transfect: Seed cells in a 24-well plate (100,000 cells/well). Transfect with LNP-formulated mRNA encoding the protein of interest (e.g., human erythropoietin, hEPO) as in Protocol 1.
- Collect Supernatant/Cell Lysate: At 24, 48, and 72 hours post-transfection, collect cell culture supernatant (for secreted proteins) or lyse cells in RIPA buffer (for intracellular proteins). Centrifuge to remove debris.
- Prepare ELISA: Coat a high-binding 96-well ELISA plate with capture antibody specific to the target protein in carbonate coating buffer overnight at 4°C.
- Block and Incubate: Block plate with 3% BSA in PBS. Add samples and serially diluted protein standard in duplicate. Incubate for 2 hours at RT.
- Detect: Wash plate, add detection antibody (biotinylated), followed by streptavidin-HRP conjugate. Develop using TMB substrate. Stop reaction with 1M H₂SO₄.
- Quantify: Read absorbance at 450 nm. Calculate protein concentration in samples using the standard curve.
Table 1: Representative Data from Parallel Transfection & Viability Assay
| LNP Formulation | mRNA Dose (ng/well) | % eGFP+ Cells | MFI (a.u.) | Viability (% of Ctrl) |
|---|---|---|---|---|
| LNP-A (Optimal) | 50 | 95.2 ± 3.1 | 15,840 | 98.5 ± 5.2 |
| LNP-B (High Tox) | 50 | 88.7 ± 4.5 | 12,150 | 42.3 ± 6.1 |
| LNP-C (Low Eff) | 50 | 23.1 ± 5.6 | 2,340 | 92.1 ± 4.8 |
| Commercial Reagent | 50 | 78.9 ± 2.8 | 9,870 | 75.4 ± 7.3 |
| Untreated Control | 0 | 0.1 ± 0.1 | 110 | 100 ± 3.0 |
Table 2: Protein Expression (ELISA) Kinetics
| Formulation | Time (h) | Protein Concentration (ng/mL) |
|---|---|---|
| LNP-A | 24 | 45.2 ± 6.7 |
| LNP-A | 48 | 210.5 ± 22.1 |
| LNP-A | 72 | 185.3 ± 18.9 |
| LNP-C | 48 | 12.8 ± 3.2 |
| Untreated | 48 | BDL (Below Detection Limit) |
Visualizations
Title: Three-Assay Triage Workflow for LNPs
Title: mRNA Delivery & Expression Pathway
The Scientist's Toolkit
| Research Reagent / Material | Function in LNP-mRNA Assays |
|---|---|
| Ionizable Cationic Lipid | Core LNP component that complexes with mRNA, promotes endosomal escape via protonation. |
| PEG-lipid | Provides steric stabilization, controls LNP size, and influences pharmacokinetics. |
| HEK293T Cells | A highly transferable mammalian cell line, a standard workhorse for in vitro screening. |
| eGFP or Luciferase Reporter mRNA | Encodes easily detectable protein to quantify transfection efficiency without cell lysis (GFP) or with high sensitivity (Luc). |
| CellTiter-Glo 2.0 Assay | Luminescent ATP-based assay quantifying metabolically active cells for viability assessment. |
| Flow Cytometer | Instrument for quantifying percentage of GFP-positive cells and fluorescence intensity per cell. |
| DAPI (4',6-diamidino-2-phenylindole) | Cell-impermeant DNA dye used to stain dead cells for exclusion in flow cytometry. |
| ELISA Kit (Target-specific) | Provides matched antibody pairs and standards for precise quantification of expressed protein. |
| Plate Reader (Multimode) | For reading luminescence (viability), fluorescence (GFP), and absorbance (ELISA) in microplates. |
| Polycarbonate Membrane Extruder | Essential for producing monodisperse, stable LNPs of defined size (e.g., 80-100 nm). |
This application note is framed within a broader thesis on optimizing lipid nanoparticle (LNP) formulations for mRNA delivery. As the field advances, researchers face a critical choice: utilizing commercially available, standardized LNP kits or developing custom, tailored formulations. This document provides a comparative analysis, detailed protocols, and essential tools for conducting rigorous, head-to-head benchmarking experiments to inform this decision.
Quantitative Comparative Analysis
Table 1: Key Performance Metrics of Commercial Kits vs. Custom LNPs
| Performance Metric | Leading Commercial Kits (e.g., Invitrogen TrueCut, Sigma LNP Starter Kit) | Custom LNP Formulations | Recommended Assay |
|---|---|---|---|
| Average Particle Size (nm) | 70 - 100 nm (low polydispersity, <0.2) | 50 - 150 nm (adjustable, PDI varies) | Dynamic Light Scattering |
| Encapsulation Efficiency (%) | 85% - 95% (consistent) | 70% - 99% (process-dependent) | Ribogreen Assay |
| mRNA Purity (A260/A280) | Dependent on input mRNA; kit does not purify | Dependent on input mRNA & process | UV Spectrophotometry |
| Zeta Potential (mV) | -2 to -10 mV (slightly negative) | -30 to +20 mV (tailorable) | Phase Analysis Light Scattering |
| In Vitro Transfection Efficiency (RLU/mg protein) | High in standard cells (e.g., HEK293) | Can be optimized for difficult cells (e.g., primary) | Luciferase Reporter Assay |
| Storage Stability (4°C) | 1-3 months (as claimed) | Weeks to months (needs validation) | Size & EE tracking over time |
| Critical Process Time | ~1 hour (rapid, standardized) | 2 - 6 hours (optimization required) | - |
| Cost per Dose (Research Scale) | $$$ (Higher per dose) | $ (Lower at scale) | - |
Table 2: Functional In Vitro & In Vivo Comparison
| Parameter | Commercial Kits | Custom LNPs | Benchmarking Model |
|---|---|---|---|
| Cell Type Tropism | Often broad, non-specific | Can be tuned with ionizable lipids/PEG-lipids | In vitro panel: HEK293, HepG2, Dendritic Cells |
| Protein Expression Kinetics | Peak at 24-48 hrs (standard) | Peak time adjustable via lipid composition | Time-course luciferase assay |
| In Vivo Delivery (Mice, IV) | Primarily liver (≥80%) | Liver, spleen, lung; targeting possible | Bioluminescence imaging (IVIS) |
| Immunogenicity Profile | Typically low, but PEG may induce anti-PEG Abs | Can be designed to minimize reactogenicity | Cytokine ELISA (IL-6, TNF-α) |
| Scalability Path | Limited by kit supply; process locked | Directly scalable (microfluidics/T-junction) | - |
Experimental Protocols for Benchmarking
Protocol 3.1: Parallel LNP Formulation & Characterization
Objective: To prepare and physically characterize LNPs from a commercial kit and a custom formulation for direct comparison.
Materials:
- Commercial Kit: e.g., Invitrogen TrueCut Cas9 Protein LNP Kit.
- Custom Lipids: Ionizable Lipid (e.g., DLin-MC3-DMA), DSPC, Cholesterol, PEG-lipid (DMG-PEG2000).
- mRNA: Firefly luciferase mRNA (cleanCap, modified).
- Equipment: Microfluidic mixer (e.g., NanoAssemblr Ignite) or syringe pump, pH meter, DLS instrument, microcentrifuge.
Procedure:
- Commercial Kit LNP: Follow manufacturer's protocol. Typically involves mixing lipid stock in ethanol with mRNA in aqueous buffer at a specific flow rate ratio. Dialyze or buffer exchange per instructions.
- Custom LNP: Prepare ethanolic lipid mix (ionizable lipid:DSPC:Chol:PEG-lipid = 50:10:38.5:1.5 mol%). Prepare mRNA in 50 mM citrate buffer (pH 4.0). Using a microfluidic device, mix the two phases at a 3:1 aqueous:ethanol volumetric flow rate (total flow rate 12 mL/min). Collect LNPs.
- Buffer Exchange: Dialyze both LNP preparations against 1X PBS (pH 7.4) for 2 hours at 4°C using a 20kDa MWCO dialysis cassette.
- Characterization:
- Size & PDI: Dilute LNPs 1:100 in PBS, measure by DLS.
- Encapsulation Efficiency: Use Quant-iT RiboGreen RNA assay. Measure fluorescence (Ex/Em 480/520 nm) of LNP samples with and without 1% Triton X-100 detergent. Calculate %EE = [1 - (Free RNA/Total RNA)] x 100.
Protocol 3.2: In Vitro Transfection Efficiency Benchmarking
Objective: To compare functional mRNA delivery in a cell culture model.
Materials: HEK293 cells, DMEM+10% FBS, 96-well plate, luciferase assay system.
Procedure:
- Seed HEK293 cells at 20,000 cells/well in a 96-well plate 24 hours prior.
- Dilute both LNP formulations to a final mRNA dose of 50 ng/well in serum-free medium.
- Incubate cells with LNPs for 4-6 hours, then replace with fresh complete medium.
- At 24 hours post-transfection, lyse cells and measure luciferase activity using a plate reader. Normalize to total protein (BCA assay).
Protocol 3.3: In Vivo Biodistribution Pilot Study
Objective: To compare organ tropism in a murine model.
Materials: C57BL/6 mice, Cy5-labeled mRNA, IVIS Spectrum imaging system.
Procedure:
- Formulate LNPs (commercial vs. custom) with Cy5-labeled mRNA using Protocol 3.1.
- Inject mice (n=3 per group) intravenously with 5 µg mRNA dose.
- At 6-hour post-injection, euthanize mice and harvest major organs (liver, spleen, lungs, heart, kidneys).
- Image ex vivo organs using IVIS. Quantify average radiant efficiency ([p/s/cm²/sr]/[µW/cm²]) for each organ.
Diagrams for Experimental Workflow & Analysis
Title: LNP Formulation Benchmarking Workflow
Title: LNP-mRNA Delivery & Mechanism Pathway
The Scientist's Toolkit: Research Reagent Solutions
| Reagent / Material | Function in Benchmarking | Example Vendor/Catalog |
|---|---|---|
| Ionizable Lipid (DLin-MC3-DMA) | Core component of custom LNPs; enables endosomal escape via protonation. | MedChemExpress HY-133128 |
| PEG-lipid (DMG-PEG2000) | Controls LNP size, stability, and surface properties; influences pharmacokinetics. | Avanti Polar Lipids 880151 |
| CleanCap mRNA | High-purity, co-transcriptionally capped mRNA; standardizes input for fair comparison. | TriLink BioTechnologies L-7601 |
| Quant-iT RiboGreen Assay | Fluorescent quantification of both encapsulated and free RNA for %EE calculation. | Thermo Fisher Scientific R11490 |
| Microfluidic Mixer (NanoAssemblr) | Enables reproducible, scalable LNP formation via rapid mixing of lipid and aqueous phases. | Precision NanoSystems |
| Dynamic Light Scattering (DLS) Instrument | Measures particle size (diameter), polydispersity index (PDI), and zeta potential. | Malvern Panalytical Zetasizer |
| Luciferase Reporter mRNA | Standardized functional readout for transfection efficiency in vitro and in vivo. | TriLink BioTechnologies L-6101 |
| In Vivo Imaging System (IVIS) | Enables non-invasive longitudinal tracking and ex vivo biodistribution analysis. | PerkinElmer IVIS Spectrum |
| Sterile, APEX Process Vials | Critical for aseptic formulation and storage of LNPs under GLP-like conditions. | Thermo Fisher Scientific 6780-8020 |
Critical Quality Attributes (CQAs) for Preclinical and Clinical Development
Within the broader thesis on LNP formulation for mRNA delivery, defining and controlling Critical Quality Attributes (CQAs) is paramount for ensuring the safety, efficacy, and consistency of novel therapeutics across preclinical and clinical stages. CQAs are physical, chemical, biological, or microbiological properties that must be within an appropriate limit, range, or distribution to ensure the desired product quality. This document outlines the key CQAs for LNP-mRNA products, provides detailed protocols for their assessment, and presents essential research tools.
Key CQAs for LNP-mRNA Formulations
The following table summarizes the primary CQAs, their rationale, and typical analytical methods.
Table 1: Critical Quality Attributes for LNP-mRNA Development
| CQA Category | Specific Attribute | Preclinical Focus | Clinical/CMC Focus | Impact on Safety/Efficacy |
|---|---|---|---|---|
| Identity & Purity | mRNA Sequence & Integrity | Confirmation of correct coding sequence; Agarose gel/RIN | qRT-PCR, sequencing, capillary electrophoresis (CE) | Ensures expression of correct therapeutic protein. |
| LNP Lipid Composition | Qualitative confirmation (LC-MS) | Quantitative assay for each lipid component (HPLC-CAD/ELSD) | Impacts stability, delivery efficiency, and PK/PD. | |
| Potency | In Vitro Transfection Efficiency | Reporter gene expression (e.g., luciferase) in relevant cell lines | Standardized cell-based bioassay (e.g., ELISA for protein output) | Direct measure of biological activity; links to clinical dose. |
| Encapsulation Efficiency | Ribogreen assay pre/post detergent | Refined Ribogreen or dye exclusion assays | Protects mRNA; affects potency, stability, and immunogenicity. | |
| Quantity | mRNA Concentration | UV-Vis spectroscopy (A260) | Validated UV-Vis or fluorescence-based assays | Critical for accurate dosing. |
| Particle Concentration | NTA or TRPS | Validated NTA or analytical ultracentrifugation | Relates to dose and particle clearance kinetics. | |
| Physical Attributes | Particle Size & PDI | Dynamic Light Scattering (DLS) | Validated DLS, corroborated by complementary techniques (e.g., MALS) | Affects biodistribution, cellular uptake, and stability. |
| Zeta Potential | Electrophoretic Light Scattering | Monitored for process consistency | Influences colloidal stability and cellular interactions. | |
| Morphology | TEM or cryo-EM imaging | TEM for characterization | Related to structural stability and formulation process. | |
| Impurities & Safety | Lipid Degradation Products | Monitor peroxides, lysolipids | Validated HPLC methods for related substances | Impacts stability and potential toxicity. |
| Residual Process Impurities | Assessment of solvent, buffer residues | ICH Q3C/Q3D compliant testing (GC, ICP-MS) | Direct safety concern. | |
| Bioburden & Endotoxins | LAL test, sterility testing | Sterility, endotoxin as release tests | Critical safety attributes. | |
| Stability | mRNA Integrity on Storage | Gel electrophoresis, HPLC | Stability-indicating methods (CE, HPLC) | Ensures shelf-life and maintained potency. |
| Particle Aggregation | DLS size trend, visual inspection | Subvisible particle analysis (MFI) | Indicator of physical instability. | |
| In Vivo Expression Kinetics | Bioluminescence imaging (BLI), ELISA in animals | Pharmacodynamic biomarkers in clinical trials | Links CQAs to functional performance. |
Detailed Experimental Protocols
Protocol 1: Determination of mRNA Encapsulation Efficiency using the Ribogreen Assay
Purpose: To quantify the percentage of mRNA encapsulated within LNPs, distinguishing it from free mRNA. Principle: The fluorescent dye Quant-iT Ribogreen binds preferentially to free RNA, with a >1000-fold fluorescence enhancement. Detergent disruption of the LNP allows measurement of total RNA. Materials: See "The Scientist's Toolkit" section. Procedure:
- Sample Preparation: Dilute the LNP-mRNA formulation in 1X TE buffer to a target RNA concentration within the assay's linear range (e.g., ~10-100 ng/mL). Prepare two sets of triplicates.
- Free RNA Measurement (A): To one set, add Ribogreen reagent directly per manufacturer's instructions. Incubate 5 min protected from light. Measure fluorescence (ex: ~480 nm, em: ~520 nm).
- Total RNA Measurement (B): To the second set, first add a volume of 10% Triton X-100 (or other suitable detergent) to achieve a final concentration of ~1-2%. Incubate 5-10 min to disrupt LNPs. Add Ribogreen reagent and measure fluorescence as in step 2.
- Standard Curve: Prepare a series of free mRNA standards (0-100 ng/mL) in 1X TE buffer with and without detergent. Process with Ribogreen to generate two standard curves.
- Calculations:
- Calculate free RNA concentration from curve A.
- Calculate total RNA concentration from curve B.
- Encapsulation Efficiency (%) = [1 - (Free RNA Concentration / Total RNA Concentration)] x 100.
Protocol 2: Characterization of Particle Size and PDI by Dynamic Light Scattering (DLS)
Purpose: To measure the hydrodynamic diameter (Z-average) and polydispersity index (PDI) of LNP formulations. Materials: LNP-mRNA sample, appropriate dilution buffer (e.g., 1x PBS, pH 7.4), DLS instrument (e.g., Malvern Zetasizer). Procedure:
- Sample Dilution: Dilute the LNP sample with filtered (0.1 µm) buffer to achieve an optimal scattering intensity (typically 50-200 µg/mL lipid concentration). Avoid introducing bubbles.
- Instrument Setup: Equilibrate the cuvette chamber to 25°C. Use disposable cuvettes or rigorously clean quartz cuvettes.
- Measurement Parameters: Set the instrument to measure size by DLS, with the material refractive index and absorption parameters set appropriately for lipids. Set the dispersant viscosity and refractive index for the buffer (e.g., water or PBS).
- Run Measurement: Load the diluted sample into a clean cuvette, place in the instrument, and run the measurement. Perform a minimum of 3-12 sequential runs per sample. The instrument will calculate the Z-average (intensity-weighted mean diameter) and the PDI (a dimensionless measure of breadth, where <0.1 is highly monodisperse, 0.1-0.2 is moderate, and >0.2 is broad).
- Data Analysis: Report the Z-average and PDI as the mean ± standard deviation of at least three independent sample preparations. Include the measurement quality diagnostic (e.g., correlation function fit).
Protocol 3:In VitroPotency Assay using Reporter Gene Expression
Purpose: To assess the functional delivery and translational activity of LNP-mRNA in a cell-based system. Materials: HEK293 or other relevant cell line, LNP-mRNA encoding firefly luciferase, cell culture reagents, luciferase assay kit, multiwell plate reader. Procedure:
- Cell Seeding: Seed cells in a 96-well plate at a density that will reach 70-90% confluency at the time of assay (e.g., 10,000 cells/well for HEK293) in complete growth medium. Incubate 18-24 hrs.
- Dosing: Prepare serial dilutions of the LNP-mRNA test article and a reference standard in serum-free medium. Replace cell medium with the dosing solutions. Include a negative control (cells only) and a vehicle control (empty LNPs). Incubate for a defined period (e.g., 4-24 hrs).
- Medium Change (Optional): After 4-6h, replace dosing medium with fresh complete medium to reduce cytotoxicity. Incubate until the total post-transfection time reaches the optimal window (e.g., 24h).
- Luciferase Measurement: Lyse cells according to the luciferase assay kit instructions (e.g., add 1X passive lysis buffer, shake 15 min). Transfer lysate to an opaque white plate. Inject luciferase substrate and immediately measure luminescence on a plate reader.
- Data Analysis: Subtract background luminescence from control wells. Plot relative luminescence units (RLU) vs. mRNA or lipid dose. Calculate the EC50 (half-maximal effective concentration) or the specific activity (RLU/ng mRNA) relative to the reference standard.
Visualizations
Diagram 1: LNP-mRNA CQA Assessment Workflow
Diagram 2: Ribogreen Encapsulation Assay Principle
The Scientist's Toolkit
Table 2: Key Research Reagent Solutions for LNP-mRNA CQA Analysis
| Item | Function/Benefit | Example Product/Category |
|---|---|---|
| Quant-iT Ribogreen Assay Kit | Fluorometric quantification of free vs. total RNA for encapsulation efficiency. Highly sensitive, specific for RNA. | Thermo Fisher Scientific, R11490 |
| In Vitro Transcription Kit | High-yield production of research-grade mRNA with modified nucleotides (e.g., N1-methylpseudouridine) for formulation studies. | NEB HiScribe T7, Trilink CleanCap |
| Lipid Standards (Ionizable, PEG, etc.) | Certified reference standards for quantitative HPLC analysis of LNP lipid components and degradation products. | Avanti Polar Lipids, Corden Pharma |
| Dynamic Light Scattering (DLS) Instrument | Measures hydrodynamic particle size (Z-average) and Polydispersity Index (PDI) for colloidal characterization. | Malvern Panalytical Zetasizer, Wyatt DynaPro |
| Cell-based Potency Assay Reagents | Reporter systems (luciferase, GFP) or target-specific ELISA kits to measure functional mRNA delivery and translation. | Promega Luciferase Assay, R&D Systems ELISA |
| Capillary Electrophoresis (CE) System | High-resolution, stability-indicating method for analyzing mRNA integrity, purity, and size variants. | Agilent Fragment Analyzer, SCIEX PA 800 Plus |
| Sterile, Nuclease-free Buffers & Consumables | Essential for preventing sample degradation and contamination during analytical preparation. | Ambion nuclease-free water, DEPC-treated tubes |
| Endotoxin Detection Kit (LAL) | Sensitive detection of bacterial endotoxins, a critical safety attribute for parenteral formulations. | Lonza PyroGene, Charles River Endosafe |
Within the broader thesis on LNP formulation for mRNA delivery, the selection of the ionizable lipid is a critical determinant of efficacy, tolerability, and manufacturability. This application note presents a comparative analysis of three benchmark ionizable lipids: DLin-MC3-DMA (MC3), SM-102, and ALC-0315, focusing on their chemical attributes, formulation performance, in vivo delivery efficiency, and tolerability profiles. Data is compiled from recent literature and public regulatory documents to guide formulation scientists.
Table 1: Chemical and Physicochemical Properties
| Property | DLin-MC3-DMA (MC3) | SM-102 | ALC-0315 | Notes / Implications |
|---|---|---|---|---|
| Chemical Class | Diacyl lipid (linoleyl chains) | Diacyl lipid (heptadecanoyl chain) | Diacyl lipid (branched tails) | Branching influences packing & biodegradability. |
| pKa (Apparent) | ~6.4 - 6.6 | ~6.5 - 6.7 | ~6.2 - 6.4 | Optimal for endosomal escape; measured in formulated LNPs. |
| TC50 (Hemolysis) | ~2.5 µg/mL | ~3.1 µg/mL | Data limited | Measure of membrane destabilization potential. |
| LNP Size (nm) | 70-100 | 70-90 | 80-100 | Standard formulation parameters yield consistent sizes. |
| PDI | <0.1 | <0.1 | <0.15 | Indicates monodisperse particle distribution. |
| Encapsulation % | >95% | >95% | >90% | Standard microfluidic mixing achieves high efficiency. |
Table 2: In Vivo Performance (Rodent Models, i.m. administration)
| Metric | DLin-MC3-DMA (MC3) | SM-102 | ALC-0315 | Experimental Context |
|---|---|---|---|---|
| Peak Protein Expr. | 1.0x (Reference) | 2-3x Higher | ~1.5x Higher | Firefly Luciferase mRNA, dose-matched, 24-48h post-injection. |
| Expression Duration | ~7-10 days | ~7-10 days | ~7-10 days | Similar pharmacokinetics for intramuscular delivery. |
| Local Reactogenicity | Moderate | Moderate-High | Lower | Assessed by histopathology & cytokine markers (IL-6, TNF-α). |
| Systemic Cytokines | Low | Elevated (dose-dep.) | Low | SM-102 shows higher IFN-γ and IL-6 at high doses. |
Table 3: Clinical & Regulatory Status (Key Applications)
| Lipid | Approved/Authorized Product | Route | Notable Features |
|---|---|---|---|
| DLin-MC3-DMA | Onpattro (patisiran) | i.v. | First FDA-approved LNP; proven safety record for siRNA. |
| SM-102 | Moderna COVID-19 Vaccine | i.m. | Enables high potency mRNA delivery; scalable synthesis. |
| ALC-0315 | Pfizer-BioNTech COVID-19 Vaccine | i.m. | Combined with ALC-0159; favorable tolerability profile. |
Experimental Protocols
Protocol 3.1: Microfluidic Formulation of mRNA-LNPs
Objective: To prepare reproducible, monodisperse LNPs encapsulating mRNA using ionizable lipids MC3, SM-102, or ALC-0315.
Reagents:
- Ionizable lipid (MC3, SM-102, or ALC-0315)
- Helper phospholipid (DSPC)
- Cholesterol
- PEG-lipid (DMG-PEG2000 or ALC-0159)
- mRNA (e.g., Luciferase or eGFP reporter)
- Ethanol (USP grade)
- Sodium Acetate Buffer (25 mM, pH 4.0)
- DPBS, pH 7.4 (Dulbecco's Phosphate Buffered Saline)
Equipment:
- Microfluidic mixer (e.g., NanoAssemblr Ignite, Precision NanoSystems; or custom chip)
- Syringe pumps (2)
- Gas-tight glass syringes (2)
- Slide-A-Lyzer dialysis cassettes or TFF system
- Dynamic Light Scattering (DLS) / Zetasizer
- Ribogreen Assay Kit
Procedure:
- Lipid Stock Preparation: Dissolve ionizable lipid, DSPC, cholesterol, and PEG-lipid in ethanol at a molar ratio of 50:10:38.5:1.5. Total lipid concentration typically 5-10 mM.
- Aqueous Phase Preparation: Dilute mRNA in sodium acetate buffer (25 mM, pH 4.0) to a target concentration (e.g., 0.1 mg/mL). Keep on ice.
- Microfluidic Mixing:
- Load the ethanolic lipid solution into one gas-tight syringe.
- Load the aqueous mRNA solution into a second gas-tight syringe.
- Mount syringes on separate pumps. Set flow rate parameters (e.g., Total Flow Rate (TFR) = 12 mL/min, Flow Rate Ratio (FRR) = 3:1 (aqueous:ethanol)). Common TFR range: 10-15 mL/min.
- Initiate mixing. The output is collected in a tube, resulting in instantaneous LNP formation.
- Buffer Exchange & Dialysis:
- Immediately dilute the crude LNP formulation in at least 4x volume of PBS, pH 7.4.
- Dialyze against a large volume of PBS (≥1000x) for 4-18 hours at 4°C using a dialysis cassette (MWCO 10kDa) or perform Tangential Flow Filtration (TFF).
- Analysis:
- Size & PDI: Dilute dialyzed LNPs 1:50 in PBS, measure by DLS.
- Encapsulation Efficiency: Use Ribogreen assay. Measure fluorescence of LNPs in PBS (F1) and after addition of 0.5% Triton X-100 (F2). EE% = [1 - (F1/F2)] * 100.
- Storage: Filter-sterilize (0.22 µm) and store at 4°C for short-term use or -80°C for long-term.
Protocol 3.2:In VivoPotency and Expression Kinetics (Mouse Intramuscular)
Objective: To compare the potency and duration of protein expression mediated by LNPs formulated with different ionizable lipids.
Materials:
- Formulated mRNA-LNPs (encoding Luciferase, 0.5 µg mRNA dose per mouse)
- Female BALB/c mice, 6-8 weeks old (n=5 per group)
- In vivo Imaging System (IVIS)
- D-Luciferin potassium salt (15 mg/mL in PBS)
- Isoflurane anesthesia system
- Caliper for measuring local reaction
Procedure:
- Dosing: Anaesthetize mice. Inject 50 µL of LNP formulation (containing 0.5 µg mRNA) intramuscularly into the tibialis anterior muscle of the right hind leg. Administer control (PBS) to a separate group.
- Imaging Time Course: At 4, 24, 48, 96, 168, and 240 hours post-injection, administer D-Luciferin (150 mg/kg, i.p.).
- Data Acquisition: Anesthetize mice 10 minutes post-luciferin injection. Place in IVIS chamber, acquire bioluminescent images (1-min exposure, medium binning). Region of Interest (ROI) analysis should be performed over the injection site and quantified as total flux (photons/sec).
- Local Reactivity Scoring: Visually inspect and gently palpate the injection site daily. Score on a scale of 0 (no reaction) to 3 (severe swelling/redness). Record weights daily.
- Analysis: Plot total flux vs. time to determine peak expression and kinetics. Compare area-under-the-curve (AUC) for overall potency between lipid groups.
Visualizations
Ionizable Lipid Mechanism of Endosomal Escape
mRNA-LNP Microfluidic Formulation Workflow
The Scientist's Toolkit
Table 4: Key Research Reagent Solutions for LNP Formulation
| Reagent / Material | Function / Role | Example Product / Note |
|---|---|---|
| Ionizable Lipids | Core functional lipid; enables encapsulation & endosomal escape. | DLin-MC3-DMA, SM-102, ALC-0315. Critical variable in study. |
| Helper Phospholipid | Provides structural integrity to the LNP bilayer. | DSPC (1,2-distearoyl-sn-glycero-3-phosphocholine). |
| Cholesterol | Stabilizes bilayer, enhances packing, and improves circulation. | Pharmaceutical grade (≥99%). |
| PEG-Lipid | Controls particle size, improves stability, reduces opsonization. | DMG-PEG2000 or ALC-0159. Content tunes pharmacokinetics. |
| mRNA Template | Cargo; encodes target protein. | In vitro transcribed, purified, cap1, modified nucleotides (e.g., N1-methylpseudouridine). |
| Microfluidic Device | Enables rapid, reproducible mixing for monodisperse LNPs. | NanoAssemblr chips, staggered herringbone mixers. |
| Ribogreen Assay | Fluorescent quantitation of RNA encapsulation efficiency. | Requires detergent lysis step to expose unencapsulated RNA. |
| Dynamic Light Scattering | Measures particle hydrodynamic diameter, PDI, and zeta potential. | Malvern Zetasizer, Brookhaven Instruments. |
Conclusion
Successful LNP-mRNA formulation requires a deep integration of foundational science, rigorous methodology, systematic optimization, and comprehensive validation. This guide has outlined the journey from understanding the core lipid chemistry and self-assembly principles, through mastering reproducible fabrication protocols, to solving practical challenges and establishing robust characterization benchmarks. The future of LNP-mRNA delivery lies in the rational design of novel ionizable lipids with improved tissue specificity and safety profiles, advanced manufacturing for global scalability, and the application of these versatile platforms beyond vaccines to treat genetic diseases, cancers, and beyond. By adhering to these structured protocols and analytical frameworks, researchers can accelerate the development of the next generation of mRNA therapeutics.