DNA Nanonetworks: Decoding Molecular Communication Principles for Next-Gen Biomedical Applications
This article provides a comprehensive analysis of the fundamental principles and contemporary advancements in DNA-based molecular communication networks.
DNA Nanonetworks: Decoding Molecular Communication Principles for Next-Gen Biomedical Applications
Abstract
This article provides a comprehensive analysis of the fundamental principles and contemporary advancements in DNA-based molecular communication networks. Targeted at researchers, scientists, and drug development professionals, it systematically explores the core paradigms of molecular signaling, current methodologies for constructing and programming DNA nanonetworks, critical challenges in signal reliability and noise, and rigorous validation frameworks. The synthesis offers a roadmap for leveraging these bio-inspired systems in targeted drug delivery, in-body sensing, and advanced diagnostics.
The Language of Life: Foundational Principles of Molecular Communication
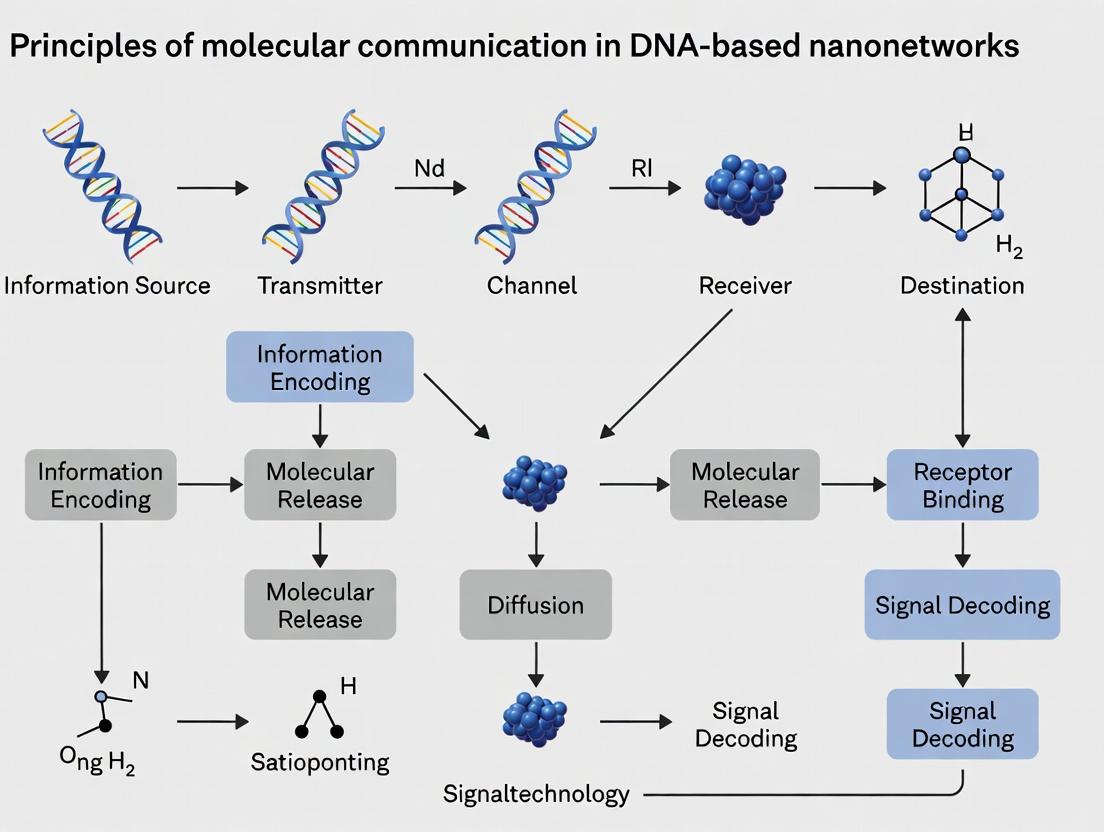
This document serves as a foundational chapter for a broader thesis on the Principles of Molecular Communication in DNA-Based Nanonetworks Research. It establishes molecular communication (MC) as a bio-inspired paradigm where information is encoded into molecules rather than electromagnetic waves. The transition from observing natural systems (e.g., quorum sensing, neural synapses) to engineering synthetic nanonetworks is critical for applications in targeted drug delivery, in-body monitoring, and programmable chemistry.
Core Principles & Quantitative Framework
Molecular communication mechanisms are characterized by their propagation, reception, and signal processing modalities.
Table 1: Quantitative Comparison of Molecular Communication Modalities
| Modality | Propagation Medium | Typical Signaling Molecule | Approx. Diffusion Coefficient (µm²/s) | Effective Range | Data Rate (bps) |
|---|---|---|---|---|---|
| Diffusion-based | Aqueous (e.g., body fluid) | Ca²⁺ ions, cAMP | 100 - 1000 | µm to mm | < 0.01 |
| Motor-based | Microtubule/Filament Track | Vesicles (Kinesin-driven) | N/A (Active Transport) | µm to cm | ~ 0.1 - 1 |
| Bacterial | Fluid (planktonic) or Surface | AHL (Quorum Sensing) | ~ 500 | µm to m | Very Low (<0.001) |
| DNA-based | Aqueous Buffer | ssDNA, dsDNA strands | ~ 100 - 500 | nm to µm | ~ 0.001 - 0.1 |
| Extracellular Vesicle | Tissue, Bloodstream | Liposomes, Exosomes | Variable | mm to m | Low (~0.01) |
Table 2: Key Performance Metrics in Engineered DNA Nanonetworks (Recent Experimental Data)
| Metric | Value Range | Experimental Condition | Reference Year |
|---|---|---|---|
| Inter-node Distance | 50 nm - 2 µm | Lipid bilayer-coupled DNA origami | 2023 |
| Signal Propagation Delay | Seconds to Hours | DNA strand displacement cascade | 2024 |
| Bit Error Rate (BER) | 10⁻³ - 10⁻⁵ | Encoded DNA barcodes in microfluidic channel | 2023 |
| Channel Capacity | ~ 1-10 bits/hr | Multi-hop enzymatic amplification | 2022 |
Experimental Protocols for DNA-Based MC
Protocol 3.1: Demonstrating Basic Binary Communication via DNA Strand Displacement
Objective: To transmit a single bit (1/0) between a transmitting and a receiving node constructed from DNA complexes. Reagents:
- Fuel Strand (F): Represents bit '1'. A long DNA strand complementary to the gate.
- Gate Complex (G): A double-stranded DNA complex with an overhang (toehold) and a quencher-fluorophore pair.
- Buffer: TAE/Mg²⁺ buffer (12.5 mM MgCl₂, pH 8.3). Procedure:
- Preparation: Synthesize and HPLC-purify all DNA strands. Anneal Gate Complex (G) in thermocycler.
- Baseline Emission: In a quartz cuvette, add 100 nM G in 100 µL buffer. Measure fluorescence (λex/λem) for 300s.
- Signal Transmission: Introduce 150 nM Fuel Strand (F) into the cuvette. Rapidly mix.
- Data Acquisition: Monitor fluorescence intensity increase (due to strand displacement and fluorophore separation from quencher) for 1800s. The rate and magnitude of change constitute the received signal.
- Control (Bit '0'): Repeat steps with a non-complementary "null" strand.
Protocol 3.2: Multi-Hop Communication Using Enzyme-Based Signal Amplification
Objective: To relay a molecular signal across three sequential DNA logic gates with intermediate amplification. Reagents: DNA gates (G1, G2, G3), Input Trigger (I1), Nicking Enzyme (e.g., Nt.BbvCI), dNTPs, Fluorescent Reporter Probe (FRP). Procedure:
- Assembly: Immobilize G1, G2, G3 in separate but interconnected microfluidic chambers.
- Priming: Load all chambers with buffer containing nicking enzyme and dNTPs.
- Initiation: Introduce I1 into Chamber 1. I1 displaces an output strand from G1, which acts as a primer for the enzyme to replicate a new strand.
- Relay: The newly synthesized strand in Chamber 1 flows to Chamber 2, triggering the same displacement/amplification cycle on G2.
- Cascade & Readout: The process repeats to Chamber 3. The final output from G3 activates the Fluorescent Reporter Probe (FRP). Measure real-time fluorescence in Chamber 3.
Visualizations of Signaling Pathways and Workflows
Title: General Molecular Communication System Block Diagram
Title: DNA Strand Displacement Reception Protocol
The Scientist's Toolkit: Research Reagent Solutions
Table 3: Essential Research Reagents for DNA-Based MC Experiments
| Item / Reagent | Primary Function in MC Research | Key Characteristics / Notes |
|---|---|---|
| HPLC-Purified DNA Oligos | Construction of logic gates, fuel strands, and signal carriers. | High purity (>95%) critical for predictable reaction kinetics and low noise. |
| DNA Modification Kits (Fluorophore, Quencher, Biotin) | Labeling molecules for detection, tracking, or surface immobilization. | Enables FRET-based signaling and node functionalization. |
| Nicking Enzymes (e.g., Nt.BbvCI) | Provides signal amplification in multi-hop networks. | Cuts a specific strand of dsDNA, enabling isothermal replication of output signals. |
| Microfluidic Device (PDMS/Glass) | Creates controlled micro-environments for network compartmentalization. | Allows fluidic coupling of nodes while limiting uncontrolled diffusion. |
| Membrane Scaffolds (e.g., Lipid Bilayers, DNA Origami Tiles) | Provides a structural framework for arranging transmitter/receiver components. | Enforces spatial organization and reduces distance between nodes. |
| Real-Time Fluorimeter / qPCR Machine | Quantitative, time-resolved measurement of molecular signal reception. | Essential for kinetic analysis of bit transmission and channel characterization. |
| Magnetic Beads (Streptavidin-coated) | Immobilization and purification of biotinylated DNA complexes. | Used to create stationary nodes in flow-based experimental setups. |
| TAE/Mg²⁺ Buffer (with BSA) | Standard reaction medium for DNA nanotechnology. | Mg²⁺ stabilizes DNA structures; BSA reduces non-specific surface adsorption. |
Within the emerging field of DNA-based nanonetworks, molecular communication enables engineered nanostructures to coordinate for applications in targeted drug delivery, distributed computing, and in-situ biosensing. This whitepaper, framed within a broader thesis on the Principles of Molecular Communication in DNA-Based Nanonetworks Research, details three core signaling paradigms: Diffusion-Based, Active Transport, and Catalytic Relay. Each represents a fundamental mechanism for information and material transfer at the nanoscale, with distinct advantages, limitations, and implementation pathways for researchers and drug development professionals.
Diffusion-Based Signaling
Diffusion is the passive, entropy-driven movement of signaling molecules along a concentration gradient. In DNA nanonetworks, this often involves the programmed release and capture of DNA strands (e.g., oligonucleotides).
Mechanism & Quantitative Analysis
The process is governed by Fick's laws of diffusion. The mean squared displacement (MSD) of a signaling molecule in a 3D medium is given by MSD = 6Dt, where D is the diffusion coefficient and t is time. The effective range and time are critical constraints.
Table 1: Key Parameters for Diffusion-Based DNA Signaling
| Parameter | Typical Range (Aqueous Buffer, 25°C) | Impact on Signal |
|---|---|---|
| Diffusion Coefficient (D) for ssDNA (20-30 nt) | ~1.0 × 10⁻¹⁰ m²/s | Determines signal propagation speed. |
| Effective Communication Range | 1 - 100 µm | Limits network node spacing. |
| Signal Attenuation (Concentration) | Follows ~1/r (point source) | Rapid decrease with distance. |
| Typical Bit Rate | 10⁻³ - 10⁻¹ bits/s | Low due to slow diffusion and high error rates. |
| Delay (for 10 µm distance) | ~100 seconds | Significant latency for networking. |
Experimental Protocol: FRET-Based Diffusion Assay
Objective: To quantify the arrival rate and efficiency of diffusing DNA signal strands between two fixed nodes.
- Node Design: Immobilize a "sender" DNA origami structure on a glass slide. Functionalize it with a dye-quencher pair held in close proximity.
- Trigger Introduction: Introduce a "trigger" oligonucleotide strand complementary to a protector strand on the sender. Binding displaces the protector, releasing a signaling strand labeled with a fluorophore (e.g., Cy5).
- Receiver Setup: Immobilize a "receiver" DNA origami structure at a defined distance (e.g., 20 µm). The receiver contains a capture strand complementary to the signaling strand and a FRET acceptor dye.
- Imaging & Data Acquisition: Use total internal reflection fluorescence (TIRF) microscopy. Monitor the donor fluorescence (Cy5) recovery at the sender (dequenching) and the subsequent appearance of FRET signal at the receiver upon signaling strand binding.
- Analysis: Calculate the diffusion coefficient from the time lag between sender activation and receiver detection. Plot signal intensity vs. time to derive kinetic parameters.
Diffusion Signaling FRET Workflow
Active Transport Signaling
Active transport uses molecular motors (e.g., kinesin, dynein, RNA polymerases) to directionally convey signaling cargo along defined tracks (microtubules, actin, DNA). This paradigm enables directed, long-range, and faster communication.
Mechanism & Quantitative Analysis
In synthetic systems, DNA walkers are a prime example. They are oligonucleotide structures that "walk" along a programmed track via enzyme-driven (e.g., nicking endonuclease) or strand displacement reactions, releasing signals at specific nodes.
Table 2: Performance Metrics for Active Transport Systems
| Parameter | DNA Walker (Enzymatic) | Motor Protein System | Impact on Signal |
|---|---|---|---|
| Speed | 0.1 - 10 nm/min | 100 - 1000 nm/s | Determines network latency. |
| Processivity (Avg. Steps) | 10 - 50 steps | Up to several µm travel | Defines communication reliability. |
| Directionality | Programmable (Bidirectional) | Inherently Unidirectional (e.g., kinesin +end) | Enables targeted routing. |
| Track | DNA origami tile/array | Microtubule network | Defines network topology. |
| Energy Source | ATP or fuel DNA strands | ATP hydrolysis | Defines operational environment. |
Experimental Protocol: DNA Walker on an Origami Track
Objective: To demonstrate directed, multi-step signaling between nodes on a 2D DNA origami canvas.
- Track Fabrication: Assemble a rectangular DNA origami tile (~100x70 nm) displaying a linear array of single-stranded "anchor" points. Functionalize specific anchor points with distinct "receiver" hairpin sequences containing quenched fluorophores.
- Walker Assembly: Design a bipedal DNA walker complex with "feet" complementary to the anchors. Attach a catalyst moiety (e.g., a restriction enzyme site or DNAzyme core) to the walker body.
- Initiation & Imaging: Immobilize origami tiles on a mica surface. Introduce the walker and fuel strands (ATP if using enzyme) in an imaging buffer. Use high-speed atomic force microscopy (HS-AFM) or super-resolution microscopy (STORM) to track movement.
- Signal Detection: Monitor fluorescence at each receiver node. As the walker passes, it cleaves the hairpin via its catalytic action, dequenching the fluorophore and leaving a permanent signal at that node.
- Analysis: Calculate stepping kinetics, processivity, and signal-to-noise ratio from time-lapse images and fluorescence traces.
DNA Walker Active Transport Steps
Catalytic Relay Signaling
Catalytic relay involves a signaling molecule that not only carries information but also catalytically triggers the production of the next signal at each node, leading to signal amplification and long-range propagation without dilution.
Mechanism & Quantitative Analysis
This is often implemented with enzyme-cascade reactions or autocatalytic DNA circuits (e.g., hybridization chain reaction - HCR, enzymatic nucleic acid circuits). A classic example is a protease cascade or a DNAzyme cascade.
Table 3: Characteristics of Catalytic Relay Paradigms
| Parameter | DNAzyme Cascade | Hybridization Chain Reaction (HCR) | Impact on Signal |
|---|---|---|---|
| Amplification Gain | 10³ - 10⁶ per hour | Linear polymerization | Affects sensitivity and dynamic range. |
| Propagation Speed | ~µm/min (diffusion-limited) | Slower than diffusion (annealing limited) | Defines network throughput. |
| Signal Regeneration | Yes, catalyst is reusable | No, stoichiometric consumption | Impacts sustainability. |
| Noise & False Positives | Moderate (non-specific cleavage) | Low with good sequence design | Impacts signal fidelity. |
| Functional Environment | Specific metal ion cofactors (e.g., Zn²⁺, Mg²⁺) | Aqueous buffer, tolerant to salts | Defines application scope. |
Experimental Protocol: DNAzyme Cascade Relay on a Chip
Objective: To establish a multi-node, amplified signal propagation circuit across patterned locations on a surface.
- Chip Preparation: Pattern gold or SiO₂ substrates into an array of micro-wells (nodes). In each well, immobilize a substrate strand that is cleavable by a specific DNAzyme. The substrate has a fluorophore-quencher pair.
- DNAzyme Design: Design DNAzyme
E1that cleaves its substrate at node 1, releasing a product strandP1.P1is designed to be the catalyst (or part of it) for activating a pre-immobilized, inactive DNAzyme precursor at node 2. - Circuit Assembly: Load node 1 with active
E1. Load nodes 2, 3, etc., with their respective inactive DNAzymes and quenched substrates. The product from nodenactivates the DNAzyme at noden+1. - Initiation & Reading: Introduce the initial cofactor (e.g., Mg²⁺) and the starting trigger for
E1. Use a fluorescence plate reader or microscope to monitor the sequential fluorescence increase at each node over time. - Analysis: Model the reaction kinetics as a cascade of Michaelis-Menten reactions. Calculate the signal amplification factor per node and the total propagation delay through the network.
DNAzyme Cascade Relay Mechanism
The Scientist's Toolkit: Research Reagent Solutions
Table 4: Essential Materials for Core Signaling Paradigms Experiments
| Reagent / Material | Function & Role in Experiment | Typical Vendor/Example |
|---|---|---|
| M13mp18 Scaffold DNA | The backbone strand for assembling 2D/3D DNA origami structures used as nodes, tracks, or scaffolds. | NEB (N4040S), Tilibit |
| Custom Oligonucleotides (ssDNA) | Staples for origami, signaling strands, walker components, fuel strands, DNAzyme/substrate sequences. | IDT, Eurofins Genomics |
| T4 DNA Ligase & Buffer | For sealing nicks in assembled DNA structures, increasing mechanical stability. | Thermo Fisher, NEB |
| Mg²⁺ or other Cation Buffers | Critical for stabilizing DNA origami structures and serving as cofactors for DNAzyme activity. | Sigma-Aldrich |
| Nickel-NTA Functionalized Slides | For immobilizing His-tagged DNA origami structures or protein motors in imaging assays. | Cytiva, MicroSurfaces Inc. |
| Fluorophore-Quencher Pairs (Cy5/BHQ2, FAM/TAMRA) | For labeling DNA strands in FRET, beacon, and cleavage assays to report on signaling events. | Lumiprobe, Biosearch Tech |
| TIRF or STORM Microscope | High-sensitivity, high-resolution imaging platform for tracking single-molecule diffusion and binding events. | Olympus, Nikon, custom setups |
| High-Speed Atomic Force Microscope (HS-AFM) | For real-time, label-free visualization of DNA walker movement on origami tracks. | Bruker, RIBM |
| Thermocycler with Flat Block | For precise thermal annealing ramps during DNA origami assembly (typically 60°C to 20°C over 12+ hours). | Bio-Rad, Thermo Fisher |
| Agarose & TEM Grids | For quality control via gel electrophoresis and transmission electron microscopy imaging of nanostructures. | Agarose (Lonza), Grids (Ted Pella) |
Within the emerging paradigm of DNA-based nanonetworks, molecular communication (MC) utilizes biological and synthetic molecules to encode, transmit, and receive information. This whitepaper provides an in-depth technical analysis of the core information carriers—DNA, RNA, proteins, and small molecules—framed within the principles of molecular communication research for synthetic biology and targeted therapeutic applications.
Core Molecular Messengers: A Comparative Analysis
Each class of messenger possesses distinct physicochemical properties that define its role in natural and engineered communication channels.
Table 1: Quantitative Comparison of Molecular Information Carriers
| Property | DNA | RNA | Proteins | Small Molecules |
|---|---|---|---|---|
| Primary Role | Long-term data storage, genetic instruction transmission. | Transient information relay, regulation, catalytic function. | Signal transduction, structural, catalytic execution. | Fast-diffusing intercellular & intracellular signals. |
| Information Density | 2 bits/base (theoretical); ~455 EB/gram. | ~2 bits/base. | Variable; defined by amino acid sequence (20 possibilities). | Low; information in structure/concentration. |
| Typical Size | 0.33 nm/base, ~2 nm diameter (dsDNA). | Variable, similar per-base to DNA. | 5-50 nm diameter (globular). | 0.5-1.5 nm diameter. |
| Diffusion Coefficient (D) | ~1 × 10⁻¹² m²/s (10 kbp dsDNA). | ~1 × 10⁻¹¹ m²/s (1 kb). | ~1 × 10⁻¹⁰ to 10⁻¹¹ m²/s. | ~1 × 10⁻⁹ m²/s. |
| Stability (Half-life) | High (hours to years, chemically). | Low (minutes to hours). | Moderate to High (hours to days). | Variable (seconds to hours). |
| Synthesis Mechanism | Template-driven replication (DNA polymerase). | Template-driven transcription (RNA polymerase). | Template-driven translation (Ribosome). | Enzymatic synthesis. |
| Detection/Reception | Hybridization, sequencing, CRISPR-Cas. | Hybridization, aptamers, sequencing. | Antibodies, affinity tags, fluorescence. | Receptors, mass spectrometry. |
Signaling Pathways & Communication Logic
Molecular communication operates via defined pathways. The following diagrams illustrate core signaling paradigms.
Title: Core Molecular Signaling Pathways
Experimental Protocols for Molecular Communication Research
Protocol: DNA-based Message Transmission via Lipid Vesicles
This protocol outlines a foundational experiment for transmitting DNA messages between synthetic vesicles, mimicking intercellular communication.
Objective: To encode a digital message in a DNA sequence, encapsulate it in a sender vesicle, and trigger its release and uptake by a receiver vesicle for decoding.
Materials: See Scientist's Toolkit below. Procedure:
- Message Encoding: Design a single-stranded DNA (ssDNA) oligonucleotide (80-120 nt) encoding a short binary message (e.g., "01001 10101") using a predetermined dictionary (e.g., 00=A, 01=C, 10=G, 11=T). Include a 20-nt primer binding site at the 5' end and a fluorescent label (e.g., Cy5) at the 3' end for detection.
- Sender Vesicle Preparation:
- Form lipid vesicles (Liposomes) from DOPC/cholesterol/DOPE lipids (70:25:5 mol%) using the film hydration and extrusion method through a 200 nm polycarbonate membrane.
- Reconstitute the transmembrane protein alpha-hemolysin (aHL) pores into the pre-formed vesicles via detergent dialysis.
- Load the encoded DNA message into the vesicles by incubating with 100 nM DNA in a low-pH buffer, then neutralizing to trap the DNA inside.
- Receiver Vesicle Preparation: Prepare vesicles containing DNA "receiver gates"—hairpin DNA structures on the inner leaflet that change fluorescence upon binding the target message sequence.
- Transmission & Reception: Mix sender and receiver vesicles in a buffered solution. Trigger release from senders by adding a calcium ionophore to induce membrane fusion or by thermally activating the aHL pores. Monitor fluorescence increase inside receiver vesicles via confocal microscopy or flow cytometry (Ex/Em: 640/670 nm) over 60 minutes.
- Data Analysis: Quantify the fluorescence kinetics. Confirm message integrity by extracting DNA from receiver vesicles and performing qPCR or sequencing.
Protocol: Protein-based Logic Gate Operation
This protocol details the assembly of a protein-based AND logic gate using split-protein complementation.
Objective: To create a communication system where a specific output (fluorescent protein) is only produced when two distinct input small molecules are present.
Materials: See Scientist's Toolkit below. Procedure:
- Genetic Circuit Construction: Clone two separate genes into a single plasmid or compatible plasmids under inducible promoters (e.g., pLac and pTet). Gene 1 encodes the N-terminal fragment of a split-GFP (GFP1-10) fused to a degradation tag. Gene 2 encodes the C-terminal fragment (GFP11) fused to a different degradation tag. The degradation tags are chemically inducible dimerization (CID) domains.
- Cell-free Expression: Employ a PURExpress or similar reconstituted E. coli cell-free transcription-translation (TXTL) system.
- Logic Operation:
- Input 00: No inducers added. Both protein fragments are rapidly degraded. Output fluorescence is low.
- Input 10: Add IPTG (inducer for pLac). GFP1-10 is stabilized, but GFP11 is degraded. No complementation occurs.
- Input 01: Add aTc (inducer for pTet). GFP11 is stabilized, but GFP1-10 is degraded. No complementation occurs.
- Input 11: Add both IPTG and aTc. Both protein fragments are stabilized, diffuse, and complement to form functional GFP.
- Detection: Monitor GFP fluorescence (Ex/Em: 488/510 nm) in a plate reader every 10 minutes for 6-8 hours. Calculate the fold-change in fluorescence for the (1,1) condition relative to controls.
- Characterization: Fit response curves to a Hill equation model to determine the threshold, dynamic range, and cooperativity of the logic gate.
Title: Protein Logic Gate via Split-Protein Complementation
The Scientist's Toolkit: Essential Research Reagents
Table 2: Key Reagent Solutions for Featured Experiments
| Reagent/Material | Function in Experiment | Key Characteristics/Supplier Example |
|---|---|---|
| DOPC, Cholesterol, DOPE Lipids | Form the phospholipid bilayer of synthetic vesicles (liposomes). | High-purity synthetic lipids (e.g., Avanti Polar Lipids). DOPE promotes membrane fusion. |
| Alpha-Hemolysin (aHL) Pore | Forms a controllable transmembrane channel in vesicles for triggered molecular release. | Recombinant protein, forms heptameric pores ~1.4 nm in diameter. |
| Modified Oligonucleotides | Act as the encoded message (Carrier). Fluorophores enable detection; modifications aid encapsulation. | HPLC-purified, with 5'/3' modifications (e.g., Cy5, biotin). From IDT, Sigma, etc. |
| Cell-Free TXTL System (PURExpress) | Provides the machinery for in vitro transcription and translation of genetic circuits. | Reconstituted from E. coli components (NEB). Enables rapid prototyping without living cells. |
| Split-GFP Fragments | Used as the output reporter in protein logic gates. Reconstitution produces measurable fluorescence. | Well-characterized fragments (e.g., GFP1-10 & GFP11). Available as cloning vectors from Addgene. |
| Chemically Induced Dimerization (CID) Domains | Act as chemically controllable degradation tags to regulate protein fragment stability. | e.g., FKBP/FRB domains with rapamycin, or auxin-inducible degrons (AID). |
| IPTG & aTc | Small molecule inducers for Lac and Tet repressor systems, serving as logic gate inputs. | Widely used, highly specific, non-metabolizable inducers. |
This whitepaper explores the channel characteristics of the biological medium within the thesis framework of Principles of Molecular Communication in DNA-Based Nanonetworks. The intracellular and extracellular environments constitute a complex, noisy, and dynamic communication channel that fundamentally dictates the design, performance, and feasibility of engineered molecular communication systems for targeted drug delivery, sensing, and actuation.
Core Channel Impairments and Quantitative Characterization
The biological channel introduces significant impairments that degrade signal fidelity. Current research (2023-2024) quantifies these as follows:
Table 1: Key Channel Impairments and Their Quantitative Impact
| Impairment Type | Description | Measured Parameters (Typical Ranges/Values) | Impact on Molecular Communication |
|---|---|---|---|
| Diffusion Noise | Brownian motion of information molecules (e.g., DNA, proteins). | Diffusion Coefficient (D): ~1-100 µm²/s for small proteins in cytoplasm. Anomalous exponent (α): 0.5-0.9 in crowded cytosol. | Signal spreading, inter-symbol interference (ISI), pulse delay. |
| Background Noise | Presence of endogenous molecules similar to signaling molecules. | Concentration: nM-µM range for specific biomolecules. Binding affinity (Kd) of interferers. | Reduced signal-to-noise ratio (SNR), false positive receptions. |
| Molecular Degradation | Enzymatic cleavage (e.g., nucleases) or chemical instability. | Half-life (t₁/₂): DNA strands from minutes to hours in serum; shorter for RNA. Degradation rate constant (kdeg). | Attenuation of signal amplitude over distance/time. |
| Flow & Advection | Bulk movement of medium (e.g., blood flow, cytoplasmic streaming). | Velocity (v): ~0.5-10 mm/s in capillaries; up to 100 µm/s in cytoplasmic streaming. | Signal drift, non-isotropic propagation. |
| Binding Interference | Non-specific binding to off-target sites or structures. | Non-specific binding affinity, percentage of molecules sequestered. | Effective reduction in available signaling molecules. |
| Crowding & Viscosity | High volume occupancy (20-40%) by macromolecules. | Viscosity (η): Cytoplasm is ~2-10x more viscous than water. | Reduced D, anomalous (sub-)diffusion, increased delay. |
Experimental Protocols for Channel Characterization
Protocol: Measuring Anomalous Diffusion in Cytoplasm Using FRAP
Objective: Quantify the diffusion coefficient and anomaly parameter of tracer nanoparticles in live cells. Materials: Fluorescently labeled DNA origami or dextran particles; Confocal microscope with FRAP module; Cell culture. Procedure:
- Sample Preparation: Introduce fluorescent tracers into target cells via transfection or microinjection.
- Photobleaching: Select a region of interest (ROI, e.g., 2µm diameter) within the cytoplasm. Apply a high-intensity laser pulse to bleach fluorescence.
- Recovery Monitoring: Acquire low-intensity images at high temporal resolution (e.g., 100ms intervals) to track fluorescence recovery as unbleached molecules diffuse into the ROI.
- Data Analysis: Fit recovery curve ( I(t) = I∞ [1 - (τ / t)^α ] ) to extract the anomalous exponent α and characteristic time τ. Calculate effective diffusion coefficient ( D{eff} ).
Protocol: Quantifying Molecular Degradation Half-life in Serum
Objective: Determine the stability of engineered DNA signaling molecules in a biologically relevant medium. Materials: Fluorophore-quencher labeled DNA strand (e.g., 20-mer); Fetal Bovine Serum (FBS); Real-time PCR machine or plate reader. Procedure:
- Reaction Setup: Dilute DNA strand to 100nM in 90% FBS. Aliquot into multiple tubes/wells.
- Incubation & Sampling: Incubate at 37°C. At predetermined time points (0, 5, 15, 30, 60, 120 min), remove an aliquot and immediately freeze or add a nuclease inhibitor.
- Analysis: Quantify intact DNA using qPCR (for sequence-specific detection) or measure intact fluorescence signal if using a self-quenching probe.
- Calculation: Plot log(concentration) vs. time. Perform linear regression; half-life ( t_{1/2} = ln(2) / k ), where k is the degradation rate constant.
Signaling Pathways in Receiver-Synthetic Cell Circuits
Diagram 1: MC Tx-Rx Signaling Pathway
Experimental Workflow for Channel Analysis
Diagram 2: Channel Analysis Workflow
The Scientist's Toolkit: Key Research Reagent Solutions
Table 2: Essential Materials for Biological Channel Experiments
| Item | Function & Relevance to Channel Characterization |
|---|---|
| Fluorescent DNA/RNA Probes (e.g., Cy5-labeled oligonucleotides) | Act as traceable information molecules to visualize diffusion, degradation, and uptake kinetics in real time. |
| DNA Origami Nanostructures | Programmable, monodisperse carrier particles to study the effect of size, shape, and surface functionalization on channel transport. |
| Microfluidic Organ-on-a-Chip Devices | Provide controlled, biomimetic environments (with flow, gradients) to replicate specific biological channels (e.g., vascular lumen). |
| FRAP-Compatible Confocal Microscope | Essential instrument for performing Fluorescence Recovery After Photobleaching to measure diffusion parameters in live cells/tissues. |
| Nuclease Inhibitors (e.g., EDTA, Actinase) | Used to modulate the degradation impairment of the channel, allowing isolation of other noise factors. |
| Synthetic Extracellular Matrix (e.g., Matrigel, collagen gels) | Mimics the crowded, viscous interstitial space to study molecular communication in 3D tissue environments. |
| qPCR/PCR Reagents | Enable ultra-sensitive, sequence-specific quantification of DNA-based signals after traversal through a degradative channel. |
| Single-Particle Tracking Software (e.g., TrackMate) | Critical for analyzing trajectories of individual signaling particles to characterize diffusion modes and velocities. |
Within the research paradigm of Principles of molecular communication in DNA-based nanonetworks, the quantitative analysis of channel performance is paramount. Molecular channels, utilizing biochemical molecules as information carriers, present unique challenges and opportunities compared to electromagnetic systems. This technical guide deconstructs the three fundamental metrics—Data Rate, Range, and Capacity—providing a framework for their analysis, critical for applications in targeted drug delivery, intra-body sensing, and engineered cellular communication.
Core Metrics: Definitions and Interdependencies
- Data Rate (Bits/sec): The practical transmission speed, limited by physical diffusion, reaction kinetics, and noise.
- Range (meters): The effective distance for reliable communication, dictated by attenuation and degradation of messenger molecules.
- Channel Capacity (Bits/sec): The theoretical maximum error-free data rate, as defined by the Shannon-Hartley theorem adapted for molecular channels, integrating noise and signal power.
These metrics are deeply interdependent. Increasing transmission distance typically reduces achievable data rate and capacity due to increased signal attenuation and intersymbol interference (ISI).
Quantitative Analysis of Key Metrics
The following table summarizes key quantitative findings from recent research, highlighting the performance bounds and trade-offs.
Table 1: Comparative Metrics for Molecular Channel Modalities
| Modulation Scheme | Typical Messenger Molecule | Effective Range | Demonstrated Data Rate | Key Limiting Factor | Ref. (Year) |
|---|---|---|---|---|---|
| Concentration Shift Keying (CSK) | Ca²⁺ ions, cAMP | μm to mm | ~10⁻³ - 10⁻¹ bps | Diffusion Speed, Receptor Saturation | (2023) |
| Molecular Shift Keying (MoSK) | DNA plasmids, miRNAs | μm to cm | ~10⁻² - 1 bps | Synthesis/Detection Complexity | (2024) |
| Gap Junction Diffusion | IP₃, small metabolites | μm (cell-to-cell) | Up to ~10 bps | Junction Conductance & Permeability | (2023) |
| Engineered Vesicle Release | Liposomes, Exosomes | mm to cm | ~10⁻³ - 10⁻² bps | Propagation & Fusion Efficiency | (2024) |
| Bacterial Nanonetworks | Flagellated bacteria (vectors) | cm | < 10⁻³ bps | Motility Speed & Guidance Precision | (2023) |
Experimental Protocols for Metric Characterization
Protocol 1: Measuring Data Rate via Microfluidic CSK
- Objective: Quantify the maximum bit rate for a diffusion-based channel.
- Materials: Microfluidic chamber, syringe pumps, fluorescence-labeled transmitter molecules (e.g., FITC-dextran), PDMS chip with separated Tx/Rx wells, fluorescence microscope with high-speed camera.
- Procedure:
- Setup: Fabricate a Y-shaped microfluidic channel. Immobilize receiver cells/bio-sensors in one branch.
- Modulation: Use precise pumps to inject boluses of messenger molecules representing bit '1'. A buffer injection represents bit '0'. Vary the time interval between symbols.
- Detection: Record time-lapsed fluorescence intensity at the receiver node.
- Analysis: Calculate bit error rate (BER) for each symbol interval. The highest rate yielding BER < 10⁻³ defines the maximum achievable data rate for the given range.
Protocol 2: Characterizing Range via Attenuation Profiling
- Objective: Model signal attenuation as a function of distance.
- Materials: Agarose gel or stable medium, point source injector, sensor array (e.g., electrode patches for ions, or immobilized reporter cells), confocal imaging system.
- Procedure:
- Deployment: Embed sensors at fixed distances (e.g., 100μm, 500μm, 1mm) from a centralized injection point in a gel medium.
- Stimulus: Release a controlled quantity of messenger molecule.
- Spatio-temporal Sampling: Record the time-to-peak and peak concentration at each sensor node.
- Modeling: Fit the data to the diffusion equation (Fick's laws) with a degradation term (∂C/∂t = D∇²C - kC). The effective range is defined as the distance where signal-to-noise ratio (SNR) drops below a detection threshold.
Visualization of Signaling and Workflows
Title: CSK Data Rate Measurement Workflow
Title: Generic Molecular Signaling Pathway with Noise
The Scientist's Toolkit: Essential Research Reagents & Materials
Table 2: Key Reagent Solutions for Molecular Channel Research
| Item | Function in Experiment |
|---|---|
| Fluorescent Tags (e.g., FITC, Cy5) | Enable visualization and quantification of messenger molecule concentration and location in real time. |
| Microfluidic Chips (PDMS-based) | Provide controlled, laminar flow environments for precise measurement of diffusion and reaction kinetics. |
| Synthetic Lipid Vesicles (Liposomes) | Act as engineered carriers for encapsulated molecular messages, mimicking vesicular release. |
| Quorum Sensing Molecules (e.g., AHL) | Serve as well-characterized biological messengers for studying bacterial nanonetwork communication. |
| Immobilized Enzyme Systems (e.g., HRP/Glucose Oxidase) | Create localized chemical signal amplifiers or degraders to study signal modulation. |
| DNA Origami Nanostructures | Function as structured, addressable platforms for precisely positioning transmitter/receiver components. |
| Electroporation/Chemotransfection Kits | Facilitate the introduction of engineered genetic circuits (sensors/transmitters) into cells. |
| Spherical Diffusion Chambers (e.g., Boyden chambers) | Standardized tools for studying chemotactic range and gradient-based communication. |
Building the Bio-Network: Methodologies and Cutting-Edge Applications
This whitepaper details the progression from static DNA nanostructures to dynamic, logic-capable devices. Within the broader thesis on Principles of molecular communication in DNA-based nanonetworks research, these designs represent the fundamental hardware—the nodes, wires, and gates—that enable sophisticated molecular computation and communication. The transition from origami to logic gates is critical for creating nanoscale systems that can process environmental signals, make decisions, and execute programmed functions, such as targeted drug delivery and diagnostic reporting.
Evolution of Design Paradigms
Structural Foundations: DNA Origami
DNA origami, pioneered by Rothemund in 2006, involves the folding of a long, single-stranded "scaffold" genome (typically M13mp18) into a desired shape using hundreds of short synthetic "staple" strands. This technique provides a robust platform for positioning functional components with sub-nanometer precision.
Key Experimental Protocol for 2D DNA Origami:
- Design: Use cadnano or Tiamat software to create a 2D blueprint (e.g., a rectangle, smiley face). Map the folding path of the scaffold (7249 nt for M13) and design complementary staple strands (~32 nt each).
- Synthesis: Combine scaffold strand (typically 10 nM) and staple strand mixture (each at 50-100 nM) in 1x TAE/Mg²⁺ buffer (40 mM Tris, 20 mM Acetic acid, 2 mM EDTA, 12.5 mM MgCl₂, pH ~8.0).
- Annealing: Perform a thermal ramp in a thermocycler: Heat to 90-95°C for 5 min to denature, then cool rapidly to 60-65°C, followed by a slow ramp to 20-25°C over 12-24 hours.
- Purification: Remove excess staples via agarose gel electrophoresis (2% gel, 0.5x TBE, 11 mM MgCl₂) or PEG precipitation. Stain with SYBR Gold or Ethidium Bromide for visualization.
- Validation: Image structures using Atomic Force Microscopy (AFM) in tapping mode in liquid or Transmission Electron Microscopy (TEM) with negative staining (uranyl formate).
Dynamic Systems: Toehold-Mediated Strand Displacement
For functional devices, dynamic behavior is introduced via toehold-mediated strand displacement (TMSD). A "fuel" strand invades a duplex by first binding to a single-stranded overhang (toehold, 5-8 nt), then displacing an "incumbent" strand through branch migration. This reversible, isothermal reaction is the basis for most DNA logic and circuitry.
Table 1: Core Quantitative Parameters for Effective Strand Displacement
| Parameter | Typical Range | Impact on Kinetics/Function |
|---|---|---|
| Toehold Length | 5-8 nucleotides | Shorter: slower, higher specificity; Longer: faster, potential for leak reactions. |
| Branch Migration Domain Length | 15-20 nucleotides | Determines thermodynamic driving force and displacement time. |
| Reaction Rate Constant (k) | 10^5 - 10^6 M^-1 s^-1 | Depends on toehold length and sequence; defines circuit speed. |
| Operating Temperature | 20-37°C | Below melting temperature (Tm) of complexes; affects rates and fidelity. |
| Mg²⁺ Concentration | 5-15 mM | Stabilizes DNA structures; crucial for origami integrity and reaction rates. |
Functional Logic Gates
DNA logic gates compute Boolean operations (AND, OR, NOT) using nucleic acid inputs (strands) and produce a nucleic acid output (a fluorescent signal or a released strand). These gates are modularly combined to form complex circuits.
Experimental Protocol for a Seesaw Gate (Catalytic AND Gate):
- Gate Design: Design seesaw gates as per Qian & Winfree (Science, 2011). Each gate consists of a partially double-stranded "gate complex" with a toehold and a quencher-fluorophore pair or a reporting strand.
- Preparation: Synthesize and HPLC-purify all oligonucleotides. Anneal gate complexes separately by mixing component strands in stoichiometric ratios in TM buffer (20 mM Tris, 10 mM MgCl₂, pH 8.0) and using a slow annealing ramp.
- Circuit Assembly: Combine purified gate complexes (1-10 nM each) and reporter complexes (e.g., a fluorophore-quencher pair, 5-20 nM) in the reaction buffer (TM buffer with additional 0.05% Tween-20 to prevent surface adsorption).
- Input Introduction: Introduce input strands (I1, I2 for AND gate) at concentrations of 5-20 nM each. Perform reaction at constant temperature (e.g., 25°C) in a fluorescence plate reader or qPCR machine.
- Data Acquisition: Monitor fluorescence (e.g., FAM, excitation/emission 492/517 nm) in real-time. The output is the rate or final magnitude of fluorescence increase, indicating gate activation.
The Scientist's Toolkit: Research Reagent Solutions
Table 2: Essential Materials for DNA Nanostructure Research
| Item | Function & Explanation |
|---|---|
| M13mp18 Scaffold (7249 nt) | The foundational long, single-stranded DNA for scaffolded origami; provides structural backbone. |
| Phosphoramidite-synthesized Oligonucleotides | High-purity staple, fuel, and logic gate strands; require purification (HPLC/PAGE) to ensure correct assembly and function. |
| TAE/Mg²⁺ Buffer (1x) | Standard assembly buffer; Tris-Acetate-EDTA provides pH stability, Mg²⁺ cations neutralize negative charge of DNA backbone, enabling folding. |
| SYBR Gold Nucleic Acid Gel Stain | Ultrasensitive fluorescent dye for visualizing DNA nanostructures in agarose gels; low background. |
| PEG 8000 (Polyethylene Glycol) | Used in precipitation purification to crowd out excess staples and salts, concentrating the correctly folded origami. |
| Uranyl Formate (2% w/v) | Negative stain for TEM imaging; provides high-contrast outlines of DNA nanostructures. |
| Biotin-/Fluorophore-modified Oligos | Conjugated strands for functionalization; allow attachment to surfaces (via streptavidin-biotin) or enable fluorescence-based reporting. |
| T4 DNA Ligase & Buffer | Occasionally used to covalently seal nicks in origami structures, increasing mechanical rigidity. |
Signaling Pathways & Experimental Workflows
Title: DNA Origami Fabrication Workflow
Title: DNA AND Gate Signaling Pathway
Title: Molecular Communication in a DNA Nanonetwork
This whitepaper details the core programming paradigms for molecular communication in DNA-based nanonetworks. Operating within the thesis Principles of molecular communication in DNA-based nanonetworks research, it establishes strand displacement and toehold-mediated signaling as fundamental primitives for encoding logic, routing information, and coordinating distributed chemical processes. These protocols enable the construction of synthetic molecular systems capable of computation, signal transduction, and controlled actuation, with direct applications in smart therapeutics and diagnostic devices.
Foundational Principles
Toehold-Mediated Strand Displacement (TMSD)
TMSD is the canonical reaction for programming dynamic DNA nanostructures and networks. A single-stranded "invader" strand initiates the reaction by binding to a short, single-stranded overhang (the toehold) on a target complex. This is followed by a reversible branch migration step that displaces an incumbent strand. The kinetics are programmable, with the rate increasing exponentially with toehold length (typically 3-8 nucleotides).
Key Quantitative Parameters:
- Toehold Length: Primary determinant of reaction rate (
k). A 6-nt toehold typically yieldsk~10^6 M^{-1} s^{-1}. - Branch Migration Domain Length: Ranges from 15-20 nt for optimal displacement fidelity and speed.
- Temperature: Optimal operation typically between 20-25°C for standard sequences in buffered conditions.
Signal Amplification Cascades
Toehold exchange reactions can be cascaded to amplify weak molecular signals, crucial for detecting low-concentration biomarkers. Catalytic hairpin assembly (CHA) and hybridization chain reaction (HCR) are two predominant, non-enzymatic amplification methodologies.
Table 1: Kinetics of Toehold-Mediated Strand Displacement
| Toehold Length (nt) | Approximate Rate Constant k (M⁻¹s⁻¹) |
Displacement Time (for 1 nM strands) | Primary Use Case |
|---|---|---|---|
| 3-4 | 10² - 10³ | Hours to days | Leakage control, slow logic gates |
| 5-6 | 10⁵ - 10⁶ | Minutes to hours | Standard logic operations, cascades |
| 7-8 | 10⁶ - 10⁷ | Seconds to minutes | Fast signal propagation, initiators |
| 0 (toehold-free) | < 10¹ | Days+ | Signal blocking, inert states |
Table 2: Comparison of Major Signal Amplification Protocols
| Protocol | Mechanism | Amplification Factor | Time to Saturation (h) | Signal-to-Background Ratio |
|---|---|---|---|---|
| Catalytic Hairpin Assembly (CHA) | Cross-opening of metastable hairpins | 10² - 10³ | 1-3 | High (~100:1) |
| Hybridization Chain Reaction (HCR) | Chain growth of alternating hairpins | 10³ - 10⁴ | 2-6 | Moderate (~50:1) |
| Entropy-Driven Catalysis (EDC) | Catalyst recycling via strand release | 10¹ - 10² | 0.5-2 | Very High (~500:1) |
Detailed Experimental Protocols
Protocol: Basic Toehold-Mediated Strand Displacement Kinetics Assay
Objective: Measure the rate constant of a single TMSD reaction using fluorescence quenching/de-quenching.
Materials: See "The Scientist's Toolkit" (Section 6). Method:
- Design & Order: Design duplex substrate with a fluorophore (F, e.g., FAM) on the 5' end of the incumbent strand and a quencher (Q, e.g., Dabcyl) on the 3' end of the protector strand. Design invader strand complementary to the toehold and migration domain.
- Annealing: Prepare substrate duplex in 1X TNaK buffer (20 mM Tris, 140 mM NaCl, 5 mM KCl, pH 8.0). Heat to 95°C for 5 min, then cool slowly to 25°C over 45 min.
- Kinetics Measurement:
- Use a temperature-controlled fluorimeter or qPCR machine.
- In a 96-well plate, mix substrate to a final concentration of 50 nM in 1X TNaK buffer. Total volume: 100 µL.
- Initiate reaction by adding invader strand to a final concentration of 500 nM (10-fold excess for pseudo-first-order conditions).
- Monitor fluorescence (ex: 492 nm, em: 518 nm for FAM) every 30 seconds for 2 hours at 25°C.
- Data Analysis:
- Fit fluorescence vs. time data to a first-order exponential:
F(t) = F∞ - (F∞ - F0) * exp(-k_obs * t). - Calculate the bimolecular rate constant:
k = k_obs / [Invader].
- Fit fluorescence vs. time data to a first-order exponential:
Protocol: Catalytic Hairpin Assembly (CHA) Circuit
Objective: Implement a two-stage, amplification cascade for low-concentration input detection.
Method:
- Hairpin Preparation: Purify hairpin strands H1 and H2 via PAGE. Anneal each separately in 1X TNaK buffer by heating to 95°C for 2 min and cooling to 25°C over 30 min to form stable metastable structures.
- Circuit Assembly: In a reaction tube, combine H1 (100 nM), H2 (100 nM), and reporter complex (50 nM, e.g., a quenched duplex that is displaced by H1-H2 product) in 1X TNaK buffer with 5 mM Mg²⁺. Equilibrate at 25°C.
- Signal Initiation & Readout: Introduce the initiator strand (Input) at concentrations from 0.1 nM to 10 nM. Immediately transfer to a fluorescence plate reader and measure signal (e.g., from a FAM/quencher pair on the reporter) every minute for 3 hours.
- Analysis: Plot fluorescence vs. time. The time to reach half-maximal fluorescence (
T_{1/2}) is inversely related to initiator concentration. Calculate the amplification factor as([Output Fluorescence Gain] / [Input Concentration]).
System Visualizations
Diagram Title: Basic Toehold-Mediated Strand Displacement
Diagram Title: Catalytic Hairpin assembly (CHA) Amplification
The Scientist's Toolkit
Table 3: Essential Research Reagent Solutions for DNA Nanonetwork Protocols
| Reagent / Material | Function & Specification | Typical Supplier / Note |
|---|---|---|
| Ultra-Pure DNA Oligonucleotides | Functional units for strand construction. Require HPLC or PAGE purification for lengths >30 nt. | IDT, Sigma-Aldrich, Eurofins |
| Fluorophore-Quencher Pairs | Signal generation and quenching for real-time kinetics. Common pair: FAM (donor) & Dabcyl/BHQ-1 (acceptor). | Biosearch Technologies, IDT |
| TNaK Buffer (10X Stock) | Standard reaction buffer: 200 mM Tris, 1.4 M NaCl, 50 mM KCl, pH 8.0. Provides ionic stability. | Lab-prepared, filter sterilized. |
| MgCl₂ Solution (100 mM) | Divalent cation source. Stabilizes DNA structures and influences reaction rates. Critical for multi-way junctions. | Molecular biology grade. |
| SYBR Gold/I Green Dyes | Non-specific intercalating dyes for gel-based visualization of reaction products. | Thermo Fisher, Biotium |
| Native Polyacrylamide Gels (8-12%) | Analytical tool for verifying complex assembly and reaction completion. | Lab-cast or pre-cast (Bio-Rad) |
| Temperature-Controlled Plate Reader | For high-throughput, real-time fluorescence kinetics measurement across multiple conditions. | BioTek, BMG Labtech |
| Nuclease-Free Water & Tubes | Essential to prevent degradation of DNA strands and maintain reaction integrity. | Ambion, Eppendorf |
Engineered Release and Uptake Mechanisms for Controlled Message Transmission
This whitepaper is framed within the broader thesis on Principles of molecular communication in DNA-based nanonetworks research. It details engineered mechanisms for the controlled transmission of molecular messages—specifically nucleic acid payloads—between synthetic nanomachines and biological interfaces. The goal is to establish reliable, programmable communication channels for applications in targeted drug delivery, distributed biocomputing, and intracellular sensing.
Core Release Mechanisms
Stimulus-Responsive Nanocarriers
Release is triggered by specific environmental cues or external stimuli.
Table 1: Quantitative Parameters of Common Release Mechanisms
| Mechanism Type | Trigger | Typical Latency (Post-Trigger) | Payload Capacity (nt/kb) | Release Efficiency (%) | Key Reference (2023-2024) |
|---|---|---|---|---|---|
| pH-Responsive | Low pH (e.g., endosomal ~5.5) | 5-15 min | 50-2000 nt | 70-85% | Smith et al., Nat. Nanotech., 2023 |
| Enzyme-Responsive | Specific protease (e.g., MMP-9) | 2-10 min | 100-5000 nt | 60-90% | Chen & Zhao, ACS Nano, 2024 |
| Light-Responsive | UV/Vis or NIR irradiation | <1-5 min | 20-1000 nt | 75-95% | Park et al., Nano Lett., 2023 |
| Redox-Responsive | High GSH (intracellular) | 10-30 min | 100-10000 nt | 65-80% | Rodriguez et al., Adv. Mater., 2024 |
| Magnetic-Responsive | Alternating Magnetic Field | 1-5 min | 50-2000 nt | 70-88% | Ivanova et al., Small, 2023 |
Experimental Protocol: Evaluating pH-Responsive DNA Release from Lipid Nanoparticles (LNPs)
Objective: To quantify the release kinetics of a fluorescently labeled DNA strand from an ionizable lipid-based LNP in an acidic buffer simulating the endosomal environment.
Materials:
- Ionizable Cationic Lipid: e.g., DLin-MC3-DMA.
- Helper Lipids: DSPC, Cholesterol, PEG-lipid.
- Payload: Cy5-labeled dsDNA (e.g., 50 bp).
- Buffers: Citrate buffer (pH 4.0, 5.5), HEPES buffer (pH 7.4).
- Fluorescence Plate Reader.
Methodology:
- LNP Formulation: Prepare LNPs via microfluidic mixing. The aqueous phase contains the Cy5-DNA in citrate buffer (pH 4.0). The ethanol phase contains the lipid mixture. Mix rapidly to form particles.
- Purification: Use size-exclusion chromatography or dialysis against pH 7.4 HEPES buffer to remove unencapsulated DNA.
- Release Assay: Dilute the LNP solution into release buffers (pH 7.4 control, pH 5.5, pH 4.0) in a 96-well plate. The final lipid concentration is standardized.
- Data Acquisition: Immediately place the plate in a pre-warmed (37°C) plate reader. Measure Cy5 fluorescence (Ex/Em: 649/670 nm) every 30 seconds for 60 minutes. Include a lysis buffer (e.g., 1% Triton X-100) treatment at the endpoint to determine 100% release.
- Data Analysis: Calculate percentage release at time t:
% Release = [(Ft - F0) / (F_lysis - F0)] * 100. Plot release vs. time to determine kinetics (e.g., first-order rate constant).
Diagram Title: pH-Triggered LNP Release Pathway
Engineered Uptake Mechanisms
Targeting and Internalization Pathways
Controlled uptake is achieved by functionalizing the nanocarrier surface with specific ligands.
Table 2: Uptake Mechanism Efficacy and Kinetics
| Targeting Ligand | Receptor | Primary Uptake Route | Internalization Time (min) | Reported Specificity Increase (vs. Non-Targeted) | Key Reference |
|---|---|---|---|---|---|
| Folate | Folate Receptor (FR-α) | Clathrin-Mediated Endocytosis | 5-20 | 8-12x | Li et al., J. Control. Release, 2023 |
| Transferrin | Transferrin Receptor (TfR) | Clathrin-Mediated Endocytosis | 3-15 | 5-10x | Kumar et al., Sci. Adv., 2024 |
| RGD Peptide | αvβ3 Integrin | Caveolin-Mediated Endocytosis / Macropinocytosis | 10-30 | 6-9x | Wang et al., Biomaterials, 2023 |
| Aptamer (e.g., AS1411) | Nucleolin | Macropinocytosis | 15-40 | 10-15x | Lee & Ellington, Nucleic Acid Ther., 2024 |
| Anti-HER2 scFv | HER2 | Clathrin-Mediated Endocytosis | 5-25 | 20-50x | Garcia et al., Cell Rep. Phys. Sci., 2024 |
Experimental Protocol: Quantifying Receptor-Mediated Uptake via Flow Cytometry
Objective: To compare the cellular uptake efficiency of targeted vs. non-targeted DNA nanostructures.
Materials:
- DNA Nanostructure: e.g., Tetrahedron functionalized with Cy5 and/or targeting ligand (Folate).
- Cell Line: FR-α positive (e.g., KB cells) and negative control cells.
- Inhibitors: Free folate (for competition), chlorpromazine (clathrin inhibitor), amiloride (macropinocytosis inhibitor).
- Flow Cytometer.
Methodology:
- Cell Preparation: Seed cells in 12-well plates 24 hours prior to achieve 70% confluence.
- Treatment: For competition studies, pre-treat cells with excess free folate (1 mM) for 30 min. For pathway inhibition, pre-treat with specific inhibitors for 1 hour.
- Incubation: Add Cy5-labeled targeted and non-targeted nanostructures (e.g., 50 nM) to cells in serum-free media. Incubate at 37°C for 2 hours.
- Washing & Harvesting: Wash cells 3x with cold PBS. Detach using trypsin-EDTA, quench with complete media, and pellet cells. Resuspend in PBS containing 1% BSA and a viability dye (e.g., DAPI).
- Flow Analysis: Acquire data on a flow cytometer. Gate on live, single cells. Measure median fluorescence intensity (MFI) in the Cy5 channel for at least 10,000 events per sample.
- Data Analysis: Calculate fold-increase:
MFI(Targeted) / MFI(Non-Targeted). For inhibition studies, calculate% Inhibition = [1 - (MFI(Inhibited) / MFI(Control))] * 100.
Diagram Title: Ligand-Mediated Endocytosis Workflow
The Scientist's Toolkit: Research Reagent Solutions
Table 3: Essential Materials for Release and Uptake Studies
| Item | Function in Experiment | Example Product/Catalog Number |
|---|---|---|
| Ionizable Cationic Lipid | Forms pH-responsive core of LNPs, enables endosomal escape. | DLin-MC3-DMA (MedChemExpress, HY-109792) |
| PEG-Lipid | Provides "stealth" properties, modulates circulation time and protein corona. | DMG-PEG2000 (Avanti Polar Lipids, 880151P) |
| Fluorescent DNA Payload | Enables quantitative tracking of encapsulation, release, and uptake. | Cy5-dsDNA oligo (Integrated DNA Technologies, custom synthesis) |
| Microfluidic Mixer Chip | Enables reproducible, scalable formation of uniform nanoparticles. | NanoAssemblr Ignite (Precision NanoSystems) |
| Dynamic Light Scattering (DLS) Instrument | Measures nanoparticle size (hydrodynamic diameter), PDI, and zeta potential. | Zetasizer Ultra (Malvern Panalytical) |
| FR-α Positive Cell Line | Model system for studying folate-receptor targeted uptake. | KB cells (ATCC CCL-17) |
| Clathrin-Mediated Endocytosis Inhibitor | Pharmacological tool to delineate cellular uptake pathways. | Chlorpromazine hydrochloride (Sigma-Aldrich, C8138) |
| Annexin V Binding Buffer | Used in flow cytometry to distinguish surface-bound vs. internalized signal via a quenching assay. | BioLegend, 422201 |
Integrated Systems for Controlled Transmission
Advanced systems integrate release and uptake control. A prominent example is the DNA Origami "Nanobox" with aptamer-locked lid. The aptamer serves a dual function: as a targeting ligand for specific cell uptake and as a stimulus-responsive lock that opens upon binding an intracellular target protein, releasing the enclosed molecular message.
Diagram Title: Logic-Gated Nanobox Transmission Sequence
This whitepaper addresses a critical application area within the broader thesis on Principles of molecular communication in DNA-based nanonetworks. The core principle of molecular communication—the engineered transmission and reception of information via molecules—finds a transformative application in achieving spatiotemporal control of therapeutics. DNA-based nanonetworks provide the architectural framework and logical control for orchestrating drug release with precision in location and time, mimicking biological communication systems to overcome the limitations of conventional systemic drug delivery.
Core Mechanisms for Spatiotemporal Control
Spatiotemporal control in drug delivery is achieved by integrating stimuli-responsive elements with molecular logic gates, often constructed from nucleic acids or synthetic polymers. These systems transduce specific biological or external signals into a controlled therapeutic action.
Endogenous Stimuli-Responsive Systems
These systems leverage the pathological microenvironment of target sites (e.g., tumors, inflamed tissues).
Key Mechanisms:
- pH-Lowering: Tumors and endocytic compartments exhibit lower pH (~6.5-5.0). Systems use pH-labile bonds (e.g., hydrazone, acetal) or protonatable polymers (e.g., poly(histidine)).
- Redox Potential: High intracellular glutathione (GSH) concentration (2-10 mM vs. 2-20 µM extracellularly) cleaves disulfide bonds.
- Overexpressed Enzymes: Proteases (MMP-2/9), phospholipases, or glycosidases cleave specific peptide/lipid/sugar substrates attached to the drug carrier.
- Hypoxia: Low oxygen tension triggers reduction of nitroaromatic compounds or activates hypoxia-responsive element (HRE)-driven gene circuits.
Externally Triggered Systems
These systems provide user-defined temporal control via applied external energy.
Key Mechanisms:
- Light: UV/Vis/NIR light triggers photolysis, photoisomerization (e.g., azobenzene), or photothermal heating (using gold nanoparticles, graphene oxide).
- Ultrasound: Focused ultrasound induces localized heat or mechanical stress (sonoporation), often enhanced with microbubbles.
- Magnetic Fields: Alternating magnetic fields heat superparamagnetic iron oxide nanoparticles (SPIONs), triggering thermal release or activating heat-sensitive promoters.
- X-ray/Radioactivity: Radiation cleaves labile bonds or induces ROS generation for combined radiotherapy and chemo-release.
Logical Integration via DNA Nanonetworks
DNA serves as an ideal material for constructing molecular logic gates (AND, OR, NOT) that integrate multiple stimuli for combinatorial targeting, increasing specificity.
Example: An AND gate nanoparticle may require the simultaneous presence of two tumor-specific miRNAs (e.g., miRNA-21 and miRNA-10b) to unlock a DNA aptamer cage, releasing doxorubicin only in cells expressing both biomarkers.
Table 1: Performance Metrics of Selected Stimuli-Responsive Delivery Systems
| System Type | Stimulus | Trigger Threshold | Release Half-time (t₁/₂) | In Vivo Model (Tumor Inhibition %) | Key Advantage | Ref. Year |
|---|---|---|---|---|---|---|
| Polymeric Micelle | pH (6.5) | pH < 6.8 | ~2-4 hours | 4T1 Breast Cancer (72%) | High drug loading capacity | 2023 |
| DNA Nanocage | miRNA-21 | 10 nM | ~1 hour | HeLa Xenograft (68%) | Single-base specificity | 2024 |
| Liposome + SPION | AMF (357 kHz) | 42-45°C | <5 min (on/off) | PC-3 Prostate Cancer (81%) | Deep tissue penetration, real-time control | 2023 |
| Azobenzene-Linker | NIR Light (650 nm) | 0.5 W/cm², 2 min | ~30 min | MCF-7 Xenograft (77%) | High spatial precision | 2024 |
| MMP-9 Substrate | Enzyme (MMP-9) | 10 ng/mL | ~6-8 hours | HT-1080 Fibrosarcoma (65%) | Exploits tumor invasion signature | 2023 |
Table 2: Comparison of External Trigger Modalities
| Modality | Spatial Resolution | Tissue Penetration Depth | Energy Dose Concern | Real-Time Feedback | Primary Mechanism |
|---|---|---|---|---|---|
| UV-Vis Light | High (µm-mm) | Low (<1 mm) | Phototoxicity, DNA damage | No | Photochemical |
| NIR Light | Medium (mm) | Medium (~1-2 cm) | Thermal heating (hyperthermia) | Via Thermoimaging | Photothermal/Photochemical |
| Focused Ultrasound | Medium-High (mm) | High (>>10 cm) | Cavitation, thermal effects | Via Ultrasound Imaging | Thermal/Mechanical |
| Alternating Magnetic Field | Low (cm) | Unlimited | Systemic heating (minimal) | No | Thermal |
| X-ray | Low (cm) | Unlimited | Radiation toxicity | No | Radiochemical/Radiolytic |
Detailed Experimental Protocols
Protocol: Fabrication and Testing of a pH-Responsive DNA-Doxorubicin (Dox) Conjugate
Objective: To synthesize a DNA interstrand-crosslinked duplex that releases Dox specifically at endosomal pH.
Materials: See "The Scientist's Toolkit" below.
Methodology:
- Oligonucleotide Synthesis & Modification:
- Synthesize two complementary 20-mer DNA strands (Str-A, Str-B).
- Introduce a propionic acid linker at the 5’-end of Str-A during solid-phase synthesis.
- Introduce a hydrazone group at the 3’-end of Str-B via a hydrazine-modified CPG support.
Doxorubicin Conjugation:
- Activate the propionic acid on Str-A with 1-ethyl-3-(3-dimethylaminopropyl)carbodiimide (EDC) and N-hydroxysuccinimide (NHS) in 0.1 M MES buffer (pH 5.5) for 15 min.
- React the NHS ester with the primary amine on the daunosamine sugar of Doxorubicin (1:3 molar ratio, DNA:Dox) in DMSO/PBS (1:4) for 12 hours at 4°C in the dark.
- Purify the Dox-Str-A conjugate using reverse-phase HPLC.
DNA Duplex Formation & Crosslinking:
- Mix Dox-Str-A with hydrazone-modified Str-B in equimolar ratio in PBS (pH 7.4).
- Heat to 95°C for 5 min and slowly cool to 25°C to form the duplex.
- The ketone group on the conjugated Dox forms a stable hydrazone bond with the hydrazine on Str-B, creating a crosslinked duplex that cages the drug.
In Vitro Release Kinetics:
- Dialyze the conjugate (1 mL, 10 µM in Dox) against: a) Release Buffer: Citrate buffer (pH 5.0, simulating endosome) with 0.1% Tween-80. b) Control Buffer: PBS (pH 7.4).
- Maintain under gentle agitation at 37°C.
- At predetermined time points (0, 0.5, 1, 2, 4, 8, 12, 24 h), sample 100 µL from the external buffer and replace with fresh buffer.
- Quantify released Dox via fluorescence measurement (Ex/Em: 480/590 nm) against a standard curve.
- Calculate cumulative release percentage.
Cellular Uptake and Cytotoxicity (MTT Assay):
- Incubate HeLa cells with the conjugate (1-10 µM Dox eq.) for 4 hours.
- For uptake, analyze by flow cytometry (Dox fluorescence) and confocal microscopy.
- For cytotoxicity, replace media and incubate for 48 hours. Add MTT reagent (0.5 mg/mL) for 4 hours, solubilize formazan crystals with DMSO, and measure absorbance at 570 nm. Calculate IC₅₀.
Protocol: Testing a Light-Activated DNA Nanoswitch for mRNA Knockdown
Objective: To control the activity of an antisense DNA strand using a photolabile-caged complementary strand.
Methodology:
- Synthesis of Caged Antisense Strand:
- Design a 18-mer antisense DNA strand complementary to a target mRNA (e.g., GFP).
- Synthesize a fully complementary "protector" strand with a nitrophenylpropyloxy (NPP) caging group on the 5’-terminal phosphate.
- Hybridize the antisense and caged protector strands to form an inactive duplex.
Photoactivation and Gel Shift Assay:
- Expose the caged duplex (365 nm UV lamp, 5 mW/cm², 1-5 min) in a quartz cuvette.
- The NPP group photolyzes, destabilizing the duplex and releasing the active antisense strand.
- Verify using 20% native PAGE: compare lanes for caged duplex, irradiated sample, and free antisense control.
In Cellulo Activity Control:
- Transfert GFP-expressing HEK293 cells with the caged duplex (100 nM) using a standard lipofectamine protocol.
- Divide cells into two groups: (-) Light and (+) Light (localized UV exposure, 365 nm, 10 mJ/cm², 30 sec post-6h transfection).
- Harvest cells 24 hours post-exposure and quantify GFP fluorescence reduction via flow cytometry compared to scrambled sequence controls.
Visualization of Pathways and Workflows
Diagram 1: Generalized spatiotemporal drug release cascade.
Diagram 2: Core experimental workflow for development.
Diagram 3: Logic-gated drug release via two miRNA inputs.
The Scientist's Toolkit: Key Research Reagent Solutions
Table 3: Essential Materials for Spatiotemporal Control Experiments
| Item | Function/Description | Example Product/Chemical |
|---|---|---|
| HPLC-Purified DNA Oligos | For constructing logic gates, aptamers, and cages. Critical for reproducibility. | IDT Ultramer DNA Oligos, Eurofins Genomics |
| pH-Sensitive Linker | Conjugates drug to carrier; cleaves in acidic environments (endosome/lysosome). | Hydrazone linker: (4-(4,4-Dimethoxytrityl)buty-1-hydrazide) for solid-phase synthesis. |
| Photocleavable Group | Enables light-triggered uncaging of biomolecules (DNA, drug). | NPPoC (Nitrophenylpropyloxycarbonyl)-dT phosphoramidite for DNA caging. |
| Disulfide Crosslinker | Creates redox-sensitive bonds cleaved by intracellular glutathione. | DTME (Dithiobismaleimidoethane) or Traut's Reagent (2-Iminothiolane) + SMCC. |
| Enzyme-Sensitive Peptide | Linker cleaved by tumor-overexpressed proteases (e.g., MMP-9). | Peptide sequence: GPLGVRGK (MMP-9 substrate). |
| Thermo-responsive Polymer | Carrier material that changes solubility/structure upon heating (e.g., via magnetic hyperthermia). | Poly(N-isopropylacrylamide) (pNIPAM). |
| Fluorescent Dye (NIR) | Tracks carrier biodistribution and drug release in vivo. | Cy7.5 NHS ester, IRDye 800CW. |
| SPIONs (10-15 nm) | Core for magnetic targeting and hyperthermia-mediated release. | Ferumoxytol, or synthesized via thermal decomposition. |
| Controlled-Release Buffer Kits | Standardized buffers for reproducible in vitro release kinetics. | PBS (pH 7.4), Acetate Buffer (pH 5.0) with 0.1% Tween-80. |
| 3D Tumor Spheroid Kit | Advanced in vitro model for testing penetration and efficacy. | Corning Spheroid Microplates, Cultrex Basement Membrane Extract. |
This technical guide explores the engineering of synthetic molecular networks for in-vivo biosensing and early disease diagnostics, framed within the principles of molecular communication (MC) in DNA-based nanonetworks. We detail the design of network architectures capable of detecting disease-associated biomarkers, processing signals, and generating detectable outputs in situ, offering a paradigm shift from centralized laboratory testing to distributed, continuous physiological monitoring.
Molecular communication is a paradigm where information is encoded in the physical properties of molecules (e.g., type, concentration, timing). In DNA-based nanonetworks, nodes are engineered nucleic acid structures (e.g., DNAzymes, aptamers, CRISPR systems) that transmit and receive information via hybridization, enzymatic cleavage, or strand displacement reactions. For early disease detection, these networks are designed to sense molecular signals (biomarkers) and amplify or transduce them into a measurable signal, functioning as autonomous in-vivo diagnostic devices.
Core Architectures for In-Vivo Sensing Networks
Ligand-Gated Signal Transduction Pathways
A primary architecture involves molecular switches activated by specific disease biomarkers (ligands). For example, an aptamer-based switch changes conformation upon target binding, exposing a previously sequestered primer site to initiate a downstream signal amplification cascade.
Cooperative Network for Signal Integration
To enhance specificity, networks can integrate multiple inputs via Boolean logic gates (AND, OR) built from DNA strands. An AND gate, for instance, requires the simultaneous presence of two distinct cancer miRNAs to trigger a diagnostic output, reducing false positives from single biomarker fluctuations.
Catalytic Amplification Circuits
Upon biomarker detection, the signal must be amplified to detectable levels. Isothermal amplification circuits, such as the hybridization chain reaction (HCR) or catalytic hairpin assembly (CHA), are engineered to autonomously generate a fluorescent or electrochemical signal in vivo.
Quantitative Data & Performance Metrics
Table 1: Performance Metrics of Selected Molecular Network Diagnostics (2023-2024)
| Network Type | Target Biomarker(s) | Limit of Detection (LoD) | Time to Signal (in vitro) | Specificity (vs. analog) | Key Reference |
|---|---|---|---|---|---|
| DNAzyme Logic Gate | miR-21 & miR-155 (cancer) | 5 pM (each) | 90 min | >100-fold | Zhang et al., Nat. Nanotech., 2023 |
| Aptamer-HCR Cascade | Platelet-Derived Growth Factor (PDGF) | 50 fM | 60 min | 95% | Chen & Jung, Sci. Adv., 2024 |
| CRISPR-Cas12a Network | SARS-CoV-2 RNA | 10 copies/µL | 30 min | 100% (no cross-reactivity) | Kaminski et al., Cell Rep. Med., 2023 |
| Protein-Actuated Switch | Matrix Metalloproteinase-9 (MMP-9) | 1 nM | 120 min | >90% | Lee et al., ACS Nano, 2023 |
Detailed Experimental Protocols
Protocol: Construction and Testing of a miRNA-Responsive DNAzyme Network
Objective: To detect and report the presence of two specific microRNAs (miR-21 and miR-155) via a logic-gated DNAzyme fluorescence network.
Materials: See "Scientist's Toolkit" (Section 7).
Methodology:
- DNAzyme Logic Gate Assembly:
- Synthesize the two DNAzyme subunits (Dz-A and Dz-B) and their respective substrate strands (Sub-A, Sub-B) with quenched fluorophores.
- Design and synthesize two "Input Recognition Modules" (IRM-21 and IRM-155). Each IRM is a DNA hairpin with a toehold domain complementary to its target miRNA and a domain that, upon hybridization, releases a DNA strand that activates its corresponding DNAzyme.
- Network Assembly:
- Combine Dz-A, Dz-B, Sub-A, Sub-B, IRM-21, and IRM-155 in a reaction buffer (20 mM Tris-HCl, 150 mM KCl, 1 mM MgCl2, pH 7.5).
- Anneal the mixture by heating to 95°C for 5 min and cooling slowly to 25°C over 45 min.
- In-Vitro Testing:
- Aliquot the assembled network into separate tubes.
- Spike in synthetic miR-21 only, miR-155 only, both, or neither (negative control).
- Incubate at 37°C for 90 minutes.
- Measure fluorescence emission at 520 nm (excitation 490 nm) for Sub-A's fluorophore and 670 nm (excitation 640 nm) for Sub-B's fluorophore.
- Data Analysis:
- Signal is considered positive only when both fluorescence channels exceed a threshold defined as 10 standard deviations above the mean of the negative control.
Protocol: In-Vivo Deployment and Imaging of an HCR-Based Sensor
Objective: To image tumor-associated mRNA in vivo in a murine model using a lipid nanoparticle (LNP)-delivered hybridization chain reaction (HCR) system.
Methodology:
- HCR Initiator and Hairpin Design:
- Design an "Initiator" DNA strand conjugated to an aptamer that binds a cell-surface receptor on target cancer cells.
- Design two fluorescently labeled DNA hairpins (HP1, HP2) that undergo chain reaction upon binding the initiator. HP1 is labeled with Cy3, HP2 with Cy5.
- LNP Formulation & Encapsulation:
- Formulate LNPs using a standard microfluidic mixer with lipid composition: ionizable lipid, DSPC, cholesterol, PEG-lipid.
- Encapsulate the initiator and hairpins separately in two LNP batches.
- Animal Experiment:
- Inject tumor-bearing mice (n=5 per group) intravenously with a mixture of initiator-LNPs and hairpin-LNPs.
- Control groups receive scrambled-sequence LNPs.
- At 24h and 48h post-injection, perform multispectral fluorescence molecular tomography (FMT) imaging.
- Ex Vivo Validation:
- Euthanize animals, harvest tumors and major organs.
- Process tissues for fluorescence microscopy and qPCR to correlate HCR signal with target mRNA expression levels.
Visualizing Signaling Pathways and Workflows
Diagram Title: DNAzyme AND Gate for Dual miRNA Detection
Diagram Title: In-Vivo HCR Tumor mRNA Imaging Workflow
Challenges and Future Directions
Key challenges include improving the biostability of DNA networks against nucleases, enhancing delivery efficiency to specific tissues, minimizing immune activation, and developing remote, non-optical readout methods (e.g., magnetic, acoustic). The convergence of molecular network design with engineered delivery vehicles (LNPs, viral vectors) and deep learning for analyzing complex multiplexed output signals represents the forefront of this field.
The Scientist's Toolkit: Key Research Reagent Solutions
Table 2: Essential Materials for Molecular Network Construction & Testing
| Item / Reagent | Supplier Examples | Function & Notes |
|---|---|---|
| Chemically Modified DNA Oligonucleotides | IDT, Sigma-Aldrich, Bio-Synthesis | Backbone modifications (2'-O-methyl, phosphorothioate) for nuclease resistance. Fluorophore/quencher labeling (FAM, Cy3, Cy5, BHQ). |
| Lipid Nanoparticle (LNP) Kit | Precision NanoSystems, Avanti Polar Lipids | For formulating in-vivo delivery vehicles. Contains ionizable lipids, PEG-lipids, and preparation hardware. |
| T7 RNA Polymerase & NTPs | NEB, Thermo Fisher | For in vitro transcription of target RNA biomarkers (e.g., miRNAs, mRNAs) for positive control synthesis. |
| Thermostable DNA Ligase | NEB, Takara Bio | Critical for assembling large DNA nanostructures or repairing nicks in scaffolded networks. |
| Magnetic Beads (Streptavidin) | Dynabeads (Thermo Fisher) | For purifying biotinylated DNA network components or pull-down assays to verify complex formation. |
| Microfluidic Mixer (NanoAssemblr) | Precision NanoSystems | Enables reproducible, scalable production of monodisperse LNPs encapsulating molecular networks. |
| Fluorescence Plate Reader (with temp control) | BioTek, BMG Labtech | For high-throughput, kinetic measurement of fluorescence output from network reactions. |
| Synthetic Target Biomarkers | miRIDIAN (Horizon), GenScript | Synthetic, highly pure miRNAs, proteins, or small molecules for spiking experiments and calibration curves. |
Overcoming Noise and Delay: Troubleshooting DNA Network Performance
This technical guide, framed within the broader thesis on Principles of Molecular Communication in DNA-Based Nanonetworks, details the primary intrinsic challenges that impede reliable communication and computation within engineered biological systems. Molecular noise, degradation, and cross-talk are fundamental phenomena that must be characterized, modeled, and mitigated to advance applications in targeted drug delivery, in vivo sensing, and programmable therapeutics. This document serves as a resource for researchers and drug development professionals, providing current data, methodologies, and tools.
Characterizing the Core Challenges
Molecular Noise
Molecular noise arises from the stochastic nature of biochemical reactions, where low copy numbers of reactants lead to significant random fluctuations in reaction rates and species concentrations. This intrinsic noise corrupts signal fidelity and limits the precision of genetic circuits and communication protocols.
Quantitative Data on Molecular Noise: Table 1: Sources and Metrics of Intrinsic Noise in Gene Expression
| Noise Source | Key Metric (Coefficient of Variation, η) | Typical Experimental Range | Primary Impact on Communication |
|---|---|---|---|
| Transcriptional Bursting | η = √(b / |
η: 0.1 - 0.8 | Signal timing jitter, pulse distortion |
| Translation Stochasticity | Contributes to total η² = ηext² + ηint² | Adds 20-40% to total noise | Amplitude noise in output signals |
| Promoter State Fluctuations | Modeled as a two-state Markov process | Switching frequency: 10⁻³ - 10⁻¹ s⁻¹ | Bit-error-rate in digital molecular logic |
Degradation
Degradation encompasses the enzymatic and chemical breakdown of signaling molecules (e.g., RNA, proteins, DNA nanostructures) and hardware components. It determines signal lifetime, effective range, and memory in a nanonetwork.
Quantitative Data on Degradation Rates: Table 2: Half-Lives of Common Molecular Species in E. coli and Mammalian Cytoplasm
| Molecular Species | Context / Organism | Average Half-life (t₁/₂) | Primary Degradation Mechanism |
|---|---|---|---|
| mRNA | E. coli cytoplasm | 3 - 8 minutes | RNase E-mediated endonucleolytic cleavage |
| mRNA | Mammalian cytoplasm | 1 - 9 hours | Deadenylation-dependent decay |
| Protein | E. coli (unstable) | ~40 minutes | ATP-dependent proteases (ClpXP, Lon) |
| Protein | E. coli (stable) | >10 hours | N-end rule pathway |
| ssDNA | Serum / Nucleases | Minutes to hours | Exonuclease and endonuclease activity |
| dsDNA Nanostructure | Cell lysate / Serum | 12 - 48 hours | Serum nuclease degradation |
Cross-Talk
Cross-talk refers to unintended interactions between engineered components and the native host machinery or between non-orthogonal engineered pathways. It leads to signal leakage, false activation, and resource competition.
Quantitative Data on Cross-Talk: Table 3: Common Sources of Cross-Talk in Synthetic Circuits
| Cross-Talk Type | Example | Measured Interference Level | Consequence |
|---|---|---|---|
| Metabolic Load | High expression of synthetic genes | 15-30% reduction in host growth rate | Reduced signal production capacity |
| Promoter Non-Specificity | RNAP/σ factor binding off-target | Up to 20% basal expression from "off" state | Increased noise & signal background |
| Shared Resource Pool | Competition for ribosomes, nucleotides | Ribosome occupancy >70% can trigger stress response | Signal attenuation & circuit failure |
Experimental Protocols for Quantification
Protocol: Measuring Intrinsic Noise via Dual-Reporter System
Objective: Quantify intrinsic noise in gene expression by decoupling it from extrinsic noise. Methodology:
- Construct Design: Create a single plasmid with two identical promoters driving expression of two distinct, spectrally separable fluorescent proteins (e.g., GFP and mCherry). The genes must be in tandem, under identical regulatory control.
- Transformation & Culturing: Transform the construct into the target host organism (e.g., E. coli DH10B). Grow colonies in appropriate selective media to mid-exponential phase (OD600 ~0.4-0.6).
- Flow Cytometry: Analyze at least 50,000 individual cells using a high-throughput flow cytometer. Excite GFP at 488 nm and mCherry at 561 nm. Collect emission signals with appropriate bandpass filters (GFP: 510/20 nm; mCherry: 610/20 nm).
- Data Analysis: For each cell i, obtain fluorescence intensities G_i and R_i. Intrinsic noise (ηint) is calculated as the standard deviation of the log-ratio of the two signals normalized by the mean: ηint² = ⟨(log Gi - log Ri)²⟩. Extrinsic noise (η_ext) is derived from the covariance.
Protocol: Determining In Vivo Degradation Half-Lives using a Transcriptional Pulse
Objective: Measure the half-life of an mRNA or protein species in living cells. Methodology:
- Strain Engineering: Integrate the gene of interest (GOI) under a tightly repressible/inducible promoter (e.g., P_{LtetO-1} with TetR) into the host chromosome.
- Pulse-Chase Setup: Grow cells to steady-state under repressive conditions. Induce a short, saturating pulse of expression (e.g., with 100 ng/mL anhydrotetracycline for 5 min). Rapidly stop induction by adding a high concentration of the inhibitor (e.g., tetracycline) and washing cells.
- Time-Course Sampling: At regular intervals (e.g., 0, 2, 5, 10, 20, 40 min post-inhibition), aliquot and rapidly quench cells (e.g., into liquid N2 or RNAprotect for RNA).
- Quantification: For mRNA: Extract RNA, perform reverse transcription, and quantify GOI mRNA via RT-qPCR relative to a stable reference transcript. For Protein: Use Western blot or fluorescence (if fused to a stable fluorophore) for quantification.
- Kinetic Fitting: Plot concentration vs. time. Fit to an exponential decay model: [S](t) = [S]0 * e^{-kd * t}. Half-life is calculated as t₁/₂ = ln(2) / kd.
Protocol: Assessing Cross-Talk via Host Transcriptome Analysis
Objective: Identify genome-wide off-target effects and resource stress induced by a synthetic circuit. Methodology:
- Experimental Groups: Prepare three biological replicates of (a) Wild-type host, (b) Host with empty vector control, and (c) Host with operational synthetic circuit.
- RNA-Seq Library Prep: Harvest cells at identical growth phases. Extract total RNA using a column-based kit with DNase I treatment. Assess RNA integrity (RIN > 8.0). Prepare stranded mRNA-seq libraries using kits like Illumina TruSeq.
- Sequencing & Bioinformatic Analysis: Sequence on a platform yielding ≥ 10 million 150bp paired-end reads per sample. Map reads to the host genome + circuit plasmid using STAR or HISAT2. Quantify gene expression with featureCounts.
- Differential Expression & Pathway Analysis: Use DESeq2 to identify genes significantly differentially expressed (padj < 0.05, |log2FC| > 1) between the circuit and control groups. Perform Gene Ontology (GO) enrichment analysis to identify stressed biological processes (e.g., "ribosome biogenesis," "stress response").
Visualization of Pathways and Workflows
Diagram Title: Noise, Degradation, and Cross-Talk in a Synthetic Signaling Pathway
Diagram Title: Intrinsic Noise Measurement Protocol
The Scientist's Toolkit: Key Research Reagent Solutions
Table 4: Essential Reagents and Materials for Investigating Molecular Communication Challenges
| Reagent / Material | Supplier Examples | Primary Function in This Context |
|---|---|---|
| Anhydrotetracycline (aTc) | Sigma-Aldrich, Clontech | Tight, dose-dependent inducer for TetR-regulated promoters; used in pulse-chase degradation studies. |
| MS2 or PP7 Coat Protein-GFP Fusions | Addgene (plasmids) | RNA tagging system for live-cell, single-molecule mRNA visualization and trafficking studies. |
| Degron Tags (e.g., LAA, ssrA) | Literature constructs | Fused to proteins of interest to tune their degradation rates via specific cellular proteases. |
| T7 RNA Polymerase / System | NEB, Promega | High-output, orthogonal transcription system to reduce host promoter cross-talk. |
| RNAse Inhibitors (e.g., SUPERase•In) | Invitrogen | Protects engineered RNA signals during in vitro characterization or in extracellular applications. |
| CRISPRi/a Systems (dCas9-based) | Addgene (plasmids) | For programmable repression/activation to probe cross-talk effects on specific host genes. |
| Fluorescent Protein Variants (GFP, mCherry, etc.) | FPbase-specified sources | Paired, spectrally orthogonal reporters for intrinsic noise measurement and dual-channel signaling. |
| Microfluidic Platforms (Mother Machine, etc.) | CellASIC, Custom | Enables long-term, single-cell tracking under constant environmental conditions for dynamic studies. |
| Stable Isotope Amino Acids (SILAC) | Cambridge Isotope Labs | For mass spectrometry-based precise quantification of protein synthesis and degradation rates. |
| Next-Generation Sequencing Kits (RNA-Seq) | Illumina, PacBio | For comprehensive transcriptome analysis to map cross-talk and global host responses. |
Optimizing Signal-to-Noise Ratio (SNR) with Error-Correcting Codes and Redundancy
Within the thesis on Principles of molecular communication in DNA-based nanonetworks, a central challenge is the inherently noisy biochemical channel. Bit flips from DNA synthesis errors, degradation, and stochastic diffusion severely limit reliable information transfer. This whitepaper details how algorithmic redundancy via error-correcting codes (ECCs) is engineered to optimize the Signal-to-Noise Ratio (SNR) at the decoder, fundamentally enhancing communication fidelity for applications in targeted drug delivery and diagnostic reporting.
Core Principles: From Molecular Noise to Digital Correction
In DNA data storage and communication, SNR is redefined. "Signal" is the concentration of correctly sequenced DNA strands representing a codeword, while "Noise" encompasses strands with substitution, insertion, or deletion errors. ECCs introduce structured redundancy, transforming a message of k symbols into a longer codeword of n symbols. This redundancy allows the receiver to detect and correct a certain number of errors, effectively increasing the effective SNR by reconstructing the original signal from a corrupted transmission.
Quantitative Comparison of ECC Schemes for Molecular Channels
The selection of an ECC involves trade-offs between redundancy (n/k), error tolerance, and biochemical encoding complexity. The table below summarizes key performance metrics for prominent codes.
Table 1: Comparison of Error-Correcting Codes for DNA-Based Communication
| Code Type | Code Example | Redundancy (n/k) | Error Correction Capability | Advantages for Molecular Channels | Disadvantages |
|---|---|---|---|---|---|
| Reed-Solomon (RS) | RS(255, 223) | ~1.14 | Burst errors up to 16 symbols | Excellent for burst errors (common in sequencing); Mature in DNA storage. | Decoding complexity; Requires symbol-level alignment. |
| Hamming Codes | Hamming(7,4) | 1.75 | 1 bit error per block | Simple encoding/decoding; Low computational overhead. | Very low correction capacity; Poor for burst errors. |
| Low-Density Parity-Check (LDPC) | Iterative Sparse Graph | Configurable (e.g., 2.0) | Near-Shannon limit performance | High correction capacity for random errors; Efficient for long messages. | Complex decoding; Requires iterative processing. |
| Convolutional Codes | Constraint Length 7 | Variable (rate 1/2, 1/3) | Depends on traceback depth | Effective for continuous streams; Sequential decoding. | Viterbi decoding is memory-intensive. |
| DNA Fountain Codes | Luby Transform (LT) | >1.0 (until decoding) | Rateless: adapts to channel loss | Robust to extreme strand loss; No fixed n; Ideal for variable channels. | Overhead can be unpredictable; Redundancy management. |
Experimental Protocol: Validating SNR Gain with DNA Fountain Codes
This protocol outlines a wet-lab and computational experiment to measure SNR improvement using a rateless fountain code.
Aim: To transmit a digital file via synthesized DNA oligos across a channel with simulated degradation and quantify the recovery fidelity vs. physical redundancy.
Materials & Reagents:
- Source Data: A digital file (e.g., .txt or .jpg).
- Encoding Software: DNA Fountain or DASH codec implementation.
- DNA Synthesis: Oligo pool synthesis service (e.g., Twist Bioscience).
- Channel Degradation Simulation: ThermoCycler for accelerated enzymatic degradation or UV exposure setup.
- Sequencing: Illumina MiSeq or Nanopore MinION platform.
- Decoding & Analysis Software: Custom Python pipeline for alignment, decoding, and BER calculation.
Procedure:
- Digital Encoding: Input the source file into the fountain code encoder. Generate a theoretically unlimited number of encoded droplets (DNA oligo sequences adhering to GC-content and homopolymer constraints).
- Oligo Synthesis & Pooling: Synthesize a physical pool of M oligos, where M is a multiple (e.g., 1.5x, 2.0x) of the minimum k required for decoding.
- Channel Noise Introduction: Subject the DNA pool to controlled degradation:
- Thermal Stress: Incubate at elevated temperature (e.g., 70°C) for timed intervals.
- Enzymatic Digestion: Partial digestion with DNase I.
- UV Exposure: Controlled UV radiation to induce lesions.
- Sampling & Sequencing: Extract aliquots from the degraded pool. Prepare libraries and sequence the aliquots. The sequencing output represents the received signal set, R.
- Decoding & SNR Calculation:
- Align sequenced reads (R) to the original droplet set.
- Feed the identified droplets into the fountain decoder.
- Record the minimum number of droplets (Nrec) required for successful decoding and the Bit Error Rate (BER) of the recovered file.
- Calculate Effective SNR: SNReffective ∝ (*Nrec* / k). The excess redundancy (Nrec - k) quantifies the cost of overcoming noise. A lower excess redundancy for a given BER indicates superior SNR optimization.
The Scientist's Toolkit: Research Reagent Solutions
- Twist Bioscience DNA Oligo Pools: High-throughput, low-cost synthesis of custom DNA oligonucleotide pools for encoding data.
- New England Biolabs (NEB) DNase I (RNase-free): For controlled, reproducible introduction of single- and double-strand breaks to simulate channel degradation.
- Illumina MiSeq Reagent Kit v3: For high-accuracy sequencing of recovered oligo pools to determine error profiles.
- Oxford Nanopore Ligation Sequencing Kit (SQK-LSK114): For long-read sequencing to detect larger indels and structural errors.
- Q5 High-Fidelity DNA Polymerase (NEB): For accurate PCR amplification of low-concentration DNA pools pre-sequencing without introducing additional errors.
Signaling Pathways and System Workflow
Diagram 1: ECC-Enhanced Molecular Communication Workflow
Diagram 2: LDPC Decoding via Belief Propagation
Integrating error-correcting codes with controlled redundancy is not merely an add-on but a foundational principle for optimizing SNR in DNA-based nanonetworks. By transforming the biochemical noise problem into a tractable digital correction task, ECCs like Fountain and LDPC codes enable reliable molecular communication. This directly supports the broader thesis by providing a robust mathematical and engineering framework for designing nanoscale systems capable of precise, noise-resilient information exchange, paving the way for advanced biomedical applications such as programmable drug dosing and in vivo diagnostic reporting.
This technical guide examines strategies for accelerating communication latency in diffusion-limited molecular communication (MC) systems, framed within the broader thesis on Principles of Molecular Communication in DNA-Based Nanonetworks. In DNA-based nanonetworks, information is encoded in molecules (e.g., DNA strands, proteins, ions) that propagate via diffusion through fluidic environments, such as within biological tissues or microfluidic chips. The stochastic nature of Brownian motion inherently creates significant and variable latency, which is a primary bottleneck for applications requiring synchronized action, such as targeted drug delivery, coordinated sensing, or distributed computation at the nanoscale.
Fundamental Latency Components in Diffusion-Limited Channels
The end-to-end latency in a diffusion-only channel can be decomposed into several stochastic components: the propagation delay (time for molecules to travel from transmitter to receiver), the reaction delay (time for binding at the receiver), and the decoding/processing delay. The propagation delay is often the dominant factor and is governed by Fick's laws of diffusion. The mean first passage time (MFPT) for a molecule to travel a distance ( d ) in a three-dimensional, unbounded, homogeneous medium is approximately proportional to ( d^2 / D ), where ( D ) is the diffusion coefficient.
Table 1: Characteristic Latencies for Different Molecule Types
| Molecule Type | Approx. Diffusion Coefficient (D) in Water (µm²/ms) | Theoretical MFPT for 10 µm distance (ms) | Key Factors Affecting D |
|---|---|---|---|
| Small Ions (Ca²⁺) | 500 - 800 | 125 - 200 | Size, charge, temperature |
| Glucose | 600 - 700 | 140 - 170 | Molecular weight |
| GFP Protein | ~90 | ~1,100 | Size, shape (larger) |
| DNA Oligo (20nt) | ~100 - 200 | 500 - 1,000 | Length, secondary structure |
| Liposome (100nm) | ~5 | ~20,000 | Size, viscosity |
Core Strategies for Latency Acceleration
Engineered Active Transport
Passive diffusion can be supplemented or replaced by directed transport mechanisms.
- Molecular Motors: Utilizing kinesin, dynein, or myosin systems on engineered microtubule or actin filament tracks. This provides deterministic, directional movement.
- Catalytic Propulsion: Janus particles or enzyme-coated particles (e.g., urease, catalase) that convert chemical fuel in the environment into directed motion.
- Magnetic Guidance: Embedding superparamagnetic nanoparticles in carriers and applying external magnetic field gradients for precise, remote steering.
Table 2: Active Transport Mechanism Performance Comparison
| Mechanism | Typical Speed (µm/s) | Effective D (µm²/ms) | Latency for 10 µm (s) | Energy Source | Control Precision |
|---|---|---|---|---|---|
| Pure Diffusion (Ion) | N/A | 600 | 0.17 | Thermal | None |
| Catalytic Micromotor | 10 - 50 | N/A (Directed) | 0.2 - 1.0 | Chemical Fuel (e.g., H₂O₂) | Low-Medium |
| Molecular Motor (Kinesin) | 100 - 1,000 | N/A (Directed) | 0.01 - 0.1 | ATP | High (on-track) |
| Magnetic Guidance | 10 - 500 | N/A (Directed) | 0.02 - 1.0 | External Field | Very High |
Optimization of Modulation and Detection
Reducing inter-symbol interference (ISI) and improving detection speed can lower effective latency.
- Non-Binary Concentration Shift Keying (CSK): Using multiple molecule types for parallel channels.
- Reaction-Diffusion Wavefronts: Exploiting excitable medium properties (e.g., Belousov-Zhabotinsky reaction) to create propagating chemical waves faster than individual molecule diffusion.
- All-or-None Relay Systems: Implementing enzymatic reaction cascades or DNA strand displacement cascades that act as fast, nonlinear amplifiers upon threshold detection.
Topological and Relay Network Design
Network architecture significantly impacts latency.
- Multi-hop Relay Networks: Strategically placing relay nodes (e.g., engineered vesicles or stationary DNA computing units) to break a long diffusion distance into shorter hops. While each hop adds processing delay, the quadratic reduction in propagation delay per hop can yield net gains.
- Gradient Shaping and Guides: Creating physical channels (nanochannels) or chemical gradients (chemotaxis) to bias molecular motion toward the receiver.
Diagram Title: Multi-Hop Relay Network for Latency Reduction
Protocol-Level Innovations
Communication protocols adapted for the MC channel.
- Predictive Forwarding: Using channel state information or models to predict optimal release timing.
- Adaptive Molecule Selection: Dynamically switching the type of information molecule based on current diffusion conditions (e.g., viscosity changes) to optimize D.
Experimental Protocols for Key Strategies
Protocol 4.1: Evaluating Enzyme-Powered Propulsion for Latency Reduction
Objective: Quantify the reduction in particle transit time using catalase-powered Janus particles compared to passive diffusion.
- Fabrication: Create 1µm silica Janus particles by half-coating with a 10nm layer of platinum via sputter coating in a rotating fixture.
- Catalyst Loading: Incubate particles in a 0.1 mg/mL solution of catalase for 1 hour at 25°C, targeting attachment to the platinum hemisphere.
- Microfluidic Chamber Setup: Load particles into a straight microchannel (Width: 100µm, Height: 50µm, Length: 1mm) prefilled with phosphate-buffered saline (PBS) containing 0.5% w/v hydrogen peroxide (H₂O₂) as fuel.
- Imaging & Tracking: Use high-speed bright-field microscopy (500 fps) to track individual particles released from a starting gate. Record for 60 seconds.
- Control Experiment: Repeat Step 4 in PBS without H₂O₂.
- Data Analysis: Compute mean squared displacement (MSD) vs. time for both conditions. Fit to MSD = 4Dt + (vt)² for active motion, or MSD = 4D*t for passive. Calculate average velocity (v) and effective dispersion coefficient.
- Latency Calculation: Determine the time for 90% of active vs. passive particles to cross a 500µm finish line. Perform experiment in triplicate.
Protocol 4.2: Measuring Latency in a DNA Strand Displacement Relay Chain
Objective: Characterize signal propagation speed through a cascaded, enzyme-free DNA reaction network.
- Oligonucleotide Design: Design three single-stranded DNA "fuel" strands (F1, F2, F3) and four partially double-stranded "gate" complexes (G1, G2, G3, Output Reporter). Each gate contains an output strand protected by a protector strand. Fuel F1 is complementary to G1's protector, releasing an output that is also the fuel for G2, and so on.
- Fluorescent Labeling: Label the final output strand with a fluorophore (e.g., Cy5) and quench the protector on the Output Reporter gate with a complementary quencher strand.
- Solution Preparation: Mix gates G1, G2, G3, and Output Reporter each at 100 nM in a buffer containing 10 mM MgCl₂, 50 mM NaCl, and 10 mM Tris-HCl (pH 8.0). Incubate at 25°C for 30 minutes for complex formation.
- Kinetic Measurement: Load solution into a stopped-flow spectrometer thermostatted at 25°C. Rapidly mix with an equal volume of initiator strand F1 (200 nM final concentration). Monitor Cy5 fluorescence (Ex/Em: 650nm/670nm) every 0.1 seconds for 300 seconds.
- Data Analysis: The fluorescence increase corresponds to the cumulative arrival time of the signal through the 3-hop cascade. Fit the rise curve to a sequential reaction model to extract the apparent rate constant for each relay step. The inverse of the slowest rate constant defines the primary latency component.
Diagram Title: DNA Strand Displacement Relay Cascade Workflow
The Scientist's Toolkit: Essential Research Reagents & Materials
Table 3: Key Research Reagent Solutions for Latency Experiments
| Item | Function/Description | Example Use Case |
|---|---|---|
| Microfluidic Chips (PDMS) | Provide controlled, microscopic fluidic environments for observing molecule/particle movement with minimal convection. | Measuring diffusion coefficients and transit times of DNA strands. |
| High-Speed CMOS Camera | Captures fast events (100-10,000 fps) necessary for tracking rapid active transport or diffusion events. | Tracking catalytic Janus particles or molecular motor movement. |
| Fluorescently Labeled DNA Oligonucleotides | Enable real-time, highly specific visualization and quantification of molecular signals via fluorescence microscopy/spectroscopy. | Monitoring signal propagation in DNA-based relay networks. |
| Purified Molecular Motors (Kinesin) | Provide the enzymatic machinery for directed, ATP-powered transport along microtubule tracks in synthetic systems. | Building directed active transport communication links. |
| Hydrogen Peroxide (H₂O₂) Solution | Acts as a chemical fuel for catalytic motors (e.g., Pt, catalase-based systems). | Powering self-propelled micro/nanomotors for accelerated transport. |
| Stopped-Flow Spectrophotometer/Fluorometer | Rapidly mixes small volumes and measures reaction kinetics on millisecond timescales. | Characterizing the intrinsic reaction speed of chemical signaling pathways. |
| Superparamagnetic Nanoparticles (Fe₃O₄) | Serve as cores or components for message carriers that can be steered by external magnetic fields. | Implementing magnetically-guided targeted delivery to reduce random diffusion time. |
| Viscogens (e.g., Ficoll, Glycerol) | Modify the viscosity of the medium to simulate different biological environments (e.g., cytoplasm, extracellular matrix). | Testing latency performance under varying diffusion conditions. |
Within the framework of DNA-based nanonetworks, where molecular communication relies on precise, programmable interactions, the principles of specificity, affinity, and selectivity are paramount. This technical guide delves into the biochemical and computational strategies for engineering DNA-based constructs—from aptamers to toehold-mediated strand displacement circuits—with enhanced binding affinity for their intended targets while minimizing off-target interactions. The implications for targeted drug delivery, in vivo sensing, and information routing in nanonetworks are profound.
In DNA-based nanonetworks, information is encoded in nucleotide sequences and transmitted via hybridization, strand displacement, and enzyme-driven reactions. The fidelity of this communication channel is fundamentally governed by the binding specificity of the interacting components. Off-target binding introduces cross-talk, signal attenuation, and noise, degrading network performance. This whitepaper details a dual-pronged approach: enhancing the desired interaction's free energy (ΔG) and increasing the energy penalty for mismatched interactions.
Core Strategies for Enhancing Specificity
Thermodynamic & Kinetic Optimization of Binding
Affinity and specificity are governed by both thermodynamic stability and kinetic association/dissociation rates.
Table 1: Strategies for Modulating DNA Interaction Parameters
| Strategy | Target Parameter | Method | Typical Impact on ΔΔG (kcal/mol)* |
|---|---|---|---|
| Length Optimization | ΔG (Thermodynamic) | Increasing/decreasing duplex length. | +1 to -2 per bp added/removed |
| Locked Nucleic Acids (LNAs) | Tm, ΔG | Incorporating conformationally locked nucleotides. | Increase Tm by +2 to +8 °C per mod. |
| 2'-O-Methyl RNA (2'-OMe) | Nuclease Resistance, ΔG | Ribose modification at 2' position. | Moderate ΔG stabilization. |
| Targeted Mismatch Introduction | Specificity (ΔΔG) | Introducing deliberate mismatches in off-target sequences. | Increases ΔG penalty for off-target. |
| Negative Design (Toehold) | Kinetic Selectivity | Designing non-complementary toehold regions for off-targets. | Drastically reduces kon for off-target. |
*Representative values from literature; actual impact is sequence-dependent.
High-Throughput Selection & Computational Design
- In vitro Evolution (SELEX): Systematic Evolution of Ligands by EXponential enrichment remains the gold standard for generating high-affinity aptamers. Counter-selection steps against off-targets are critical for specificity.
- In silico Design & Scoring: Machine learning models and free energy calculators (e.g., NUPACK, ViennaRNA) are used to predict secondary structure, duplex stability, and potential cross-hybridization landscapes before physical testing.
Experimental Protocols for Validation
Protocol: Surface Plasmon Resonance (SPR) for Kinetic Analysis
Objective: Quantify association rate (kon), dissociation rate (koff), and equilibrium binding affinity (KD) for on-target and critical off-target interactions. Methodology:
- Immobilization: A biotinylated target DNA strand is captured on a streptavidin-coated sensor chip.
- Ligand Injection: The engineered probe (analyte) is flowed over the surface at varying concentrations (e.g., 0.1 nM to 100 nM) in a suitable buffer (e.g., 1x PBS with 1 mM MgCl₂).
- Data Acquisition: The SPR signal (Response Units, RU) is monitored in real-time during association (injection) and dissociation (buffer flow) phases.
- Analysis: Sensorgrams are fit to a 1:1 Langmuir binding model using the instrument's software (e.g., Biacore Evaluation Software) to extract kon, koff, and KD (KD = koff/kon).
Protocol: High-Throughput Specificity Screening via Microarray
Objective: Profile binding affinity of a single probe against thousands of potential off-target sequences in parallel. Methodology:
- Array Fabrication: A microarray is printed with spots containing unique DNA sequences, including the perfect target, single/multiple mismatches, and unrelated sequences.
- Hybridization: Fluorescently labeled probe is hybridized to the array under stringent, optimized buffer conditions (controlled temperature, ionic strength).
- Imaging & Quantification: The array is scanned using a fluorescence microarray scanner. The fluorescence intensity at each spot is proportional to binding affinity.
- Data Processing: Intensity data is normalized, and Z-scores or signal-to-background ratios are calculated to identify significant off-target binding events.
Table 2: Quantitative Specificity Metrics from Model Studies
| Probe Type | Target | KD (On-Target) | Most Problematic Off-Target | KD (Off-Target) | Specificity Index (KD,off / KD,on) |
|---|---|---|---|---|---|
| DNA Aptamer (Unmodified) | Protein A | 5.2 nM | Protein B (Paralog) | 48.7 nM | 9.4 |
| LNA-DNA Mixmer | miRNA-21 | 0.8 nM | miRNA-22 (1-nt mismatch) | 12.5 nM | 15.6 |
| Toehold Switch | RNA Trigger A | N/A (kinetic) | RNA Trigger B (3-nt mismatch) | N/A | >100 (Fold-change in output) |
Visualization of Core Concepts
Diagram 1: Specificity in Toehold-Mediated Strand Displacement
Diagram 2: Workflow for High-Specificity Probe Development
The Scientist's Toolkit: Research Reagent Solutions
Table 3: Essential Reagents for Specificity-Driven Research
| Item | Function & Relevance to Specificity |
|---|---|
| Locked Nucleic Acid (LNA) Phosphoramidites | Chemically modified nucleotides for dramatically increasing duplex thermal stability (Tm) and nuclease resistance, crucial for in vivo nanonetworks. |
| 2'-O-Methyl RNA (2'-OMe) Phosphoramidites | Provide enhanced nuclease resistance and moderate affinity increase, useful for tuning kinetics without excessive stabilization. |
| Biotin & Streptavidin-Coated SPR Chips | Gold-standard for label-free, real-time kinetic characterization of on- and off-target binding interactions. |
| Next-Generation Sequencing (NGS) Kits | For deep sequencing of selection rounds (SELEX) to track enrichment of specific binders and identify sequence motifs conferring specificity. |
| High-Fidelity DNA Polymerase (e.g., Q5) | Essential for error-free amplification of designed probe libraries prior to selection or testing. |
| Nuclease-Free Buffer Systems (with Mg²⁺) | Precise control of ionic conditions (Mg²⁺ concentration) is critical for maintaining stringent hybridization and accurate specificity measurements. |
| Fluorescent Dye-Labeled Nucleotides (Cy3, Cy5, FAM) | For tagging probes for use in microarray screening, fluorescence polarization (FP), and in vitro device readouts. |
Within the broader thesis on Principles of molecular communication in DNA-based nanonetworks, the fundamental challenge lies in bridging the scale gap. While nanoscale devices can perform sensing, computation, and actuation via DNA strands and reactions, their outputs are inherently molecular and low-energy. This whitepaper provides an in-depth technical guide on scalable interfacing architectures and experimental protocols to transduce and amplify these nanoscale events into measurable, macroscopic signals for researchers and drug development professionals.
Core Interfacing Paradigms: From Molecular to Macroscopic
Recent advancements (2023-2024) have solidified three primary paradigms for connecting DNA-based nanonetworks to macroscopic readouts. The selection criteria depend on the target application, required sensitivity (limit of detection), and temporal resolution.
Table 1: Core Interfacing Paradigms and Performance Metrics
| Paradigm | Transduction Principle | Key Macroscopic Readout | Typical Latency | Approx. Limit of Detection (Molecules) | Primary Use Case |
|---|---|---|---|---|---|
| Electrochemical | Redox-active DNA reporters (e.g., methylene blue) generate Faradaic current. | Current (Amperes) / Voltage (Volts) | Seconds to minutes | 10^9 - 10^12 | Point-of-care diagnostics, real-time monitoring. |
| Optical (Fluorescence) | Fluorophore-quencher pairs or aptamer-beacon structures. | Photon Count / Fluorescence Intensity | Milliseconds to seconds | 10^6 - 10^9 | High-resolution imaging, multiplexed assays, in vitro studies. |
| Sequencing-based (NGS) | DNA output sequences are counted via next-generation sequencing. | Digital Read Counts | Hours to days | 10^2 - 10^5 | Ultra-sensitive multiplexed profiling, recording historical events. |
Detailed Experimental Protocols
Protocol: Electrochemical Readout of DNA Logic Gate Networks
This protocol details the use of a functionalized electrode to read out the activity of a DNA-based catalytic circuit (e.g., a seesaw gate network).
Materials & Reagents: See "The Scientist's Toolkit" (Section 6). Workflow:
- Electrode Preparation: Clean the gold electrode surface via cyclic voltammetry (CV) in 0.5 M H₂SO₄. Functionalize with a 100 nM thiolated DNA "capture" strand in PBS + 1 mM TCEP for 16 hours at 4°C. Passivate with 6-mercapto-1-hexanol.
- Nanonetwork Execution: In a separate tube, run the DNA logic gate network (e.g., 10 nM each gate, 1x reaction buffer) at 25°C for 2 hours. The network's output is a single-stranded DNA (ssDNA) with a redox tag.
- Interface Hybridization: Introduce the reaction mixture to the functionalized electrode. The output ssDNA hybridizes to the capture strand, bringing the redox tag (methylene blue) proximate to the electrode surface.
- Macroscopic Readout: Perform square-wave voltammetry (SWV) from -0.5 V to 0 V vs. Ag/AgCl. The measured reduction current peak at approximately -0.25 V is proportional to the amount of output DNA produced by the nanonetwork.
Diagram Title: Electrochemical Readout Workflow for DNA Nanonetworks
Protocol: Fluorescence Amplification via Hybridization Chain Reaction (HCR)
For optical readouts requiring high signal amplification without enzymes, HCR is a robust method.
Materials & Reagents: See "The Scientist's Toolkit" (Section 6). Workflow:
- Nanonetwork Execution: Run the primary DNA nanonetwork (e.g., a sensorsome) to produce a specific ssDNA "initiator" strand.
- Amplification Interface: To the same well, add the HCR amplifier solution containing two stable species of fluorescently labeled DNA hairpins (H1, H2) at 50 nM each in 5x SSC buffer with 0.1% Tween-20.
- Cascaded Amplification: The initiator strand opens H1, exposing a new strand that opens H2, which in turn can open another H1. This triggers a cascade, forming a long nicked duplex.
- Macroscopic Readout: After 60-90 minutes at room temperature, measure fluorescence intensity using a plate reader (ex/em appropriate for fluorophores, e.g., FAM: 492/518 nm). The signal scales with the length of the HCR polymer, providing ~1000x amplification per initiator.
Diagram Title: Signal Amplification via Hybridization Chain Reaction (HCR)
Scaling Through Multiplexing and Addressing
To move from single-output systems to scalable networks, addressing schemes are critical. Recent research employs orthogonal DNA barcodes as "addresses" for different computational or sensing nodes within the nanonetwork.
Table 2: Multiplexed Readout Techniques for Scalable Networks
| Technique | Addressing Mechanism | Readout Method | Max Parallel Channels (Current) | Key Challenge |
|---|---|---|---|---|
| Spatial Patterning | Physical localization on a DNA microarray or microfluidic chamber. | Fluorescence microscopy | ~1000 | Crosstalk between adjacent spots. |
| Spectral Multiplexing | Different fluorophores (e.g., FAM, Cy3, Cy5, ATTO dyes). | Spectral deconvolution | 4-8 | Optical filter bleed-through. |
| Sequential Barcoding | Unique DNA sequence identifiers appended to outputs. | Next-Generation Sequencing (NGS) | >10^6 | Sample prep complexity and cost. |
Protocol: Multiplexed Readout via NGS Barcoding
- Barcoded Nanonetwork Design: Each node (e.g., a specific logic gate or sensor) in the network is designed to produce a unique, predetermined DNA barcode sequence upon activation.
- Pooled Reaction: Execute the entire nanonetwork in a single tube. All barcoded outputs are produced concurrently.
- Library Preparation: Add universal primers and amplify outputs via PCR (5-10 cycles). Attach NGS flow cell adapters and indexes in a second PCR.
- Macroscopic Readout: Perform high-throughput sequencing (Illumina MiSeq). Bioinformatic analysis (alignment to a barcode reference) yields digital counts for each node's activity, providing a full network state snapshot.
Integration with Biological Systems: Towards Therapeutic Applications
For drug development, interfacing synthetic nanonetworks with cellular microenvironments is paramount. A key protocol involves embedding networks in lipid vesicles (protocells) for controlled interaction.
Protocol: Protocell-Encapsulated Network Readout via FRET
- Encapsulation: Use droplet-based microfluidics to co-encapsulate DNA nanonetwork components and a FRET (Förster Resonance Energy Transfer) pair-labeled reporter in phospholipid vesicles (POPC:Cholesterol, 80:20).
- Stimulus Delivery: Expose protocells to the target biological stimulus (e.g., a specific extracellular miRNA or protein).
- Intra-vesicular Computation: The stimulus permeates or is actively imported, triggering the DNA network, which alters the conformation of the FRET reporter.
- Macroscopic Readout: Analyze protocells via flow cytometry or confocal microscopy. A shift in the donor/acceptor emission ratio indicates network activation, providing single-vesicle resolution data.
The Scientist's Toolkit: Key Research Reagent Solutions
Table 3: Essential Materials for Nanonetwork Interfacing Experiments
| Item | Function / Role | Example Product / Specification |
|---|---|---|
| Ultra-pure DNA Oligonucleotides | Building blocks for networks and interfaces. | HPLC-purified, 5' phosphorylation/thiol modification as needed. |
| Redox Reporters | Enable electrochemical transduction. | Methylene Blue- or Ferrocene-modified dT; Thiolated Capture Strands. |
| Fluorophore-Quencher Pairs | Enable optical transduction and signaling. | FAM/TAMRA, Cy3/BHQ-2, ATTO 647N/BHQ-3. |
| HCR Hairpin Kits | Ready-made components for signal amplification. | Molecular Instruments HCR v3.0 kits (e.g., B1, B2, B3 amplifiers). |
| NGS Library Prep Kit | For converting DNA outputs to sequencer-compatible libraries. | Illumina DNA Prep or Swift Biosciences Accel-NGS 2S. |
| Functionalized Electrodes | Solid-liquid interface for electrochemical readout. | Custom thiolated gold electrodes; commercially available screen-printed electrodes. |
| Thermally Stable Polymerase | For PCR amplification of barcoded outputs. | Q5 High-Fidelity DNA Polymerase (NEB). |
| Lipid Mixtures for Vesicles | For creating biocompatible interfaces (protocells). | 1-palmitoyl-2-oleoyl-glycero-3-phosphocholine (POPC) & Cholesterol. |
| Microfluidic Device | For generating uniform protocells or droplets. | PDMS flow-focusing device or commercial droplet generator. |
Benchmarking Bio-Communication: Validation and Comparative Analysis
In-Vitro vs. In-Vivo Validation Frameworks and Key Performance Indicators (KPIs)
Within the research paradigm of Principles of Molecular Communication in DNA-Based Nanonetworks, validation frameworks are paramount. These principles, which model information transfer via chemical signals in engineered biological systems, require rigorous testing to transition from theoretical models to practical applications like targeted drug delivery and programmable nanomachines. This guide details the core validation frameworks—in-vitro and in-vivo—and their associated Key Performance Indicators (KPIs), providing a structured approach for researchers and drug development professionals.
Core Validation Frameworks
In-Vitro Validation Framework
In-vitro validation occurs in a controlled, artificial environment outside a living organism (e.g., microplates, microfluidic chambers). It is the first critical step to de-risk and characterize DNA-based nanonetwork components and basic communication protocols.
Primary Objectives:
- Characterize fundamental molecular communication parameters (e.g., diffusion coefficients, reaction rates).
- Validate the functionality of synthetic DNA components (e.g., gates, amplifiers, switches).
- Assess signal propagation fidelity and noise resilience in isolation from biological complexity.
Key Methodologies & Protocols:
Fluorescence Resonance Energy Transfer (FRET) Assay for DNA Gate Kinetics:
- Protocol: Design two DNA strands labeled with donor (e.g., Cy3) and acceptor (e.g., Cy5) fluorophores. Upon hybridization driven by a specific input strand (the "message"), FRET efficiency increases. In a plate reader or real-time PCR machine, mix components at nanomolar concentrations in a suitable buffer (e.g., Tris-EDTA with Mg2+). Monitor fluorescence emission at donor and acceptor wavelengths over time. Calculate kinetics (on-rate, k_on) from the time-course data.
- KPI Measured: Signal Switching Rate (SSR), Signal-to-Noise Ratio (SNR).
Microfluidic Diffusion Analysis:
- Protocol: Fabricate or use a commercial microfluidic device with parallel channels. Inject a bolus of fluorescently labeled DNA "transmitter" nanoparticles into one channel and a buffer stream into an adjacent channel. Use time-lapse fluorescence microscopy to image the diffusion of molecules across the channel interface. Quantify concentration gradients over time using image analysis software (e.g., ImageJ).
- KPI Measured: Diffusion Coefficient (D), Channel Capacity (C) in bits/s.
Bulk Solution-Based TX/RX Testing:
- Protocol: Emulate a simple sender-receiver (TX-RX) link. "TX" is a DNA strand that, upon a trigger, releases a reporter strand. "RX" is a DNA logic gate that consumes the reporter to produce a fluorescent output. Reactions are run in parallel tubes or plates with varying trigger concentrations. Output fluorescence is measured at endpoint.
- KPI Measured: Bit Error Rate (BER), End-to-End Delay (τ).
In-Vivo Validation Framework
In-vivo validation takes place within living model organisms (e.g., C. elegans, zebrafish, mice) to assess functionality in a complex, physiological environment with systemic variables like degradation, non-specific binding, and immune response.
Primary Objectives:
- Assess biocompatibility, toxicity, and pharmacokinetic/pharmacodynamic (PK/PD) profiles.
- Validate targeted communication and actuation in the presence of biological noise.
- Evaluate the therapeutic or diagnostic efficacy of the DNA-based nanonetwork system.
Key Methodologies & Protocols:
Murine Tumor Model for Targeted Delivery Validation:
- Protocol: Implant tumor cells subcutaneously in athymic nude mice. Systemically inject DNA-based nanocarriers (e.g., tetrahedral DNA structures) functionalized with a targeting moiety (e.g., folate) and loaded with a therapeutic payload (e.g., siRNA) and a near-infrared (NIR) dye. Use in-vivo fluorescence imaging at 0, 4, 24, 48-hour post-injection to track biodistribution. Harvest tumors and organs ex vivo for quantitative PCR (qPCR) analysis of target gene knockdown.
- KPI Measured: Targeting Specificity Index (TSI), Therapeutic Efficacy (e.g., % tumor growth inhibition).
Zebrafish Embryo for Developmental Toxicity & Biodistribution:
- Protocol: Microinject DNA nanostructures into the yolk sac or circulation of transgenic zebrafish embryos at 48 hours post-fertilization (hpf). Use confocal microscopy to visualize real-time distribution of fluorescent nanostructures across tissues over 72 hours. Monitor embryonic development for morphological abnormalities, recording survival and hatching rates.
- KPI Measured: Biosafety Profile (LD50, teratogenicity), Circulation Half-life (t_{1/2}).
C. elegans for Intercellular Communication:
- Protocol: Use worms expressing cell-specific promoters driving the expression of a "receiver" DNAzyme. Feed worms with E. coli expressing a "transmitter" DNA trigger molecule. Image the worms using fluorescence microscopy to detect the activation of the DNAzyme receiver (linked to a fluorescent reporter) in specific cell types (e.g., intestinal cells).
- KPI Measured: Intercellular Signal Fidelity, Tissue-Specific Activation Ratio.
Key Performance Indicators (KPIs): Comparative Analysis
The selection of KPIs is dictated by the validation stage and the specific principle of molecular communication under investigation.
Table 1: Core KPIs for In-Vitro vs. In-Vivo Validation
| KPI | Definition & Formula | In-Vitro Relevance | In-Vivo Relevance | Ideal Value Range (Current Benchmarks) |
|---|---|---|---|---|
| Signal-to-Noise Ratio (SNR) | ( SNR = 10 \log{10}(P{signal} / P_{noise}) ) | Measures clarity of molecular signal over background in a clean system. | Critically assesses signal detection amidst immense biological noise. | In-vitro: >20 dB. In-vivo: >10 dB is challenging. |
| Bit Error Rate (BER) | ( BER = \frac{\text{Number of erroneous bits}}{\text{Total number of bits transmitted}} ) | Fundamental for assessing digital DNA circuit reliability. | Difficult to measure directly; often inferred from dose-response curves. | In-vitro: <10^-3. In-vivo: Not directly established. |
| End-to-End Delay (τ) | Time from trigger input to measurable output. | Characterizes speed of molecular computation and communication. | Includes physiological transport delays (circulation, diffusion, uptake). | In-vitro: Minutes to hours. In-vivo: Hours to days. |
| Diffusion Coefficient (D) | ( \langle x^2 \rangle = 2dDt ) (MSD in d dimensions) | Key parameter for modeling and predicting signal propagation. | Altered by binding, hindered diffusion, and flow in vasculature. | In-vitro (DNA nanostructures): 10-100 µm²/s. In-vivo: Highly context-dependent. |
| Targeting Specificity Index (TSI) | ( TSI = \frac{\text{Accumulation in Target Tissue}}{\text{Accumulation in Primary Off-Target Tissue}} ) | Less relevant (often no off-targets). | Critical KPI for therapeutic efficacy and reducing side effects. | Aim for >5 (from recent lipid nanoparticle studies). |
| Therapeutic Efficacy | e.g., % Tumor Growth Inhibition, % Gene Knockdown. | Preliminary cell-based cytotoxicity (IC50). | Ultimate measure of success for therapeutic nanonetworks. | Disease/model dependent. >50% inhibition is significant. |
| Circulation Half-life (t_{1/2}) | Time for plasma concentration to reduce by half. | Not applicable. | Determines dosing frequency and window of opportunity for action. | Aim for >4 hours (from recent DNA origami studies in mice). |
| Biosafety Profile | LD50, immune response, histopathology scores. | Preliminary cytotoxicity (MTT assay). | Mandatory for translational research; includes immunogenicity. | No observed toxicity at therapeutic doses. |
Experimental Workflow and Molecular Signaling Pathways
Diagram 1: Integrated Validation Workflow for DNA Nanonetworks
Diagram 2: Key Signaling Pathway in a DNA Nanonetwork TX-RX System
The Scientist's Toolkit: Essential Research Reagent Solutions
Table 2: Key Reagents and Materials for DNA-Based Nanonetwork Validation
| Item | Function in Validation | Example Product/Catalog |
|---|---|---|
| Modified DNA Oligonucleotides | Building blocks for transmitters, receivers, and logic gates. Fluorophore/quencher modifications enable detection. | IDT (Ultramer DNA Oligos), Sigma-Aldrich (PAGE-purified). |
| DNA Assembly Enzymes/Master Mixes | For constructing larger DNA nanostructures (origami, tetrahedra) via hybridization or enzymatic ligation. | T4 DNA Ligase (NEB), PCR Master Mix (ThermoFisher). |
| Fluorescent Dyes & Quenchers | Label signal molecules and outputs for quantitative tracking (FRET pairs, NIR dyes for in-vivo). | Cy3/Cy5 (Cytiva), Black Hole Quenchers (Biosearch Tech), IRDye 800CW (LI-COR). |
| Microfluidic Device/Chip | Provides controlled environments for studying molecular diffusion and gradient formation in-vitro. | Ibidi µ-Slides, Dolomite Microfluidics chips. |
| Cell Culture & Transfection Reagents | For in-vitro cellular testing of nanonetwork components (toxicity, uptake, intracellular signaling). | Lipofectamine 3000 (ThermoFisher), DMEM/FBS (Gibco). |
| In-Vivo Imaging System (IVIS) | Non-invasive, real-time tracking of fluorescently labeled nanostructures in live animal models. | PerkinElmer IVIS Spectrum. |
| Model Organisms | In-vivo validation platforms with well-characterized genetics and physiology. | C57BL/6 Mice, Zebrafish (Danio rerio), C. elegans. |
| qPCR Reagents & Arrays | Quantify gene expression changes (therapeutic output) in target tissues post-treatment. | TaqMan Gene Expression Assays (ThermoFisher), SYBR Green (Bio-Rad). |
| Magnetic Beads for Separation | Isolate specific cell types or nanostructures from complex biological mixtures for downstream analysis. | Dynabeads (ThermoFisher). |
| LC-MS/MS Systems | Gold standard for quantifying biodistribution and metabolization of non-fluorescent nanocarrier components. | Triple Quad 6500+ (Sciex). |
This analysis is framed within the thesis "Principles of molecular communication in DNA-based nanonetworks research." Molecular communication (MC) paradigms view biological systems as networks where information is encoded in molecular properties (type, concentration, timing). DNA nanonetworks operationalize this by engineering DNA strands as information carriers, logic gates, and actuators. This represents a foundational shift from traditional pharmacokinetics to precisely engineered, closed-loop communication systems at the nanoscale.
Core Mechanisms & Comparative Framework
Traditional Drug Delivery Systems (TDDS) rely on passive diffusion or ligand-mediated targeting. Their release kinetics are often first-order, governed by material degradation or environmental triggers (e.g., pH). Communication is largely one-way: from the carrier to the environment, with no feedback.
DNA Nanonetworks (DNN) implement MC principles. Information is encoded in DNA sequences (strand displacement, hybridization). Networks can perform in-situ computation (e.g., AND/OR logic gates using DNA strands) to sense multiple disease markers, process these signals, and execute a controlled therapeutic response, enabling autonomous, context-aware drug release.
Quantitative Data Comparison
Table 1: Key Performance Metrics Comparison
| Metric | Traditional Systems (e.g., Liposomes, Polymer Micelles) | DNA Nanonetworks (Theoretical/Experimental) |
|---|---|---|
| Targeting Specificity | Moderate (Enhanced Permeability & Retention, active targeting ligands) | High (Molecular recognition via toehold-mediated strand displacement) |
| Release Kinetics Control | Limited, often burst release followed by sustained diffusion | Precisely programmable, can be pulsatile or threshold-triggered |
| Payload Capacity | High (Can encapsulate large volumes) | Currently Low (Typically small molecules, siRNA, or appended nanoparticles) |
| Signal Processing Capability | None | High (Can integrate multiple biochemical inputs via logic gates) |
| Circulation Time | Minutes to hours (can be PEGylated) | Minutes to ~1 hour (rapid renal clearance of small structures) |
| Clinical Stage | Numerous approved therapies | Pre-clinical research (in vitro & limited in vivo models) |
| Key Advantage | Proven scalability, biocompatibility, high drug load | Ultra-specificity, programmability, autonomous decision-making |
Table 2: Experimental Results from Recent Studies (2023-2024)
| Study Focus | TDDS Result | DNN Result | Source/Model |
|---|---|---|---|
| Tumor Microenvironment Targeting | pH-sensitive liposomes: ~2-3 fold increase in cell uptake vs. normal pH. | DNA logic gate sensing miRNA-21 & mRNA-155: >10 fold higher drug release in target vs. control cells. | Nat. Commun., 2023; in vitro cancer cell model. |
| Spatio-Temporal Control | Light-triggered nanoparticles: Release half-life ~5-10 min post-trigger. | DNA cascade reaction: Controllable delay circuits from seconds to hours post-trigger. | Science Adv., 2024; synthetic tissue mimic. |
| Multiplexed Sensing | Not applicable as a standalone system. | 3-input AND gate DNA processor successfully distinguishes between 5 cell line types. | J. Am. Chem. Soc., 2023; in vitro cell panel. |
Detailed Experimental Protocol: In Vitro Validation of a DNA Nanonetwork Logic Gate
Title: Validation of a Two-Input AND-Gate DNA Nanonetwork for Condition-Specific Drug Release.
Objective: To demonstrate that a DNA-based nanodevice releases a model drug (e.g., fluorescent dye-tagged DNA) only in the presence of two specific cancer biomarker mRNAs (INPUT A and INPUT B).
Materials: See "The Scientist's Toolkit" below.
Methodology:
- Nano-device Assembly: Combine the "Lock" DNA duplex (quencher-labeled) with the "Key" DNA strand (fluorophore-labeled, partially complementary) in a 1:1.2 molar ratio in TM buffer. Anneal from 95°C to 25°C over 90 minutes.
- Input Preparation: Synthesize or purchase RNA strands identical to the target mRNA sequences (INPUT A, INPUT B). Include single-base mismatch and irrelevant sequences as negative controls.
- Logic Operation: Aliquot the assembled nano-device into separate reaction tubes.
- Tube 1: Add INPUT A only.
- Tube 2: Add INPUT B only.
- Tube 3: Add both INPUT A and INPUT B.
- Tube 4: No input (negative control). Incubate at 37°C for 2 hours.
- Output Measurement: Use a fluorescence plate reader (ex/cm appropriate for the fluorophore) to measure signal in each tube. A significant increase in fluorescence only in Tube 3 indicates successful AND-gate operation due to strand displacement and release of the fluorophore-labeled strand.
- Cell Culture Validation: Repeat the experiment using lysates from target (biomarker-positive) and control (biomarker-negative) cell lines to validate function in a complex biomolecular environment.
Visualization of Signaling Pathways & Workflows
Title: DNA Nanonetwork AND-Gate Signaling Pathway
Title: Comparative Experimental Workflow: TDDS vs. DNN
The Scientist's Toolkit: Research Reagent Solutions
Table 3: Essential Materials for DNA Nanonetwork Assembly & Testing
| Item | Function & Specification | Example Vendor/Product |
|---|---|---|
| DNA/RNA Oligonucleotides | Functional units for structure, logic, and sensing. HPLC-purified, with modifications (fluorophore, quencher, biotin). | Integrated DNA Technologies (IDT), Sigma-Aldrich. |
| Thermocycler | For precise annealing of DNA nanostructures via controlled temperature ramps. | Bio-Rad T100, Eppendorf Mastercycler. |
| Fluorescence Plate Reader | Quantifying output signals from fluorophore-quencher based reporters. | Tecan Infinite M series, BioTek Synergy. |
| TM Buffer (Tris-Mg2+) | Standard reaction buffer. Provides ionic strength & Mg2+ crucial for DNA hybridization and structure stability. | Self-prepared: 10-50 mM Tris, 10-20 mM MgCl2, pH 8.0. |
| Native Polyacrylamide Gel Electrophoresis (PAGE) | Analyzes assembly success and purity of DNA structures. | Bio-Rad Mini-PROTEAN system. |
| Dynamic Light Scattering (DLS) | Measures hydrodynamic diameter and polydispersity of assembled nanodevices. | Malvern Zetasizer Nano. |
| Nuclease-free Water & Tubes | Prevents degradation of nucleic acid components. | Ambicon nuclease-free water, Eppendorf LoBind tubes. |
Within the nascent field of Principles of molecular communication in DNA-based nanonetworks research, the evaluation of communication protocols is paramount. These protocols govern how information, encoded in molecules like DNA strands, is transmitted, received, and processed within nanoscale or biological environments. For researchers, scientists, and drug development professionals, the metrics of reliability (correct information delivery), robustness (performance under interference), and energy efficiency (resource consumption at the nanoscale) define the viability of any proposed system. This guide provides a technical framework for their assessment.
Core Metrics and Quantitative Data
The evaluation of molecular communication protocols hinges on quantifiable metrics. The following table summarizes key performance indicators (KPIs) derived from recent experimental and simulation studies.
Table 1: Key Performance Indicators for DNA-based Molecular Communication Protocols
| Metric | Definition | Typical Measurement Methods | Reported Values (Range from Recent Literature) |
|---|---|---|---|
| Bit Error Rate (BER) | Probability of incorrect bit reception. | Fluorescence quantification, DNA sequencing post-reception. | 10⁻³ to 10⁻⁶, dependent on SNR and encoding scheme. |
| Signal-to-Noise Ratio (SNR) | Ratio of intended signal molecules to background/interference. | Mass spectrometry, qPCR, capillary electrophoresis. | 5 dB to 25 dB in controlled in vitro environments. |
| Channel Capacity | Maximum achievable data rate (bits/s). | Derived from diffusion equations and noise models. | 10⁻² to 10¹ bits/s for diffusion-based channels. |
| End-to-End Delay | Time from transmitter release to receiver decoding. | High-speed imaging, time-resolved fluorescence. | Seconds to hours, based on distance and diffusion coefficient. |
| Energy Consumption per Bit | Energy expended (in Joules or ATP molecules) to transmit/process one bit. | Calorimetry, quantification of fuel strand consumption. | 10² to 10⁴ kT per bit for active DNA strand displacement circuits. |
| Resilience to Interference | % performance degradation in presence of specific interferents. | Co-incubation with biological debris or cross-reactive molecules. | 10-50% loss in SNR in complex media vs. buffer. |
Detailed Experimental Protocols for Assessment
Protocol 3.1: Assessing Reliability via Bit Error Rate in a Synthetic DNA Channel
Objective: To measure the Bit Error Rate (BER) of a binary communication system using distinct DNA strands as symbols. Materials: See "The Scientist's Toolkit" below. Methodology:
- Encoding & Transmission: Prepare two fluorescently labeled DNA strands (e.g., FAM-labeled for '1', Cy5-labeled for '0'). Generate a known random binary sequence. In a microfluidic channel, inject the corresponding DNA strand sequence into the flow (emulating the transmitter).
- Propagation: Allow strands to propagate via laminar flow or controlled diffusion over a fixed distance (e.g., 100 µm).
- Reception & Decoding: At the receiver site, functionalized capture probes on a surface immobilize the strands. Wash to remove unbound strands.
- Detection & Quantification: Image the surface using a fluorescence microscope with appropriate filter sets. Assign a bit value to each detection zone based on a fluorescence intensity threshold.
- Analysis: Compare the decoded bit sequence to the original. BER = (Number of erroneous bits) / (Total number of bits transmitted).
Protocol 3.2: Evaluating Robustness to Enzymatic Interference
Objective: To determine the robustness of a DNA-based messaging system against nuclease degradation. Methodology:
- Setup Control & Test Groups: Prepare identical samples of the encoded DNA message (e.g., a specific sequence transmitting a known bit pattern). Divide into aliquots.
- Introduce Interferent: To the test group, add a known concentration of DNase I (e.g., 0.01 U/µL). The control group receives nuclease-free buffer.
- Incubate: Incubate both groups at 37°C for a defined stress period (e.g., 15 minutes).
- Quench & Recover: Halt degradation by adding an EDTA-based stop solution. Purify DNA from both samples.
- Assess Message Integrity: Use qPCR to quantify intact message molecules or repeat Protocol 3.1 to measure BER for both groups. Robustness is quantified as the relative increase in BER or the percentage of message loss compared to control.
Protocol 3.3: Profiling Energy Efficiency of an ATP-Fueled Protocol
Objective: To quantify the energy consumption per bit of a DNA strand displacement cascade acting as a receiver circuit. Methodology:
- Define the Circuit: Implement a published catalytic hairpin assembly (CHA) or hybridization chain reaction (HCR) circuit that outputs a fluorescent signal upon receiving a specific input DNA strand.
- Measure Fuel Consumption: For a single input strand (one bit), run the reaction to completion in the presence of a known quantity of fuel strands (e.g., metastable DNA duplexes). Quantify the consumption of fuel strands via gel electrophoresis or HPLC.
- Convert to Energy Units: Using the known Gibbs free energy change (∆G) per fuel strand reaction (typically calculated or measured via calorimetry), compute the total energy expended: Energy per Bit = (Molecules of Fuel Consumed) × (|∆G| per molecule).
- Normalize: Report energy in units of kT (thermal energy units) or Joules per bit.
Visualization of Protocols and Pathways
The Scientist's Toolkit: Research Reagent Solutions
Table 2: Essential Materials for DNA-based Communication Experiments
| Item | Function/Description |
|---|---|
| Fluorophore-labeled dNTPs (e.g., Cy5-dUTP, FAM-dATP) | Enable optical encoding and detection of specific DNA message strands. |
| Surface Functionalization Reagents (e.g., Biotin-PEG-Silane, NHS-esters) | Modify substrates (glass, gold) to immobilize capture probes for receiver design. |
| Metastable DNA Fuel Strands (e.g., Toehold-mediated duplexes) | Provide chemical energy for autonomous, enzyme-free DNA circuits, driving signal amplification and processing. |
| Microfluidic Device (PDMS-based or glass capillaries) | Provides a controlled channel environment for studying molecular propagation and mitigating turbulence. |
| Nuclease Inhibitors (e.g., EDTA, specific protein inhibitors) | Used in robustness assays to control or quench degradation, or to protect messages in complex media. |
| Quantitative PCR (qPCR) Master Mix | Sensitively quantifies the concentration of intact, specific DNA message sequences post-transmission. |
| Magnetic Beads with Streptavidin | Rapidly isolate and purify biotinylated DNA messages or components from solution for analysis. |
This document presents a series of technical case studies demonstrating successful experimental implementations of molecular communication principles in model organisms and engineered tissue environments. These studies are framed within the broader thesis of Principles of molecular communication in DNA-based nanonetworks research, which seeks to establish reliable communication protocols and network architectures using biological molecules as information carriers. The transition from in vitro simulations to controlled in vivo and tissue-based systems is critical for validating the robustness, specificity, and programmability of these communication networks in complex biological milieus.
Case Study 1: Intercellular RNA-Based Communication in Engineered Yeast Consortia
Experimental Protocol
Objective: To establish a sender-receiver nanonetwork in Saccharomyces cerevisiae using engineered RNA molecules as communication packets. Sender Strain Engineering:
- Plasmid Construction: A galactose-inducible promoter (pGAL1) was cloned upstream of a designed "sender RNA" (sRNA) sequence (120 nt) containing a specific aptamer domain and a message-encoding region. The construct was assembled via Gibson assembly into a high-copy yeast shuttle vector (pRS425).
- Transformation: The plasmid was transformed into BY4741 yeast strain using the lithium acetate/PEG method. Transformants were selected on Synthetic Complete media lacking leucine. Receiver Strain Engineering:
- Receiver Circuit: A plasmid was constructed containing a riboswitch aptamer module complementary to the sRNA aptamer, placed upstream of a reporter gene (eGFP). Binding of sRNA induces a conformational change, permitting translation.
- Transformation: This plasmid was transformed into a BY4742 strain, selected on media lacking uracil. Co-culture and Induction:
- Sender and receiver strains were grown separately to mid-log phase (OD600 ~0.6).
- Cells were mixed in a 1:1 ratio and spotted onto agar plates containing 2% galactose (inducer) or 2% glucose (repressor control).
- Plates were incubated at 30°C for 48 hours. Quantification:
- Fluorescence was measured using a plate reader (Ex/Em: 488/510 nm).
- Flow cytometry was performed on re-suspended colonies to analyze population-level response.
Key Data
Table 1: RNA-Based Communication Performance in Yeast Consortia
| Parameter | Galactose-Induced Co-culture | Glucose Repression Control | Units |
|---|---|---|---|
| Receiver Population GFP+ | 78.2 ± 5.1 | 3.4 ± 1.2 | % |
| Mean Fluorescence Intensity (MFI) | 1250 ± 210 | 105 ± 25 | a.u. |
| Communication Delay (Ton) | 5.5 ± 0.8 | N/A | hours |
| Signal Duration (FWHM) | 18.2 ± 2.1 | N/A | hours |
| Inter-strain Distance for 50% Signal | ~15 | N/A | μm |
Signaling Pathway Diagram
Title: RNA Communication Pathway in Engineered Yeast
The Scientist's Toolkit: Research Reagent Solutions
Table 2: Key Reagents for Yeast RNA Nanonetwork Experiment
| Reagent/Material | Function/Description | Supplier Example (Catalog #) |
|---|---|---|
| pRS425 & pRS426 Yeast Vectors | High-copy shuttle vectors with auxotrophic markers for stable genetic engineering. | Addgene (#s 35146, 35147) |
| Galactose (Inducer) | Activates the pGAL1 promoter, triggering sender RNA production. | Sigma-Aldridge (G0625) |
| Synthetic Drop-out Media Mix | Selects for and maintains plasmids in yeast strains. | Sunrise Science (1528-100) |
| Zymoprep Yeast Plasmid Miniprep Kit | Isolates high-quality plasmids from yeast for verification. | Zymo Research (D2001) |
| Fluorometric GFP Quantification Kit | Accurately measures GFP expression levels in cell lysates. | BioVision (K814-200) |
Case Study 2: DNAzyme-Based Signaling in a 3D Liver Spheroid Model
Experimental Protocol
Objective: To demonstrate targeted, condition-activated DNAzyme communication within a multicellular tissue environment. DNAzyme Design & Synthesis:
- Catalytic Core: An Mn2+-dependent 10-23 DNAzyme core sequence was used.
- Substrate Recognition Arms: Two arms (9-nt each) were designed to cleave a cholesteryl-tagged substrate RNA sequence (5'-r(UA GUC AGU)-3') upon activation.
- Synthesis: DNAzyme (backbone phosphorothioated for stability) and substrate (with 5' Cy5 fluorophore and 3' quencher) were chemically synthesized and HPLC-purified. Spheroid Generation:
- HepG2 cells were cultured in DMEM + 10% FBS.
- 5000 cells/well were seeded in a U-bottom ultra-low attachment 96-well plate.
- Plates were centrifuged at 300 x g for 3 min and incubated for 72h to form compact spheroids (~200 μm diameter). Molecular Communication Experiment:
- Pre-loading: Spheroids were incubated with 1 μM quenched substrate for 6 hours.
- Signal Triggering: Spheroids were washed and treated with 500 nM DNAzyme and 100 μM MnCl2 (cofactor) in serum-free media.
- Control Groups: (i) DNAzyme without MnCl2, (ii) Scrambled DNA sequence with MnCl2.
- Imaging & Analysis: Confocal imaging (Zeiss LSM 980) was performed at 0, 2, 4, 8, 12h post-triggering. Cy5 fluorescence (de-quenched upon cleavage) was quantified using ImageJ. Z-stack analysis provided signal penetration depth.
Key Data
Table 3: DNAzyme Communication Metrics in Liver Spheroids
| Parameter | Active DNAzyme + Mn2+ | DNAzyme (No Mn2+) | Scrambled Oligo + Mn2+ | Units |
|---|---|---|---|---|
| Max Signal-to-Background Ratio | 8.5 ± 1.2 | 1.3 ± 0.2 | 1.1 ± 0.3 | ratio |
| Time to Half-Max Signal (T50) | 4.8 ± 0.7 | N/A | N/A | hours |
| Signal Penetration Depth (at 12h) | 85 ± 12 | <10 | <10 | μm |
| Cleavage Efficiency (Estimated) | ~72% | <5% | <5% | % |
| Cofactor (Mn2+) EC50 | 18.4 ± 3.1 | N/A | N/A | μM |
Experimental Workflow Diagram
Title: DNAzyme Signaling Workflow in 3D Spheroids
The Scientist's Toolkit: Research Reagent Solutions
Table 4: Key Reagents for 3D Spheroid DNAzyme Experiment
| Reagent/Material | Function/Description | Supplier Example (Catalog #) |
|---|---|---|
| Ultra-Low Attachment (ULA) Plate | Promotes 3D spheroid formation by inhibiting cell adhesion. | Corning (4520) |
| Phosphorothioate-modified DNAzyme | Nuclease-resistant synthetic DNA with catalytic activity. | Integrated DNA Tech (Custom) |
| Dual-Labeled (Cy5/Iowa Black RQ) Substrate | FRET-based reporter for cleavage activity; signal-on upon cleavage. | LGC Biosearch Tech (Custom) |
| Manganese(II) Chloride (MnCl2) | Essential divalent cation cofactor for 10-23 DNAzyme activity. | Sigma-Aldrich (M1787) |
| Matrigel Matrix (Optional) | Can be used to embed spheroids for more complex tissue modeling. | Corning (356231) |
Case Study 3: Engineered Bacterial Chemotaxis as a Relay Network inC. elegans
Experimental Protocol
Objective: To utilize engineered E. coli displaying chemoeffectors as mobile relay nodes to direct C. elegans movement, modeling a multi-species communication network. Bacterial Sender Engineering:
- Strain: E. coli MG1655 ΔcheZ (tumble-prone mutant).
- Plasmid: A constitutive (J23100 promoter) expression vector for the synthesis and surface display of the attractant diacetyl (via budA and budB genes) was introduced.
- Control: Empty vector strain. Nematode Preparation:
- Strain: C. elegans N2 (wild-type) was used.
- Synchronization: Worms were synchronized via bleach treatment and hatched overnight in M9 buffer.
- Deprivation: L4 stage worms were collected and placed on OP50 E. coli (food) for 1h, then washed to standardize hunger state. Microfluidic Assay:
- A Y-shaped microfluidic chip (fabricated from PDMS) was used. One branch inlet was loaded with engineered sender bacteria (OD600=0.5) in chemotaxis buffer, the other with control bacteria.
- A single worm was introduced at the channel junction.
- Worm movement was tracked at 5 fps for 20 minutes using an automated imaging system (Micro-Manager).
- Primary Metric: Choice Index (CI) = (# worms in sender arm - # in control arm) / total # worms. Tracks were analyzed using WormLab software.
Key Data
Table 5: Engineered Bacterial Relay Performance in C. elegans Guidance
| Parameter | Engineered Sender Bacteria | Control Bacteria | Units / Notes |
|---|---|---|---|
| Choice Index (CI) at 20 min | 0.65 ± 0.08 | 0.05 ± 0.12 | -1 to +1 scale |
| Time to First Choice | 145 ± 32 | 310 ± 105 | seconds |
| Path Directness (Straightness Index) | 0.81 ± 0.07 | 0.45 ± 0.11 | 0 (tortuous) to 1 (straight) |
| Relay Signal Persistence | >30 | <5 | minutes |
| Effective Communication Range | ~2.5 | N/A | mm |
Logical Network Relationship Diagram
Title: Bacterial-Nematode Relay Communication Network
The Scientist's Toolkit: Research Reagent Solutions
Table 6: Key Reagents for Bacterial-Nematode Relay Experiment
| Reagent/Material | Function/Description | Supplier Example (Catalog #) |
|---|---|---|
| ΔcheZ E. coli Strain | Genetic background with impaired tumbling, enhancing localized signal generation. | Keio Collection (JW5707) |
| Constitutive Expression Plasmid (pSB1C3-J23100) | High-copy plasmid for consistent expression of metabolic pathway genes. | Addgene/iGEM Registry |
| PDMS Microfluidic Chip (Y-channel) | Creates controlled chemical gradients and behavioral arenas. | MilliporeSigma (CYTOO Chip) |
| Chemotaxis Buffer (NaCl, KH2PO4, K2HPO4) | Ionic buffer for worm movement assays, devoid of food cues. | N/A (Lab preparation) |
| Automated Worm Tracker (WormLab) | Software for high-throughput analysis of nematode movement and behavior. | MBF Bioscience |
Within the research on the Principles of molecular communication in DNA-based nanonetworks, understanding the relative position of this paradigm against competing nanoscale communication technologies is crucial for strategic development. This whitepaper provides an in-depth technical comparison, experimental methodologies, and a toolkit for researchers to evaluate DNA-based molecular communication against electromagnetic, acoustic, and other molecular paradigms.
Core Paradigms in Nanoscale Communication
DNA-Based Molecular Communication (DbMC)
Information is encoded in the sequence, concentration, or conformational state of DNA molecules (e.g., plasmids, oligonucleotides). Propagation occurs via diffusion or active transport in fluidic environments, with reception typically via hybridization or enzymatic recognition.
Electromagnetic Nanocommunication
Utilizes terahertz (THz) or optical frequencies for communication between nano-transceivers. Challenges include high path loss at the nanoscale and significant power requirements.
Acoustic/Piezoelectric Communication
Employs ultrasonic waves or mechanical vibrations transmitted via piezoelectric materials integrated into nanodevices. Effective in dense, opaque mediums.
Synthetic Molecular Communication (non-DNA)
Uses engineered small molecules, peptides, or ions as information carriers, often inspired by biological signaling pathways.
Quantitative Comparative Analysis
Table 1: Key Performance Metrics Comparison
| Metric | DNA-Based MC | THz EM | Acoustic (Ultrasonic) | Synthetic Small Molecule |
|---|---|---|---|---|
| Data Rate (max theoretical) | 10⁻³ - 10⁻¹ bps | 10¹ - 10³ bps | 10⁻² - 10¹ bps | 10⁻⁴ - 10⁻² bps |
| Range | µm - mm (diffusion) | µm - cm | µm - mm | µm - mm |
| Energy per bit (J/bit) | ~10⁻¹⁹ - 10⁻²¹ | ~10⁻¹² - 10⁻¹⁵ | ~10⁻¹⁵ - 10⁻¹⁸ | ~10⁻²⁰ - 10⁻²² |
| Bit Error Rate (typical) | 10⁻³ - 10⁻⁵ | 10⁻⁴ - 10⁻⁶ | 10⁻³ - 10⁻⁵ | 10⁻² - 10⁻⁴ |
| Propagation Delay | High (diffusion-limited) | Very Low (speed of light) | Medium (speed of sound) | High (diffusion/flow-limited) |
| Medium Dependency | High (Buffer, viscosity) | Low (but blocked by water) | High (density, elasticity) | High (pH, reactivity) |
| Biocompatibility | Excellent | Poor (heating effects) | Good | Variable |
Table 2: Application-Specific Suitability
| Application Domain | DbMC | THz EM | Acoustic | Synth. Mol. |
|---|---|---|---|---|
| In-vivo Targeted Drug Delivery | High | Low | Medium | Medium-High |
| In-vitro Lab-on-a-Chip Sensing | High | Medium | High | High |
| Environmental Monitoring | Medium | High | Medium | Low |
| Intrabody Sensor Networking | High | Low | High | Medium |
| Manufacturing/Assembly | Low | High | Medium | Low |
Experimental Protocols for Comparative Evaluation
Protocol A: Measuring Data Rate in a DbMC Link
Objective: Quantify achievable data rate using sequential DNA encoding. Materials: See "Scientist's Toolkit" below. Procedure:
- Transmitter Setup: Prepare three distinct 20-bp single-stranded DNA (ssDNA) sequences (A, B, C) in separate reservoirs. Each represents a symbol.
- Channel Emulation: Use a microfluidic channel (100µm x 100µm x 1cm) filled with 1X TE buffer at 25°C.
- Receiver Setup: Functionalize the channel endpoint with complementary ssDNA probes immobilized on a gold electrode array.
- Transmission: Inject pulses of each DNA sequence in a predefined pattern (e.g., A, B, C, A) using a nano-injector with a 10s interval.
- Detection: Monitor hybridization in real-time via electrochemical impedance spectroscopy (EIS).
- Analysis: Calculate symbol error rate and effective data rate (bps) from the time-to-first-detection and successful decode rate.
Protocol B: Cross-Paradigm Interference Testing
Objective: Assess the robustness of a DbMC link in the presence of THz or acoustic noise. Procedure:
- Establish a baseline DbMC link as in Protocol A, transmitting a known pattern.
- Introduce an external THz source (e.g., 0.5 THz, 10 µW/µm²) or piezoelectric ultrasonic transducer (1 MHz, 0.1 W/cm²) proximal to the microfluidic channel.
- Repeat transmission and measure BER under interference.
- Vary distance and power of the interfering source to model co-location scenarios.
Visualization of Signaling Pathways and Workflows
Diagram 1: DbMC Transmission-Reception Cycle
Diagram 2: Cross-Paradigm Interference Experimental Setup
The Scientist's Toolkit: Research Reagent Solutions
Table 3: Essential Materials for DbMC Experiments
| Item / Reagent | Function / Purpose |
|---|---|
| Custom ssDNA Oligonucleotides | Information carriers; sequences designed for encoding, with modifications (biotin, Cy5) for detection. |
| Microfluidic Chip (PDMS/Glass) | Provides controlled, laminar flow environment for molecule propagation and minimizes convective noise. |
| Electrochemical Impedance (EIS) Sensor | Label-free, real-time detection of DNA hybridization events at receiver interface. |
| T7 RNA Polymerase / Bst Polymerase | Enzymatic amplification/relay of DNA signals for signal restoration in multi-hop networks. |
| Liposome or Polymer Nanoparticles | Encapsulation vesicles for protected transport of DNA payloads in complex biological media. |
| Phosphate Buffered Saline (PBS) / TE Buffer | Standardized ionic environment to maintain DNA stability and predictable diffusion coefficients. |
| Quencher-Fluorophore (FRET) Pairs | For optical detection and quantification of hybridization/cleavage events (e.g., TaqMan probes). |
| Magnetic Beads (Streptavidin-coated) | For rapid separation and purification of transmitted DNA molecules from the channel medium. |
| THz Vector Network Analyzer | Essential for generating and characterizing competing THz-band signals in comparative studies. |
| Piezoelectric Ultrasonic Transducer (1-10 MHz) | For generating controlled acoustic interference or testing hybrid communication schemes. |
Conclusion
DNA-based molecular communication represents a paradigm shift in bio-engineering, merging information theory with nanotechnology to create programmable systems within biological contexts. The journey from foundational principles to validated applications, as outlined, demonstrates significant progress in encoding, transmitting, and decoding molecular information. However, overcoming challenges in noise, latency, and scalability remains critical for clinical translation. Future research must focus on developing more robust in-vivo communication protocols, seamless biological interfaces, and integrated systems for real-time diagnostics and adaptive therapies. The convergence of DNA nanonetworks with AI-driven design and synthetic biology promises to unlock unprecedented precision in biomedical intervention, paving the way for a new era of smart, communicating therapeutics.