Buffer Selection for Nanoparticle Dispersion Stability: A Comprehensive Guide for Formulation Scientists
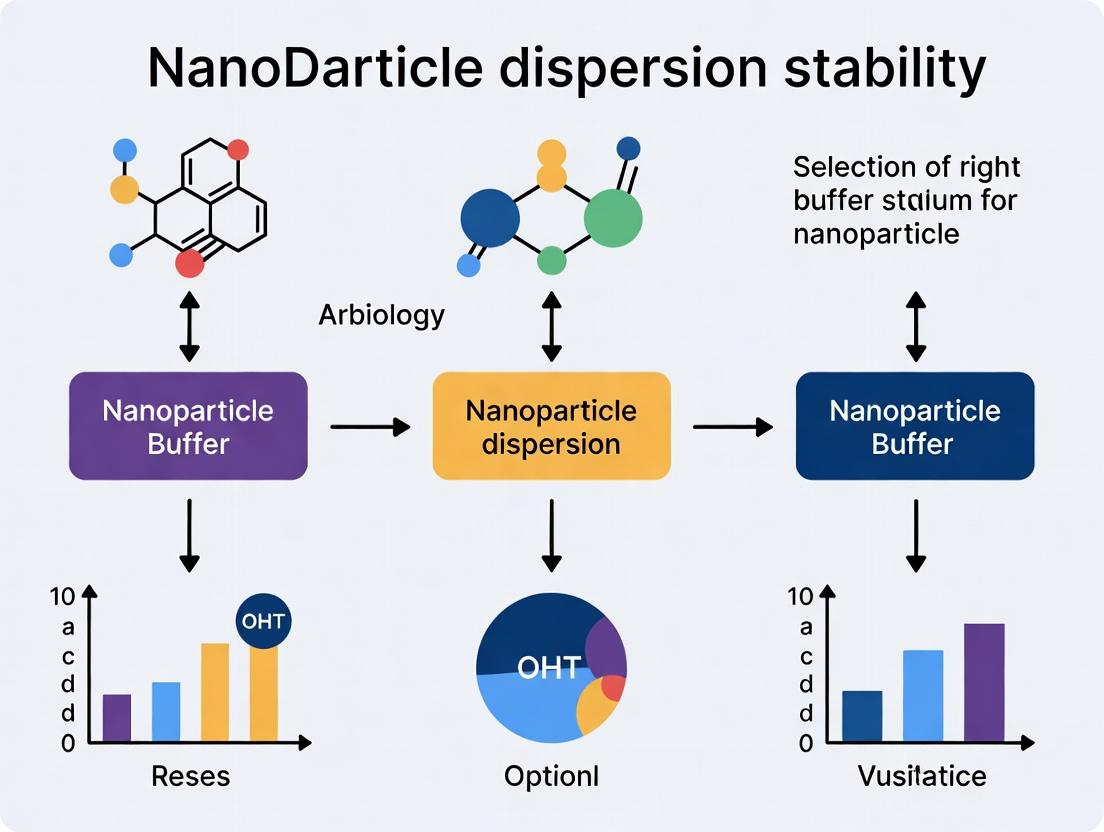
This article provides a systematic framework for selecting and optimizing buffers to achieve stable nanoparticle dispersions, crucial for drug delivery, diagnostics, and biomedical research.
Buffer Selection for Nanoparticle Dispersion Stability: A Comprehensive Guide for Formulation Scientists
Abstract
This article provides a systematic framework for selecting and optimizing buffers to achieve stable nanoparticle dispersions, crucial for drug delivery, diagnostics, and biomedical research. We explore the foundational principles of colloidal stability, detailing practical methods for buffer screening and formulation. The guide addresses common challenges like aggregation and sedimentation, offering troubleshooting strategies. Finally, we present validation techniques and comparative analyses of common buffer systems (e.g., PBS, Tris, citrate, HEPES) to empower researchers in making informed decisions for robust and reproducible nanomaterial applications.
The Science of Stability: Core Principles of Nanoparticle-Buffer Interactions
This technical support center provides troubleshooting guides and FAQs for researchers working on nanoparticle dispersion stability. The content is framed within the thesis that selecting the optimal buffer is paramount for controlling colloidal stability, preventing aggregation, and ensuring reproducible experimental results in drug development and material science.
FAQs & Troubleshooting Guides
Q1: Why do my nanoparticles aggregate immediately upon addition to a standard phosphate-buffered saline (PBS) solution?
A: PBS is a high-ionic-strength buffer. For many nanoparticles, especially those stabilized by electrostatic repulsion, the salts in PBS compress the electrical double layer. This diminishes the repulsive forces between particles, allowing van der Waals attractions to dominate, leading to rapid aggregation. Solution: Switch to a low-ionic-strength buffer (e.g., 1-10 mM Tris-HCl, pH 7.4) or incorporate a steric stabilizer like polyethylene glycol (PEG).
Q2: How does buffer pH affect the stability of my metal oxide nanodispersion?
A: Buffer pH directly determines the surface charge (zeta potential) of metal oxide nanoparticles. Stability is maximized when the pH is far from the particle's isoelectric point (IEP), where the zeta potential magnitude is highest.
Table 1: Isoelectric Points (IEP) of Common Metal Oxides
| Nanoparticle Material | Typical Isoelectric Point (pH) | Recommended pH Range for Stability |
|---|---|---|
| TiO2 (Titanium Dioxide) | 5.5 - 6.5 | pH < 4.5 or pH > 7.5 |
| SiO2 (Silica) | 1.5 - 3.0 | pH > 5 (highly negative charge) |
| ZnO (Zinc Oxide) | ~9.5 | pH < 8 |
| Fe3O4 (Magnetite) | 6.5 - 7.0 | pH < 5 or pH > 9 |
Q3: My citrate-coated gold nanoparticles are stable in water but aggregate in biological assay buffers. What's happening?
A: Citrate stabilization is electrostatic and relatively weak. Biological buffers often contain divalent cations (e.g., Mg²⁺ in cell culture media) which can bridge between negatively charged citrate groups on different particles, causing aggregation. Solution: Consider ligand exchange to a thiolated PEG, which provides steric stabilization that is more resilient to ionic strength and cation challenges.
Q4: What are the key buffer components to avoid with lipid nanoparticle (LNP) formulations?
A: LNPs are sensitive to specific ions and pH. Avoid buffers containing:
- Chelating agents (e.g., EDTA): Can destabilize ionically stabilized systems.
- High concentrations of divalent cations (Ca²⁺, Mg²⁺): Can promote fusion of some lipid membranes.
- Extreme pH (<4 or >9): Can hydrolyze lipid esters and promote degradation.
- Chloride ions at low pH: Can form HCl, degrading acid-labile cargo.
Experimental Protocols
Protocol: Determining the Optimal pH Range for Electrostatic Stabilization
Objective: To identify the pH range that maximizes zeta potential and minimizes aggregation for a novel nanoparticle.
Materials: See "The Scientist's Toolkit" below. Method:
- Buffer Preparation: Prepare 20 mM buffers across a pH range (e.g., pH 3-10). Use citrate (pH 3-6), phosphate (pH 6-8), Tris (pH 7-9), and carbonate (pH 9-11).
- Dispersion: Add 10 µL of concentrated nanoparticle stock to 990 µL of each buffer. Vortex gently for 5 seconds.
- Incubation: Let samples stand for 15 minutes at room temperature.
- Analysis: Measure the zeta potential and hydrodynamic diameter (DLS) of each sample.
- Data Interpretation: Plot zeta potential vs. pH and DLS size vs. pH. The optimal range is where |zeta potential| > |20 mV| and the measured size is closest to the primary particle size.
Protocol: Accelerated Stability Test for Buffer Screening
Objective: To rapidly assess the long-term stability of a nanodispersion in different buffer candidates.
Method:
- Sample Preparation: Disperse nanoparticles in 3-5 candidate buffer formulations (e.g., PBS, Tris-HCl, HEPES, with/without stabilizers).
- Stress Condition: Subject all samples to thermal stress (e.g., 37°C or 50°C) for 24-72 hours. Aggregation kinetics are accelerated at higher temperatures.
- Monitoring: Measure hydrodynamic diameter (Dh) by DLS at T=0, 6, 24, 48, and 72 hours.
- Criteria for Success: The optimal buffer is the one where the Dh increases by < 10% over the test period and shows no visible precipitation or color change (for plasmonic nanoparticles).
Table 2: Accelerated Stability Test Results (Hypothetical Data for 50 nm SiO2 Nanoparticles)
| Buffer Formulation (pH 7.4) | Initial Dh (nm) | Dh after 72h at 50°C (nm) | % Increase | Visual Inspection |
|---|---|---|---|---|
| 10 mM Tris-HCl | 52.3 ± 1.2 | 53.1 ± 2.1 | 1.5% | Clear, no change |
| 10 mM HEPES | 53.1 ± 0.9 | 54.8 ± 3.0 | 3.2% | Clear, no change |
| 1X PBS | 51.8 ± 1.5 | 2450 ± 320 | 4630% | Heavy precipitate |
| 2 mM Citrate | 54.5 ± 2.1 | 58.9 ± 5.6 | 8.1% | Slightly hazy |
Diagrams
Title: How Buffer Properties Drive Nanoparticle Aggregation
Title: Buffer Screening Experimental Workflow
The Scientist's Toolkit
Table 3: Essential Reagents for Nanodispersion Buffer Studies
| Item | Function in Experiment | Key Consideration |
|---|---|---|
| Tris-HCl Buffer | Low ionic-strength buffer; useful for pH 7-9 range. | Can undergo pH shift with temperature (~0.03 pH/°C). |
| HEPES Buffer | Biological buffer with good pH stability (pH 6.8-8.2). | May form radicals under light; can interfere in some assays. |
| Citrate Buffer | Low ionic-strength buffer for acidic pH range (3-6). | Can act as a reducing agent or coordinate to metal surfaces. |
| Zeta Potential Analyzer | Measures surface charge of nanoparticles in suspension. | Sample must be dilute and conductivity within instrument range. |
| Dynamic Light Scattering (DLS) Instrument | Measures hydrodynamic diameter and size distribution. | Sensitive to dust; always filter buffers (0.22 µm) before use. |
| Steric Stabilizer (e.g., mPEG-SH) | Thiolated PEG for grafting onto metal NPs to provide steric stability. | Use fresh solutions and allow adequate ligand exchange time. |
| 0.22 µm Syringe Filters | For removing dust and particulates from all buffer solutions. | Use nylon or PVDF for protein-containing buffers; avoid cellulose acetate with organic solvents. |
| Dialysis Tubing/Cassettes | For exchanging nanoparticle dispersion medium into a new buffer. | Select appropriate molecular weight cutoff (MWCO) to retain nanoparticles. |
Technical Support Center
Troubleshooting Guide: Common Issues in Nanoparticle Dispersion Stability Experiments
Issue 1: Rapid Aggregation in Saline Buffers
- Problem: Nanoparticles aggregate immediately upon addition to standard phosphate-buffered saline (PBS).
- Root Cause: High ionic strength screens electrostatic repulsion, as predicted by DLVO theory, allowing van der Waals attraction to dominate.
- Solution:
- Use a low-ionic-strength buffer (e.g., 1-10 mM NaCl or a sugar-based buffer).
- Introduce or increase steric stabilizers (e.g., 0.1% w/v PEG or polysorbate 80).
- Consider adjusting pH away from the nanoparticle's isoelectric point (IEP) to increase surface charge.
Issue 2: Time-Dependent Instability During Storage
- Problem: Dispersion is initially stable but forms aggregates over hours/days.
- Root Cause: Slow particle bridging by polymeric impurities, depletion flocculation, or Ostwald ripening (for non-uniform particles).
- Solution:
- Ensure all buffers and solutions are filtered (0.1 µm or 0.22 µm) to remove particulates.
- Avoid high concentrations of unbound polymers/detergents in the continuous phase.
- Use nanoparticles with a narrow size distribution to minimize ripening.
Issue 3: Inconsistent Zeta Potential Measurements
- Problem: High variability in zeta potential readings for the same sample.
- Root Cause: Improper sample preparation (conductivity mismatch, air bubbles, temperature fluctuations) or selecting the wrong measurement model.
- Solution:
- Dialyze nanoparticles into the exact buffer of measurement to match conductivity.
- Equilibrate sample in the measurement cell for 2-3 minutes.
- Use the Smoluchowski model for aqueous systems >100 nm and the Hückel model for non-aqueous or very small nanoparticles.
Issue 4: Buffer-Nanoparticle Chemical Incompatibility
- Problem: Nanoparticle surface degrades or dissolves, or buffer adsorbs onto surface.
- Root Cause: Specific chemical interactions (e.g., citrate etching of certain metal oxides, phosphate binding to cationic surfaces).
- Solution:
- Screen chemically inert buffers. For metal oxides, consider organic buffers like HEPES or MES.
- Perform short-term chemical stability assays (UV-Vis, ICP-MS) before long-term stability tests.
Frequently Asked Questions (FAQs)
Q1: How do I choose between electrostatic and steric stabilization for my nanoparticle formulation? A: The choice depends on your application. For in vitro diagnostic use, electrostatic stabilization in low-ionic-strength buffers is often sufficient. For in vivo therapeutic applications (drug delivery), steric stabilization with PEG or other polymers is mandatory to prevent opsonization and rapid clearance. A combination (electrosteric stabilization) is often optimal.
Q2: My DLS size is much larger than my TEM size. Does this mean my nanoparticles are aggregated? A: Not necessarily. Dynamic Light Scattering (DLS) measures the hydrodynamic diameter, which includes the solvation shell and any surface coatings, in a state of Brownian motion. TEM measures the core dry size. A consistent difference of several nanometers is expected. However, if the DLS size is double or more the TEM core size and is polydisperse, aggregation is likely.
Q3: According to DLVO theory, a zeta potential > |30| mV should confer stability. Why are my nanoparticles with ±35 mV zeta potential still aggregating? A: The |30| mV rule is a guideline for electrostatic stabilization in simple electrolytes. Aggregation can still occur due to:
- Non-DLVO forces: Hydrophobic attraction or specific chemical bonding.
- Depletion forces: From unbound polymers or molecules in solution.
- Incorrect pH: Measurement at a pH different from the actual storage/dispersion pH.
Q4: What is the most critical buffer parameter to control for fundamental DLVO studies? A: Ionic strength. It directly controls the Debye length (κ⁻¹), which is the thickness of the electrical double layer. This is the primary modulator of electrostatic repulsion in the DLVO framework. Use buffers with minimal salt contribution and adjust ionic strength with a simple salt like NaCl.
Table 1: Impact of Buffer Ionic Strength on Gold Nanoparticle (10 nm) Stability
| Buffer (pH 7.4) | Ionic Strength (mM) | Debye Length (nm) | Zeta Potential (mV) | Stable Dispersion Duration |
|---|---|---|---|---|
| 1 mM NaCl | ~1 | ~9.6 | -42 ± 3 | > 6 months |
| 10 mM HEPES | ~10 | ~3.0 | -38 ± 2 | > 1 month |
| Standard PBS | ~150 | ~0.78 | -15 ± 5 | Minutes to hours |
| Cell Culture Media | ~150+ (complex) | < 0.8 | -5 to +5 | Immediate aggregation |
Table 2: Common Stabilizing Agents and Their Mechanisms
| Stabilizing Agent | Typical Concentration | Primary Mechanism | Key Benefit | Consideration |
|---|---|---|---|---|
| Citrate | 1-10 mM | Electrostatic | Simple, well-understood | Sensitive to high ionic strength |
| PEG-thiol (MW 2000-5000) | 0.01-0.1 mM | Steric | Excellent in vivo stability | Can hinder active targeting |
| Polysorbate 80 (Tween80) | 0.05-0.2% v/v | Steric | Prevents protein adsorption | Potential for micelle formation |
| Polyvinylpyrrolidone (PVP) | 0.1-1% w/v | Electrosteric | Robust stability in various solvents | Can be difficult to remove |
Experimental Protocols
Protocol 1: Determining Critical Coagulation Concentration (CCC) Objective: To experimentally validate DLVO theory by finding the ionic strength at which rapid aggregation begins.
- Prepare Nanoparticle Stock: Purify nanoparticles (e.g., citrate-capped AuNPs) via centrifugation and resuspend in 1 mM NaCl solution at pH 7.
- Prepare Salt Solutions: Create a series of NaCl solutions in deionized water (e.g., 10, 50, 100, 200, 500 mM).
- Initiate Aggregation: In a microplate or cuvette, mix equal volumes (e.g., 100 µL) of nanoparticle stock and each NaCl solution. Final ionic strength is half of the NaCl solution.
- Monitor Kinetics: Immediately place in a UV-Vis spectrometer or plate reader. Measure absorbance at the plasmon peak (e.g., ~520 nm for AuNPs) every 10 seconds for 5-10 minutes.
- Data Analysis: Plot initial rate of absorbance change (or decrease at peak) vs. final NaCl concentration. The CCC is identified as the point where a sharp increase in aggregation rate occurs.
Protocol 2: Assessing Steric Stabilization with PEG Coating Objective: To evaluate the enhancement of colloidal stability in high-ionic-strength environments via steric hindrance.
- Functionalize Nanoparticles: Incubate nanoparticles (e.g., amine- or thiol-functionalized particles) with a molar excess of methoxy-PEG-NHS (or -SH) in the appropriate buffer (e.g., borate buffer for NHS) for 2 hours at room temperature.
- Purify: Remove unreacted PEG via gel filtration chromatography or repeated centrifugation/ultrafiltration. Resuspend in water.
- Challenge Test: Split the purified PEGylated and non-PEGylated nanoparticles into two sets.
- Set A: Dilute into 1 mM NaCl. Measure DLS size and PDI.
- Set B: Dilute into 150 mM PBS. Measure DLS size and PDI immediately and after 1 hour incubation.
- Analysis: Compare the size and PDI of PEGylated vs. non-PEGylated particles in PBS. Effective steric stabilization will show minimal change in size and low PDI (<0.2) for PEGylated particles.
Visualizations
Diagram Title: DLVO Total Interaction Energy Curve
Diagram Title: Buffer Selection Workflow for Nanoparticle Stability
The Scientist's Toolkit: Research Reagent Solutions
| Item & Purpose | Example Products/Formats | Key Function in Stability Research |
|---|---|---|
| Low-Ionic-Stength Buffers | Ultrapure water, 1-10 mM NaCl, 2-10 mM HEPES/ MES/ MOPS (pH adjusted) | Minimizes double-layer compression for studying electrostatic stabilization. Foundation for DLVO experiments. |
| Steric Stabilizers | Methoxy-PEG-Thiol (MW 2k-5k), Methoxy-PEG-NHS, Polysorbate 80 (Tween 80), Polyvinylpyrrolidone (PVP) | Provides a hydration shell and physical barrier to prevent close approach of particles, enabling stability in biological media. |
| Zeta Potential Reference Standards | Malvern Zeta Potential Transfer Standard (-50 mV ± 5 mV), NIST-traceable latex standards | Validates instrument performance and ensures accurate, comparable zeta potential measurements. |
| Precision Salts for Ionic Strength Adjustment | NaCl, KCl, CaCl₂ (ACS grade or higher), made into stock solutions with ultrapure water | Allows systematic, reproducible modulation of ionic strength to probe CCC and DLVO predictions. |
| Size & Concentration Standards | NIST-traceable polystyrene or silica nanoparticles (e.g., 30 nm, 100 nm) | Calibrates DLS and NTA instruments for accurate hydrodynamic size and particle concentration measurements. |
| Filtration/Sterilization Units | 0.1 µm or 0.22 µm syringe filters (PES or PVDF membrane) | Removes dust, aggregates, and microbial contamination from buffers and solutions, eliminating spurious DLS signals. |
| Dialysis Cassettes/Ultrafiltration Units | Slide-A-Lyzer cassettes (MWCO 3.5-20 kDa), Amicon Ultra centrifugal filters (MWCO 10-100 kDa) | Purifies nanoparticle dispersions, exchanges buffers, and removes excess/unbound ligands or stabilizers. |
| pH & Conductivity Meter with Micro-electrode | Instruments from Mettler Toledo, Thermo Scientific with appropriate micro-samples (e.g., 1-2 mL capacity) | Precisely characterizes the dispersion medium, as pH and conductivity are critical parameters for stability. |
Troubleshooting Guides & FAQs
FAQ 1: Why Are My Nanoparticles Aggregating Upon Buffer Exchange?
Q: I synthesized citrate-stabilized gold nanoparticles (AuNPs). After dialysis into a 10 mM phosphate buffer at pH 7.4 for biological assays, significant aggregation occurred. What went wrong?
A: The most likely cause is a drastic reduction in ionic strength. Citrate stabilization relies on electrostatic repulsion. The citrate layer provides a negative charge, creating a repulsive force between particles. Dialyzing into a low-ionic-strength buffer (10 mM phosphate) compresses the electrical double layer, reducing this repulsive force and allowing van der Waals attractions to dominate, causing aggregation.
Solution:
- Measure the ionic strength of your original citrate suspension (often ~1-2 mM sodium citrate) and your target buffer.
- Use a buffer with a matching or higher ionic strength. For 20 nm AuNPs, aim for at least 20-50 mM ionic strength in the final buffer. You can adjust this by adding salts like NaCl.
- Perform a graded dialysis/buffer exchange: Transition through intermediate buffers with gradually changing ionic strength and pH to avoid shocking the nanoparticles.
FAQ 2: How Does Buffer pH Affect the Zeta Potential and Stability of My Lipid Nanoparticles (LNPs)?
Q: My siRNA-loaded LNPs have a zeta potential of +15 mV in citrate buffer at pH 5.0 but aggregate when I adjust the pH to 7.4 for cell culture experiments. Why?
A: The surface charge of ionizable lipids in LNPs is highly pH-dependent. At pH 5.0 (below the lipid's pKa), the lipids are protonated and carry a positive charge, providing electrostatic stabilization and facilitating siRNA encapsulation. At pH 7.4 (above the pKa), the lipids become neutral, eliminating the electrostatic repulsion. The primary stabilization mechanism is lost, leading to aggregation or fusion.
Solution:
- Characterize the pKa of your ionizable lipid (e.g., using a TNS fluorescence assay).
- Formulate with a PEG-lipid conjugate to provide steric stabilization that is effective across a wider pH range.
- Consider using a buffer system that maintains a pH slightly below the lipid's pKa during storage, if possible, and understand that charge-neutral LNPs at physiological pH are normal but require steric stabilizers.
FAQ 3: Why Is Osmolarity Critical for In Vivo Nanoparticle Formulations?
Q: My polymeric nanoparticles are stable in vitro but aggregate rapidly when injected into mice. The formulation buffer is pure 10 mM HEPES, pH 7.4.
A: The issue is likely low osmolarity. Pure 10 mM HEPES has very low osmolarity (<50 mOsm/kg). Upon injection into the bloodstream (~290 mOsm/kg), water rapidly enters the nanoparticles due to the large osmotic gradient, causing swelling, membrane stress (for liposomes or nanocapsules), and ultimately aggregation or disintegration.
Solution:
- Always adjust the osmolarity of your final dispersion buffer to be isotonic with biological fluids (approx. 290 ± 20 mOsm/kg).
- Use sugars (e.g., sucrose, trehalose) or salts (e.g., NaCl) to adjust osmolarity. Sugars are often preferred for cryoprotection during lyophilization.
- Measure osmolarity using a freezing-point depression osmometer.
Table 1: Impact of Ionic Strength on Zeta Potential & Hydrodynamic Diameter of 50 nm Polystyrene Nanoparticles
| Buffer System | pH | Ionic Strength (mM) | Zeta Potential (mV) | Hydrodynamic Diameter (nm) | PDI | Observation (24h) |
|---|---|---|---|---|---|---|
| 1 mM KCl | 7.0 | 1 | -45.2 ± 2.1 | 52 ± 3 | 0.05 | Stable, no aggregation |
| 10 mM PBS | 7.4 | ~150 | -12.5 ± 1.8 | 55 ± 4 | 0.08 | Stable, slight aggregation |
| 50 mM PBS | 7.4 | ~300 | -5.1 ± 1.2 | 1200 ± 150 | 0.35 | Rapid aggregation |
Table 2: Effect of pH on Silica Nanoparticle (100 nm) Stability in Citrate Buffer
| pH | Zeta Potential (mV) | Isoelectric Point (IEP) Proximity | Aggregation Time (hr) |
|---|---|---|---|
| 3.0 | +25.1 ± 1.5 | Far from IEP (IEP ~2-3) | >48 |
| 4.0 | +5.3 ± 0.8 | Near IEP | <1 |
| 7.0 | -31.4 ± 2.0 | Far from IEP | >48 |
| 9.0 | -39.8 ± 2.3 | Far from IEP | >48 |
Table 3: Common Buffer Osmolarity Ranges
| Buffer Component (at 25°C) | Common Conc. | Approx. Osmolarity (mOsm/kg) | Notes for Nanoparticle Use |
|---|---|---|---|
| Pure Water | - | 0 | Causes lysis/swelling; never use. |
| 10 mM HEPES | 10 mM | ~10 | Highly hypotonic. |
| 1x PBS (Phosphate Buffered Saline) | - | ~290 | Isotonic standard. |
| 5% (w/v) Sucrose | ~146 mM | ~150 | Hypotonic; common cryoprotectant. |
| 10% (w/v) Sucrose | ~292 mM | ~300 | Near isotonic; excellent cryoprotectant. |
| 150 mM NaCl | 150 mM | ~300 | Isotonic; may affect ionic strength. |
Detailed Experimental Protocols
Protocol 1: Systematic Evaluation of Ionic Strength on Nanoparticle Stability
Objective: To determine the critical coagulation concentration (CCC) for an electrostatically stabilized nanoparticle formulation.
Materials: See "The Scientist's Toolkit" below. Method:
- Prepare a concentrated stock dispersion of your nanoparticles (e.g., 5 mg/mL AuNPs).
- Prepare a series of 2 mL buffer solutions (e.g., 10 mM Tris-HCl, pH 8.5) with increasing concentrations of salt (NaCl). Typical range: 1 mM, 10 mM, 50 mM, 100 mM, 200 mM, 500 mM.
- Add 20 µL of the concentrated nanoparticle stock to each buffer vial. Mix gently by inversion.
- Immediately measure the hydrodynamic diameter (Dh) and polydispersity index (PDI) of each sample via DLS at time = 0.
- Incubate the vials at the desired temperature (e.g., 25°C).
- Measure Dh and PDI at regular intervals (e.g., 1h, 4h, 24h).
- Plot Dh vs. ionic strength (or [NaCl]) for each time point. The CCC is identified as the ionic strength at which a sharp, sustained increase in Dh is observed.
Protocol 2: pH Titration for Zeta Potential and IEP Determination
Objective: To characterize the surface charge of nanoparticles as a function of pH and identify the isoelectric point (IEP).
Materials: See "The Scientist's Toolkit" below. Method:
- Prepare a 20 mL dispersion of nanoparticles in a low-ionic-strength background electrolyte (e.g., 1 mM KCl). This minimizes interference with the pH measurement and zeta potential.
- Place the dispersion in a beaker with a magnetic stirrer.
- Using a pH meter, record the starting pH.
- Measure the initial zeta potential (using M3-PALS technology) in the dedicated cell.
- Titrate the dispersion by adding small aliquots (e.g., 10-50 µL) of a strong base (0.1 M KOH) or acid (0.1 M HCl).
- After each addition, allow the pH to stabilize, record the new pH, and measure the zeta potential.
- Continue across a wide pH range (e.g., pH 3 to 11).
- Plot zeta potential vs. pH. The IEP is the pH where the zeta potential curve crosses zero.
Visualizations
Diagram 1: DLVO Theory & Buffer Impact on Nanoparticle Stability
Diagram 2: Experimental Workflow for Buffer Optimization
The Scientist's Toolkit: Research Reagent Solutions
Table 4: Essential Materials for Buffer Stability Studies
| Item | Function & Rationale |
|---|---|
| Zetasizer Nano ZSP (or equivalent) | Measures hydrodynamic diameter (DLS), polydispersity index (PDI), and zeta potential via M3-PALS. The core instrument for stability quantification. |
| pH Meter (with micro-electrode) | Accurately measures and monitors pH during titrations and buffer preparation. Critical for reproducible results. |
| Osmometer (Freezing Point Depression) | Precisely measures the osmolarity of final buffer solutions to ensure they are isotonic for biological applications. |
| Dialysis Cassettes/Tubing (MWCO appropriate) | Allows for controlled buffer exchange against a target buffer, minimizing shear stress compared to repeated centrifugation. |
| Ultrapure Water System (18.2 MΩ·cm) | Provides reagent-grade water free of ions and organics that could interfere with nanoparticle surface chemistry or measurements. |
| Laboratory Grade Salts (NaCl, KCl) | Used to precisely adjust the ionic strength of buffer systems without affecting pH. |
| Biologically Relevant Buffers (PBS, HEPES, Tris, Citrate) | Provide buffering capacity at specific pH ranges relevant to experimental conditions (e.g., lysosomal pH ~5.0, physiological pH ~7.4). |
| Osmolytes (Sucrose, Trehalose) | Used to adjust osmolarity to isotonic levels. Also act as cryoprotectants during lyophilization of nanoparticle formulations. |
| Standard Nanoparticles (e.g., NIST-traceable PS beads) | Used to calibrate and validate the performance of the DLS/Zetasizer instrument before measuring experimental samples. |
Technical Support Center
Troubleshooting Guide: Common Nanoparticle Dispersion Issues
Issue 1: Immediate Aggregation Upon Buffer Addition
- Potential Cause: Ligand-Buffer Charge Incompatibility. Positively charged ligands (e.g., PEI, ammonium) will aggregate in high-ionic-strength or anionic buffers (e.g., PBS, Tris-Cl at certain pHs).
- Solution: Switch to a low-ionic-strength buffer (e.g., 1-5 mM HEPES, MOPS) or use a buffer whose charge complements your ligand. Verify buffer pH relative to ligand pKa.
Issue 2: Gradual Aggregation or Sedimentation Over Time
- Potential Cause: Dynamic Desorption of Weakly Bound Ligands. Ligands like citrate can desorb in biologically relevant media, exposing the bare nanoparticle surface.
- Solution: Use covalently bound ligands (e.g., PEG-silane for oxides, alkane thiols for gold). Perform a ligand exchange protocol before buffer introduction.
Issue 3: Inconsistent Experimental Results Between Batches
- Potential Cause: Inadequate Purification. Residual synthesis chemicals (e.g., sodium borohydride, CTAB) interfere with buffer chemistry.
- Solution: Implement a rigorous, standardized purification protocol (see Table 2). Use dialysis for large particles (>5 nm) and centrifugal filtration for smaller ones.
Issue 4: Nanoparticles Aggregate at a Specific pH
- Potential Cause: pH is at or near the Isoelectric Point (IEP) of the coated nanoparticle.
- Solution: Characterize the IEP of your functionalized nanoparticles via zeta potential titration. Select a buffer with a pH at least 1.5-2 units above or below the IEP.
Frequently Asked Questions (FAQs)
Q1: My citrate-capped gold nanoparticles are stable in water but aggregate in any buffer I try. What is wrong? A: Citrate provides electrostatic stabilization which is highly sensitive to ionic strength. Most standard buffers (PBS, Tris) have too high a salt concentration, screening the repulsive charges. Use ultrapure water or a very low ionic strength buffer (< 2 mM) and consider transitioning to a steric stabilizer like PEG-thiol for buffer compatibility.
Q2: How do I choose a buffer for PEGylated (stealth) nanoparticles? A: PEG provides steric stabilization, making it less sensitive to ionic strength but sensitive to pH and specific ions. Avoid phosphate buffers with certain metal oxide cores (e.g., iron oxide) as phosphate can bind the surface. HEPES or MOPS buffers at physiological pH are generally safe choices. Always check for chemical compatibility with your core material.
Q3: What is the best method to transfer nanoparticles from one buffer to another? A: The gold standard is tangential flow filtration (TFF) for large volumes (>10 mL) or iterative centrifugal filtration (using 30kDa-100kDa MWCO filters) for smaller volumes. Simple dialysis is effective but slower. Never directly precipitate and resuspend in a new buffer, as this will cause irreversible aggregation.
Q4: My zwitterionic ligand-coated nanoparticles are unstable. Isn't zwitterionic meant to be stable? A: Zwitterionic ligands (e.g., carboxybetaine) are excellent stabilizers at their design pH. Their net charge is pH-dependent. If your buffer pH is far from the ligand's pI, it can develop a net charge that may lead to attraction or repulsion issues. Characterize the stability as a function of pH.
Table 1: Common Ligand/Coatings and Their Buffer Compatibility Profile
| Ligand/Coating Type | Stabilization Mechanism | Compatible Buffer Characteristics | Incompatible Buffer Characteristics | Typical IEP Range |
|---|---|---|---|---|
| Citrate | Electrostatic | Very Low Ionic Strength (<2 mM), Deionized Water | High Ionic Strength (PBS, Saline), Divalent Cations (Ca2+) | 2.5 - 4.0 |
| Polyethylene Glycol (PEG) | Steric | Wide range of ionic strength, pH 4-10 | Strong Oxidizers, High conc. Urea | ~ Neutral |
| Polyelectrolyte (e.g., PAA) | Electrosteric | pH > pKa of polymer (for anionic), Ionic Strength < 0.1 M | pH < pKa (for anionic), Very High Ionic Strength | Varies with pH |
| Zwitterionic (e.g., CB) | Hydration / Mixed | Physiological Ionic Strength, pH near ligand pI | Extreme pH values far from pI | ~7-8 (for CB) |
| Amine-Terminated (e.g., PEI) | Electrostatic / Cationic | Low Ionic Strength, Acidic pH (pH < 7) | High Ionic Strength, Phosphate Buffers (ppt. formation) | 9.0 - 11.0 |
Table 2: Purification Method Efficacy for Buffer Exchange
| Method | Principle | Optimal Nanoparticle Size | Typical Ligand Loss? | Buffer Exchange Efficiency | Time Required |
|---|---|---|---|---|---|
| Dialysis | Diffusion across membrane | >5 nm | Low | High (Slow) | 12 - 48 hrs |
| Centrifugal Filtration | Size-exclusion via spin | 2 nm - 100 nm | Medium-High | Very High | 30 - 90 min |
| Tangential Flow Filtration | Continuous flow filtration | All sizes, >100 mL vols | Low | Very High | 1 - 3 hrs |
| Precipitation/Resuspension | Solubility switching | >10 nm (Polymer coated) | Very High | High | Fast (Risky) |
Experimental Protocols
Protocol 1: Assessing Buffer Compatibility via Dynamic Light Scattering (DLS)
- Purify: Purify 1 mL of your nanoparticle stock solution 3x via centrifugal filtration (appropriate MWCO) into ultrapure water.
- Dilute: Dilute the purified nanoparticles 1:10 in the target buffer (e.g., PBS, HEPES, MOPS, Citrate Buffer) and in a water control.
- Equilibrate: Allow the mixtures to stand for 15 minutes at room temperature.
- Measure: Perform DLS triplicate measurements for each sample (buffer and control).
- Analyze: Compare the Z-Average Diameter and Polydispersity Index (PdI) between the buffer sample and the water control. An increase in size >10% and/or a PdI >0.25 indicates instability/aggregation. Monitor over 24 hours for time-dependent effects.
Protocol 2: Ligand Exchange for Gold Nanoparticles (to mPEG-Thiol)
- Materials: Citrate-capped AuNPs, methoxy-PEG-thiol (5 kDa), 10 kDa MWCO centrifugal filter.
- Mix: Add a 1000-fold molar excess of mPEG-thiol (relative to surface Au atoms) to the AuNP solution. Vortex gently.
- React: Allow the reaction to proceed for 24 hours at room temperature with gentle shaking.
- Purify: Purify the mixture via 3 cycles of centrifugal filtration (10kDa MWCO) against ultrapure water to remove free citrate and unreacted PEG-thiol.
- Characterize: Confirm exchange via a change in surface charge (zeta potential shift towards neutral) and stability test in 1X PBS using Protocol 1.
Diagrams
Decision Tree for Buffer Selection Based on Ligand Type
Workflow for Testing Nanoparticle Stability in Buffer
The Scientist's Toolkit: Research Reagent Solutions
| Item | Function & Rationale |
|---|---|
| HEPES Buffer (1M stock, pH 7.0-7.4) | A zwitterionic, biological buffer with low metal binding capacity. Excellent for maintaining pH in cell culture media and for sensitive nanoparticles where phosphate or Tris may interfere. |
| Zeta Potential Cell & Disposable Folded Capillaries | For measuring the surface charge (zeta potential) of nanoparticles in different buffers. Critical for identifying the IEP and predicting colloidal stability. |
| Centrifugal Filters (e.g., 30kDa, 50kDa, 100kDa MWCO) | Essential for rapid purification, buffer exchange, and concentration of nanoparticle dispersions without inducing aggregation. |
| mPEG-Thiol (Various MW: 2k, 5k, 10k Da) | A versatile ligand for gold, silver, and other metal nanoparticles. Provides steric stabilization (stealth properties) and improves buffer/biocompatibility. |
| Dynamic Light Scattering (DLS) Instrument | The primary tool for measuring hydrodynamic diameter and size distribution (PdI). The first-line assay for detecting aggregation in buffer. |
| Phosphate Buffered Saline (PBS, 10X) | A standard high-ionic-strength buffer (≈150 mM). Often used as a challenge buffer to test the robustness of steric stabilizers like PEG. Can cause aggregation for electrostatically stabilized NPs. |
This technical support center provides troubleshooting guides and FAQs for researchers studying nanoparticle dispersion stability, a critical factor in fields like drug delivery and diagnostics. The guidance is framed within the essential thesis that selecting the appropriate buffer is fundamental to mitigating destabilization phenomena.
Troubleshooting Guides & FAQs
Q1: During my experiment, my nanoparticle suspension rapidly turned cloudy and a visible pellet formed at the bottom of the vial. What is this, and how can I prevent it? A: This is classic aggregation and sedimentation. Nanoparticles have lost their colloidal stability, aggregated into larger clusters, and settled due to gravity. Prevention is rooted in buffer selection:
- Issue: Insufficient electrostatic or steric repulsion. Your buffer may have incorrect ionic strength (too high salts shield repulsive charges) or pH (moved nanoparticles to their isoelectric point).
- Solution: Optimize your dispersion buffer. Use a low ionic strength buffer (e.g., 1-10 mM citrate, phosphate) to maintain electrostatic stability. For steric stabilization, ensure your buffer is compatible with surface polymers (e.g., PEG, polysorbates). Verify the pH is far from the nanoparticle's isoelectric point (pI).
Q2: My dispersion was stable for weeks, but I've noticed a gradual shift in the optical properties and an increase in polydispersity over time, without immediate sedimentation. What's happening? A: This likely indicates Ostwald Ripening, where larger particles grow at the expense of smaller ones due to solubility differences.
- Issue: Smaller nanoparticles have higher solubility. Dissolved material diffuses through the continuous phase and re-deposits onto larger particles. This is common in systems with finite solubility (e.g., metallic, semiconductor, or some organic nanoparticles).
- Solution: Buffer composition can influence ripening kinetics. Ensure your buffer does not contain components that increase the solubility of the nanoparticle core material. Adding stabilizers that form a protective, low-solubility shell can also inhibit this process.
Q3: How can I quickly diagnose which failure mode I am observing in my lab? A: Use this combined diagnostic workflow:
Diagnostic Workflow for Nanoparticle Instability
Q4: What are the critical buffer parameters to test when optimizing for long-term stability against these failure modes? A: Systematically vary these parameters in your chosen buffer system and monitor size (by DLS) and zeta potential over time.
| Parameter | Target for Electrostatic Stability | Target for Steric Stability | Risk if Not Optimized |
|---|---|---|---|
| pH | ±2 pH units from nanoparticle pI | Compatible with polymer conformation | Aggregation at pI |
| Ionic Strength | Low (<20 mM) | Adjust for biocompatibility | Charge shielding → Aggregation |
| Stabilizer Concentration (e.g., citrate, SDS) | Sufficient to coat surface | Not applicable | Bridging flocculation or desorption |
| Polymer Type/Coating (e.g., PEG, PVP) | Not applicable | Complete, dense coverage | Ineffective steric hindrance |
| Chelating Agents (e.g., EDTA) | Include if ions cause bridging | Include if ions cause bridging | Salt-induced aggregation |
Key Experimental Protocol: Evaluating Buffer Impact on Stability
Objective: To systematically assess the effect of buffer pH and ionic strength on the short-term and long-term stability of charged nanoparticles.
Materials (The Scientist's Toolkit):
| Reagent/Material | Function in Experiment |
|---|---|
| Nanoparticle Stock Dispersion | The test system for stability assessment. |
| Buffer Salts (e.g., Citrate, Phosphate, Tris) | Provides the ionic environment and pH control. |
| Salt Solutions (e.g., NaCl, KCl) | Used to precisely adjust ionic strength. |
| pH Meter | For accurate verification of buffer pH. |
| Dynamic Light Scattering (DLS) / Zeta Potential Analyzer | Measures hydrodynamic diameter (PdI) and surface charge. |
| UV-Vis Spectrophotometer | Monitors optical density shifts indicative of aggregation/ripening. |
| Centrifuge | For accelerated stability testing (stress test). |
Methodology:
- Buffer Preparation: Prepare a series of 10 mM citrate buffers across a pH range (e.g., 3.0, 4.5, 6.0). Prepare a second series at a fixed pH (e.g., 6.0) with varying NaCl concentrations (0, 10, 50, 150 mM).
- Sample Preparation: Dilute a fixed volume of nanoparticle stock into each buffer formulation. Filter all buffers through a 0.22 µm membrane prior to use.
- Time Zero (t₀) Characterization: For each sample, measure the hydrodynamic diameter (Z-average), polydispersity index (PdI), and zeta potential.
- Stability Monitoring:
- Real-Time: Store samples at relevant temperature (e.g., 4°C, 25°C). Measure size and zeta potential at set intervals (1h, 24h, 1 week, 1 month).
- Accelerated/Stress Test: Centrifuge aliquots at a low, defined speed (e.g., 3000 rpm for 10 min). Measure the supernatant's UV-Vis absorbance or DLS size before and after to quantify settling.
- Data Analysis: Plot size and zeta potential vs. time for each buffer condition. The optimal buffer maintains size and zeta potential closest to t₀ values over the longest period.
Protocol: Buffer Optimization for Nanoparticle Stability
A Step-by-Step Protocol: Screening and Formulating Buffers for Your Nanoparticles
Troubleshooting Guides & FAQs
Q1: My nanoparticles aggregate immediately upon dispersion in the selected buffer during in vitro characterization. What are the primary causes and solutions?
A: Immediate aggregation often indicates a buffer-nanoparticle mismatch. Key troubleshooting steps:
- Check Ionic Strength: High ionic strength buffers can screen surface charges, collapsing the electrostatic double layer. Use low ionic strength buffers (e.g., 1-10 mM) or substitute salts with non-ionic osmolytes like sucrose.
- Verify pH Relative to pI: Ensure the buffer pH is far from the nanoparticle's isoelectric point (pI). Operate at a pH where the particle surface charge (zeta potential) is high (> |±30| mV for electrostatically stabilized particles).
- Assess Component Incompatibility: Certain buffer components (e.g., citrate, phosphate) can specifically bind to or bridge nanoparticle surfaces. Switch to a chemically inert buffer like HEPES or Tris and introduce steric stabilizers (e.g., 0.1% w/v polysorbate 80).
Q2: Nanoparticles are stable in simple saline buffer but rapidly precipitate in biologically relevant media (e.g., cell culture medium, simulated body fluid). Why?
A: This is a classic "bio-mimicking media instability" issue. The primary culprit is protein adsorption (opsonization) and interaction with multivalent ions.
- Cause: Serum proteins can bridge particles, and divalent cations (Mg²⁺, Ca²⁺) can neutralize anionic surface charges.
- Solution: Implement a "stealth" stabilization strategy. Modify your buffer to include:
- PEGylated lipids or polymers (e.g., DSPE-PEG) in the formulation itself.
- Supplementation of the dispersion buffer with a protein-repelling agent like poloxamer 188 (0.1-1%).
- Protocol: Perform a stability screening: Disperse nanoparticles in PBS, PBS + 10% FBS, and cell culture medium. Monitor hydrodynamic diameter (by DLS) and PDI over 24 hours at 37°C. Stable formulations will show <10% size change and PDI <0.2 in serum-containing media.
Q3: How do I translate buffer selection from in vitro stability to successful in vivo administration (e.g., IV injection)?
A: In vivo administration introduces critical new criteria. Your buffer must ensure stability and biocompatibility.
- Osmolality & pH: The buffer must be isotonic (≈290 mOsm/kg) and physiological pH (7.2-7.4) to prevent hemolysis and tissue irritation. Use sucrose or glycerol to adjust osmolality.
- Sterility & Pyrogen-Free: Buffers must be filter-sterilized (0.22 µm) and prepared with endotoxin-free water.
- Chelating Agents: For metal-based nanoparticles, include a low concentration of EDTA (e.g., 0.01 mM) to chelate free ions, but ensure it does not destabilize the core.
- Protocol for In Vivo Readiness Test:
- Prepare nanoparticle in candidate buffer (e.g., 10 mM HEPES, 5% sucrose, pH 7.4, 290 mOsm/kg).
- Filter through a 0.22 µm sterile filter.
- Perform a Limulus Amebocyte Lysate (LAL) assay to confirm endotoxin levels <0.25 EU/mL.
- Conduct a short-term (4-hour) stability test at 37°C post-filtration using DLS.
Q4: What are the key quantitative metrics to track when selecting a buffer across the development pipeline?
A: The following parameters should be systematically measured and compared.
Table 1: Key Quantitative Metrics for Buffer Selection
| Development Stage | Key Metric | Target Range (Typical) | Measurement Technique | ||
|---|---|---|---|---|---|
| In Vitro (Physicochemical) | Hydrodynamic Diameter (Dh) | Variation < ±10% from baseline | Dynamic Light Scattering (DLS) | ||
| Polydispersity Index (PDI) | < 0.2 | Dynamic Light Scattering (DLS) | |||
| Zeta Potential (ζ) | > | ±30 | mV (electrostatic) | Electrophoretic Light Scattering | |
| Osmolality | 280-310 mOsm/kg | Osmometer | |||
| In Vitro (Biological) | Size Change in 10% Serum | Dh increase < 20% over 24h | DLS | ||
| Cell Viability (Buffer Control) | > 90% vs. untreated | MTT/WST-1 Assay | |||
| In Vivo (Pre-Clinical) | Endotoxin Level | < 0.25 EU/mL | LAL Assay | ||
| Aggregate Formation | No visible particles > 1µm | Visual Inspection / Microflow Imaging |
Experimental Protocols
Protocol 1: High-Throughput Buffer Screening for Nanoparticle Stability Objective: Systematically evaluate nanoparticle stability across a matrix of buffer conditions. Materials: Nanoparticle stock, 96-well plate (UV-transparent), buffer reagents (salts, surfactants, pH modifiers), plate reader with DLS capability (or standalone DLS). Method:
- Prepare 200 µL of nanoparticle dispersion in each buffer condition in a 96-well plate. Vary: pH (5.0, 7.4, 9.0), ionic strength (1, 10, 150 mM NaCl), and stabilizer (none, 0.01% polysorbate 80, 0.1% PEG 8000).
- Seal plate and incubate at 25°C and 37°C.
- Measure hydrodynamic diameter and PDI at T=0, 1h, 4h, 24h using a plate-based DLS reader.
- Data Analysis: Calculate the percentage change in diameter over time. The optimal buffer is the one that maintains the smallest, most monodisperse population (lowest PDI) across time and temperature.
Protocol 2: Assessing Buffer Compatibility for In Vivo Administration Objective: Ensure formulated nanoparticle buffer meets prerequisites for animal studies. Materials: Filtered nanoparticle formulation, osmometer, pH meter, LAL assay kit, sterile water. Method:
- Sterility: Aseptically prepare buffer using endotoxin-free water and components. Filter nanoparticle dispersion through a 0.22 µm PVDF syringe filter into a sterile vial.
- Osmolality & pH: Calibrate instruments. Measure the osmolality and pH of the filtered nanoparticle suspension directly. Adjust if necessary (note: post-adjustment requires re-filtering).
- Endotoxin Testing: Follow the kinetic turbidimetric or chromogenic LAL assay kit instructions using the filtered nanoparticle sample. Run a standard curve in parallel.
- Acceptance Criteria: Pass if osmolality = 280-310 mOsm/kg, pH = 7.2-7.4, and endotoxin concentration < 0.25 EU/mL.
Diagrams
Title: Nanoparticle Buffer Selection Decision Pathway
Title: Workflow for Translating Buffer from In Vitro to In Vivo
The Scientist's Toolkit: Research Reagent Solutions
Table 2: Essential Materials for Nanoparticle Dispersion Stability Research
| Reagent / Material | Function in Buffer Selection | Key Consideration |
|---|---|---|
| HEPES Buffer (4-(2-hydroxyethyl)-1-piperazineethanesulfonic acid) | Provides stable pH (7.2-7.8) in biological research, non-coordinating with metal ions. | Preferred over phosphate for metal nanoparticles to avoid precipitation. |
| Polysorbate 80 (Tween 80) | Non-ionic surfactant used to provide steric stabilization and prevent protein adsorption. | Critical for preventing aggregation in serum; optimal concentration is formulation-dependent (0.001-0.1%). |
| DSPE-PEG(2000) (1,2-distearoyl-sn-glycero-3-phosphoethanolamine-N-[methoxy(polyethylene glycol)-2000]) | PEGylated lipid integrated into nanoparticle formulation for "stealth" properties and long-circulation in vivo. | The gold standard for in vivo stability; PEG chain length (2000-5000 Da) affects performance. |
| Sucrose / Trehalose | Non-ionic osmolytes used to adjust solution osmolality to isotonic levels without increasing ionic strength. | Protects against aggregation during freeze-thaw and maintains particle integrity better than salts. |
| EDTA (Ethylenediaminetetraacetic acid) (0.01-0.1 mM) | Chelating agent that binds divalent cations (Ca²⁺, Mg²⁺), preventing ion-bridging aggregation. | Use at minimal effective concentration to avoid destabilizing nanoparticle core or altering biology. |
| Sterile, Endotoxin-Free Water | Solvent for all buffers intended for in vitro biological assays or in vivo use. | Essential for eliminating confounding inflammatory responses; never use standard deionized water. |
| 0.22 µm PVDF Syringe Filter | For sterilizing nanoparticle dispersions prior to in vitro cell assays or in vivo administration. | PVDF is low-protein binding and compatible with most organic solvents and aqueous solutions. |
Technical Support Center: Troubleshooting & FAQs for Nanoparticle Dispersion Buffer Screening
Frequently Asked Questions (FAQs)
Q1: My nanoparticles are aggregating immediately upon addition to the screened buffer. What are the primary causes? A1: Immediate aggregation typically indicates a critical mismatch between buffer properties and nanoparticle surface chemistry. Primary causes include:
- Ionic Strength: The buffer's ionic strength is too high, compressing the electrical double layer and reducing electrostatic repulsion (Derjaguin-Landau-Verwey-Overbeek / DLVO theory).
- pH: The pH is at or near the isoelectric point (pI) of the nanoparticle, resulting in a net neutral surface charge and loss of electrostatic stabilization.
- Missing Stabilizer: The formulation lacks a necessary steric stabilizer (e.g., polysorbate, PEG) for your specific nanomaterial.
Q2: In high-throughput screening (HTS), my zeta potential readings are inconsistent across the plate. How can I improve reliability? A2: Inconsistent readings in HTS often stem from experimental artifacts.
- Check Electrode Positioning: Ensure consistent immersion depth and alignment of the plate reader's electrodes for each well.
- Control Temperature: Use a temperature-controlled plate holder. Zeta potential is temperature-sensitive.
- Homogenize Samples: Prior to measurement, gently mix each well with a pipette to ensure uniformity, avoiding bubble formation.
- Validate with Standards: Include wells with standardized zeta potential markers (e.g., -50mV ± 5mV) on each plate to calibrate and identify plate-edge effects.
Q3: How do I choose between a high-throughput screening (HTS) approach and a rational design approach for my project? A3: The choice depends on project stage, resources, and prior knowledge. See the decision table below.
Q4: My rational design is based on published literature, but the buffer isn't stabilizing my nanoparticles. What did I miss? A4: Nanoparticle synthesis batches and surface modifications vary. Published buffers are starting points. You likely need to adjust:
- pH Fine-Tuning: Systematically test pH in 0.2-0.5 unit increments around the literature value.
- Excipient Titration: The concentration of key excipients (e.g., surfactant, sucrose) may need optimization for your specific surface curvature and composition.
Troubleshooting Guides
Issue: Poor Correlation Between HTS Stability Predictions and Long-Term Storage Results Symptoms: Buffers identified as "stable" in a 24-48 hour HTS assay show aggregation or precipitation after 2-4 weeks of storage. Solution:
- Incorporate Stress Tests: Add stress conditions to your HTS workflow (e.g., 1-3 freeze-thaw cycles, brief incubation at 40°C).
- Extend Assay Metrics: Beyond immediate DLS size and zeta, include a long-term kinetic readout. Use plate readers to monitor turbidity (OD at 340-600 nm) over 7 days.
- Validate with Orthogonal Methods: Confirm HTS "hits" with isothermal titration calorimetry (ITC) to measure binding affinities or with analytical ultracentrifugation (AUC) for direct sedimentation analysis.
Issue: Rational Design is Stalled Due to Incomplete Surface Characterization Symptoms: Unable to define a starting pH or ionic strength range because the nanoparticle's surface charge groups or pI are unknown. Solution:
- Perform a pH-Zeta Sweep: Dilute nanoparticles in low-ionic-strength solutions (e.g., 1 mM NaCl). Titrate pH across a broad range (3-10) using dilute HCl/NaOH. Measure zeta to identify the pI (where zeta=0).
- Use Probe Molecules: Employ charge-sensitive molecular probes (e.g., fluorescent or NMR-based) that interact with surface groups to infer chemistry.
- Start with Broad HTS: Use a limited, knowledge-informed HTS (e.g., 3 pH values x 5 key excipients) to gather initial data and guide deeper rational investigation.
Data Presentation: Comparison of Screening Approaches
Table 1: High-Throughput Screening vs. Rational Design Workflow Comparison
| Parameter | High-Throughput Screening (HTS) Approach | Rational Design Approach |
|---|---|---|
| Primary Goal | Empirically identify hits from a vast combinatorial space. | Understand mechanisms to design a specific, optimized buffer. |
| Throughput | Very High (96-, 384-well plates). Can test 100s-1000s of conditions. | Low to Medium. Tests 10s of conditions based on hypotheses. |
| Sample Volume | Low (50-200 µL per condition). | Typically higher (0.5-2 mL per condition). |
| Key Inputs | Library of buffers, excipients, pH values. Minimal prior knowledge required. | Deep knowledge of nanoparticle surface properties (pI, hydrophobicity, specific ligands). |
| Typical Outputs | Rank-ordered list of promising buffer formulations. | A mechanistic understanding of stabilization (electrostatic, steric, electrosteric). |
| Best For | Early discovery, novel nanomaterials, or when surface chemistry is poorly defined. | Late-stage optimization, QC, regulatory filing, or when a stabilization mechanism is targeted. |
| Common Techniques | Microplate DLS, turbidity assays, fluorescence quenching. | Titration experiments (pH, conductivity), ITC, surface plasmon resonance (SPR). |
Table 2: Key Stability Metrics & Target Ranges for Nanoparticle Dispersions
| Metric | Instrument/Method | Target Range for Stability* | Rationale | |||
|---|---|---|---|---|---|---|
| Hydrodynamic Diameter (Dh) | Dynamic Light Scattering (DLS) | Change < 10% from initial, PDI < 0.2 | Indicates absence of aggregation or swelling. | |||
| Zeta Potential (ζ) | Electrophoretic Light Scattering | > | ±30 | mV (electrostatic) | High electrostatic repulsion. | |
| > | ±20 | mV (steric-electrosteric) | Sufficient for systems with polymer coatings. | |||
| Turbidity / Absorbance | UV-Vis Plate Reader (340-600 nm) | Stable or minimal increase over time. | Direct indicator of macroscopic aggregation. | |||
| Polydispersity Index (PDI) | DLS (Cumulants analysis) | < 0.2 (Monodisperse) < 0.7 (Broad but stable) | Measures heterogeneity in size distribution. |
*Targets are general guidelines; optimal ranges are material-dependent.
Experimental Protocols
Protocol 1: High-Throughput Buffer Screening in a 96-Well Plate Objective: To rapidly assess the colloidal stability of a nanoparticle formulation across 96 different buffer conditions. Materials: See "The Scientist's Toolkit" below. Procedure:
- Plate Layout: Design plate map. Include columns for:
- Test buffers (varying pH, salt type/concentration, excipients).
- Positive control (known stable buffer for nanoparticle).
- Negative control (deionized water or known aggregating condition).
- Buffer blanks (for background subtraction in turbidity).
- Buffer Dispensing: Using a multichannel pipette or liquid handler, dispense 180 µL of each buffer into assigned wells.
- Nanoparticle Addition: Homogenize the stock nanoparticle suspension. Add 20 µL to each well containing buffer. Mix thoroughly by pipetting up/down 5-10 times.
- Incubation: Seal plate with a non-permeable film. Incubate at the target temperature (e.g., 25°C) for the desired time (e.g., 1h, 24h).
- Measurement:
- Turbidity: Read absorbance at 400 nm (or other suitable wavelength).
- DLS/Zeta: Using a microplate-enabled instrument, measure the hydrodynamic diameter and zeta potential for each well.
- Analysis: Normalize turbidity to controls. Rank conditions by minimal size change, PDI, and absolute zeta potential.
Protocol 2: Rational pH-Zeta Potential Titration Objective: To determine the isoelectric point (pI) of nanoparticles and map zeta potential as a function of pH. Materials: Nanoparticle sample, 1 mM NaCl or KCl solution, 0.1 M HCl, 0.1 M NaOH, zeta potential cell, pH meter. Procedure:
- Sample Preparation: Dialyze or dilute nanoparticles extensively into a low-ionic-strength solution (1 mM NaCl) to minimize the confounding effect of salt on the double layer.
- Aliquot: Prepare 12 aliquots of 1 mL each of the nanoparticle suspension in small vials.
- pH Adjustment: Using dilute HCl or NaOH, adjust the pH of each vial across a wide range (e.g., from 3.0 to 10.0 in ~0.7 unit increments). Measure and record the exact pH of each vial.
- Zeta Measurement: Immediately after pH adjustment, measure the zeta potential of each sample. Ensure temperature equilibrium.
- Data Plotting & pI Determination: Plot zeta potential (y-axis) versus pH (x-axis). Fit a curve through the data points. The pH at which the zeta potential equals zero is the apparent isoelectric point (pI).
Mandatory Visualization
Diagram Title: Decision Workflow for Choosing Buffer Screening Strategy
Diagram Title: High-Throughput Screening Experimental Workflow
The Scientist's Toolkit: Research Reagent Solutions
Table 3: Essential Materials for Nanoparticle Buffer Screening Experiments
| Item | Function & Rationale |
|---|---|
| Polystyrene 96- or 384-Well Plates | The standard vessel for HTS. Opt for clear, flat-bottom plates for optical measurements (turbidity, DLS). Low-protein-binding plates may reduce surface adsorption. |
| Multichannel Pipette & Repeater Pipette | Enables rapid, consistent dispensing of buffers and nanoparticle suspensions across multiple wells, critical for reproducibility in HTS. |
| Microplate Sealing Film | Prevents evaporation and cross-contamination during incubation, which is crucial for reliable long-term kinetic studies. |
| Dynamic & Electrophoretic Light Scattering (DLS/ELS) Instrument | Core instrument for measuring hydrodynamic diameter (size), polydispersity (PDI), and zeta potential. Microplate-capable systems are ideal for HTS. |
| UV-Vis Microplate Reader | Measures turbidity (optical density) as a rapid, high-throughput indicator of aggregation and colloidal stability. |
| Buffers & Salts (e.g., PBS, Tris, Citrate, Histidine) | Provide the foundational pH control and ionic environment. A library of buffers at different pH values is essential. |
| Excipient Library (e.g., Polysorbate 80, Poloxamer 188, PEG, Sucrose, Trehalose) | Surfactants and stabilizers to test for steric hindrance and cryo-/lyo-protection. Sugars can stabilize via preferential exclusion. |
| Low-Binding Microcentrifuge Tubes & Pipette Tips | Minimizes loss of nanoparticles due to adsorption to plastic surfaces during sample preparation and handling. |
| pH Meter & Fine Adjustment Solutions (HCl/NaOH) | Critical for precise pH adjustment in rational design and for preparing buffer stocks for HTS libraries. |
| Dialysis Cassettes or Desalting Columns | For exchanging nanoparticles into different buffer systems without concentrating or diluting the sample, a key step in rational design. |
Within nanoparticle dispersion stability research, selecting and preparing the correct buffer is a foundational step. The buffer's ionic strength, pH, and purity directly influence colloidal stability, zeta potential, and nanoparticle aggregation kinetics. This technical support center provides troubleshooting and FAQs for preparing and characterizing buffer stocks, a critical pre-experimental phase in this field.
Troubleshooting Guides & FAQs
Q1: After preparation, my buffer pH is consistently 0.2-0.3 units off the theoretical value. What could be the cause? A: This is commonly due to temperature differences or incorrect water quality. Buffer pH is temperature-dependent. Ensure measurements are taken at your experimental temperature (e.g., 25°C). Use high-purity, deionized (DI) water (resistivity ≥18.2 MΩ·cm). Carbon dioxide absorption from air can acidify low-ionic-strength alkaline buffers; prepare these fresh and store under argon if necessary.
Q2: I observe high and variable conductivity in my phosphate-buffered saline (PBS), despite correct weighing. A: Contamination from previous solutions or glassware is likely. Thoroughly rinse all containers with DI water. Autoclaving can precipitate salts, altering ionic content; consider sterile filtration instead. Verify the purity of your salts. Finally, ensure your conductivity meter is calibrated with appropriate standards.
Q3: My filtered buffer is showing particulate matter after autoclaving or storage. A: Filtration and sterilization methods are incompatible. Autoclaving after filtration can introduce particles from container seals or precipitate salts. The correct workflow is: dissolve, pH, then sterilize via filtration through a 0.22 µm membrane directly into a sterile container. Store at 4°C to inhibit microbial growth.
Q4: How does buffer filtration impact nanoparticle stability studies? A: Critical. Unfiltered buffers contain dust and particulates that act as nucleation sites for nanoparticle aggregation, leading to skewed dynamic light scattering (DLS) and zeta potential results. Filtration (0.22 µm or 0.1 µm) removes these artifacts and ensures sterility, which is vital for long-term stability studies.
Q5: What are the key buffer characteristics to document for reproducibility in dispersion research? A: Maintain a detailed buffer preparation log. Essential characteristics are summarized in Table 1.
Table 1: Essential Buffer Characterization Data for Reproducibility
| Parameter | Target Value | Measured Value | Method/Instrument | Significance for Nanoparticle Stability |
|---|---|---|---|---|
| pH | e.g., 7.4 ± 0.05 | 7.42 | Calibrated pH meter | Determines surface charge & aggregation state. |
| Conductivity | e.g., 15.6 mS/cm | 15.8 mS/cm | Calibrated conductivity meter | Indicator of ionic strength, affects electrostatic screening. |
| Resistivity of Water Used | 18.2 MΩ·cm | 18.2 MΩ·cm | Ultrapure water system | Ensures no contaminants alter ionic content. |
| Osmolality | e.g., 290 mOsm/kg | 295 mOsm/kg | Osmometer | Critical for in vivo or cellular studies. |
| Filtration Method | 0.22 µm PES membrane | 0.22 µm PES syringe filter | N/A | Removes particulates that seed aggregation. |
Experimental Protocols
Protocol 1: Preparation of 1L 10x PBS Stock Solution (pH 7.4)
- Weigh: In a 1L beaker, add 800 mL of Type I (18.2 MΩ·cm) water.
- Dissolve: Add 80 g NaCl, 2.0 g KCl, 14.4 g Na₂HPO₄ (dibasic), and 2.4 g KH₂PO₄ (monobasic). Stir until fully dissolved.
- pH Adjustment: Measure pH. It is typically ~7.4. If adjustment is needed, use dilute HCl or NaOH.
- Final Volume: Add water to bring the total volume to 1 L.
- Sterilization & Storage: Filter through a 0.22 µm polyethersulfone (PES) membrane into a sterile bottle. Store at 4°C for up to 6 months. Dilute 1:10 with sterile water for 1x working solution.
Protocol 2: Characterization of Buffer Conductivity and pH
- Calibration: Calibrate pH and conductivity meters using fresh standards (pH 4.01, 7.00, 10.01; conductivity 1413 µS/cm and 100 µS/cm).
- Measurement: Allow buffer and meters to equilibrate to room temperature (25°C). Rinse electrodes with DI water and blot dry.
- Reading: Submerge electrodes in the buffer solution under gentle stirring. Record the stable pH and conductivity values.
- Documentation: Record temperature, values, and instrument IDs alongside the data (as in Table 1).
Workflow Diagram
Diagram 1: Buffer Stock Prep & Troubleshooting Workflow
The Scientist's Toolkit: Research Reagent Solutions
Table 2: Essential Materials for Buffer Preparation & Characterization
| Item | Function & Importance |
|---|---|
| High-Purity Salts (ACS Grade or higher) | Minimizes trace metal and organic contaminants that can destabilize nanoparticles or interfere with assays. |
| Type I Ultrapure Water System (18.2 MΩ·cm) | Eliminates ions and organics that alter buffer ionic strength, pH, and introduce nanoparticulate contaminants. |
| Calibrated pH Meter & Electrodes | Ensures accurate pH, the critical parameter for nanoparticle surface charge determination. |
| Calibrated Conductivity Meter | Directly measures ionic strength, which governs electrostatic interactions in colloidal stability. |
| 0.22 µm & 0.1 µm PES Syringe Filters | Removes particulates and sterilizes without introducing extractables (low protein binding). Vital for DLS. |
| Sterile, Particle-Free Containers (e.g., Schott Bottles) | Prevents microbial growth and contamination during storage, ensuring buffer consistency over time. |
| Osmometer | For buffers used in biological applications, confirming physiological osmolality to prevent osmotic stress. |
Troubleshooting Guides & FAQs
Q1: During buffer exchange via dialysis, my nanoparticle suspension becomes cloudy and precipitates. What is the cause and how can I prevent this? A: This is a classic sign of destabilization due to an osmotic shock or an incompatible buffer chemistry. The key is to match the chemical potential (osmolarity) and pH of the dialysate (new buffer) closely with the original suspension medium. A stepwise osmotic gradient can be critical. First, ensure the new buffer's ionic strength is within ±10% of the original. If moving to a vastly different buffer (e.g., from high salt to low salt), perform an intermediate dialysis step. Pre-wet the dialysis membrane with the original buffer to prevent adsorption. Monitor the pH of the external dialysate; change it frequently (e.g., every 1-2 hours for the first 6 hours) to maintain the gradient.
Q2: I observe significant particle loss (>50%) due to adhesion to the dialysis membrane. How do I mitigate this? A: Membrane adsorption is a major issue for nanoparticles, especially liposomes or polymeric particles with hydrophobic patches. Implement these strategies:
- Membrane Pre-treatment: Soak the membrane in a 1% (w/v) bovine serum albumin (BSA) or 0.1% (v/v) Tween 20 solution for 30 minutes, then rinse with your starting buffer. This creates a passivating layer.
- Buffer Additives: Include low concentrations of non-ionic surfactants (e.g., 0.01% Poloxamer 188) or sugars (0.5% trehalose) in both the sample and dialysate to compete for binding sites.
- Membrane Choice: Use low-protein-binding regenerated cellulose membranes instead of cellulose ester. For very small nanoparticles (<10 nm), consider tangential flow filtration as an alternative.
Q3: What is the optimal dialysis duration and dialysate volume ratio to ensure complete exchange while minimizing experiment time? A: Complete exchange is asymptotically approached; >99% exchange is typically targeted. The required time depends on the particle size (diffusion coefficient) and the sample volume-to-membrane surface area ratio. As a rule of thumb, for a 1 mL sample in a standard 10 kDa MWCO dialysis cassette, a dialysate volume of 1 L changed 3-4 times over 24-36 hours is sufficient for most nanoparticles (50-200 nm). Use the table below as a guideline. Confirm completion by measuring conductivity or pH of the dialysate; it should match fresh buffer after the final change.
Q4: My nanoparticles aggregate after dialysis into a supposedly stabilizing buffer (e.g., PBS). Why does this happen? A: PBS is often problematic due to its high ionic strength and phosphate ions that can bridge particles. The "right" buffer is system-dependent. For citrate-capped metallic nanoparticles, low-ionic-strength buffers (e.g., 2 mM HEPES, pH 7.4) are better. For lipid nanoparticles, isotonic sucrose or histidine buffers often provide superior stability. Your buffer selection must consider the particle's surface chemistry (charge, ligands) and the DLVO theory balance of electrostatic repulsion and van der Waals attraction. Always test a panel of buffers on a small scale first.
Q5: How do I validate that the dialysis protocol was successful and did not alter my particle characteristics? A: Post-dialysis, you must characterize key attributes and compare them to pre-dialysis values. Essential checks include:
- Size and PDI: Dynamic Light Scattering (DLS). A shift >10% in hydrodynamic diameter or PDI increase >0.1 indicates instability.
- Surface Charge: Zeta potential in the new buffer. A significant change (> ±5 mV) suggests altered surface chemistry or adsorption.
- Concentration: Use UV-Vis spectroscopy (for plasmonic nanoparticles) or a quantitative assay (e.g., BCA for protein nanoparticles) to determine recovery yield.
- Morphology: TEM or SEM imaging to confirm the absence of aggregation or shape changes.
Table 1: Dialysis Protocol Parameters for Different Nanoparticle Types
| Nanoparticle Type | Recommended Start Buffer | Target Buffer (Example) | Critical Parameter to Match | Min. Dialysate Volume: Sample Volume | Recommended # of Buffer Changes | Typical Duration (Hours) | Common Destabilizer to Avoid |
|---|---|---|---|---|---|---|---|
| Citrate-capped AuNPs | Original citrate solution | 2 mM HEPES, pH 7.4 | Osmolarity / Ionic Strength | 500:1 | 3 | 24 | High ionic strength (e.g., PBS) |
| Liposomal Doxorubicin | Ammonium sulfate (for active loading) | 10% Sucrose, 10 mM Histidine, pH 6.5 | Osmolarity (must be isotonic) | 200:1 | 4 | 36 | Divalent cations (Ca²⁺, Mg²⁺) |
| Polymeric NPs (PLGA-PEG) | Acetone/Water (post-formulation) | 1X PBS, pH 7.4 | pH and Surfactant Presence | 250:1 | 3 | 24 | Low pH, absence of Pluronic F68 |
| Protein NPs (Albumin) | Phosphate buffer, pH 7.0 | 50 mM NaCl, 20 mM Tris, pH 8.0 | pH and Chelating Agents | 300:1 | 3 | 18 | Phosphate buffers (can promote bridging) |
Table 2: Troubleshooting Matrix: Symptom vs. Likely Cause & Solution
| Symptom | Most Likely Cause | Immediate Action | Preventive Solution for Next Run |
|---|---|---|---|
| Cloudiness & Precipitation | Osmotic shock or rapid pH change | Stop dialysis; centrifuge to salvage pellet if possible. | Use stepwise dialysis; match osmolarity within ±10%. |
| High Loss to Membrane | Hydrophobic or electrostatic adsorption | Rinse membrane with a mild detergent (1% SDS) to recover sample. | Pre-treat membrane (BSA, surfactant); use alternative purification (SEC, TFF). |
| Increased PDI Post-Dialysis | Buffer-induced aggregation | Filter through a low-protein-binding 0.45 µm filter. | Screen buffers for zeta potential stability; include stabilizers (e.g., 0.1% BSA). |
| Low Recovery Yield (<70%) | Combined adsorption and aggregation | Quantify supernatant vs. rinse. | Optimize membrane MWCO (use 3-5x particle size); reduce total dialysis time. |
Experimental Protocols
Protocol 1: Standard Stepwise Dialysis for Sensitive Nanoparticles
Objective: Exchange buffer for nanoparticles prone to osmotic shock (e.g., liposomes, nanocrystals). Materials: Dialysis cassettes (appropriate MWCO), magnetic stirrer, dialysate buffers, DLS instrument.
- Pre-treatment: Soak dialysis membrane in ultra-pure water for 15 min, then in the starting buffer for 10 min.
- Initial Measurement: Record the initial conductivity (Ci) and pH of the nanoparticle sample.
- Step 1 Dialysis: Load sample into cassette. Immerse in Dialysate A (a 1:1 mixture of Start Buffer and Target Buffer). Use a 500:1 volume ratio. Stir gently at 4°C for 2 hours.
- Step 2 Dialysis: Transfer cassette to fresh, full Target Buffer (Dialysate B). Use a 1000:1 volume ratio. Stir at 4°C.
- Buffer Changes: Replace Dialysate B completely at 4, 8, and 16 hours.
- Completion Check: After 24 total hours, measure conductivity (Cf) and pH of the dialysate. It should match fresh Target Buffer (within 5% for conductivity).
- Post-dialysis Characterization: Recover sample. Analyze size, PDI, and zeta potential via DLS.
Protocol 2: High-Recovery Dialysis with Membrane Passivation
Objective: Minimize adsorption losses for precious protein-conjugated or small (<20 nm) nanoparticles. Materials: Regenerated cellulose dialysis tubing, 1% (w/v) BSA solution, target buffer, orbital shaker.
- Passivation: Incubate the pre-wetted dialysis tubing in 1% BSA solution for 45 minutes at room temperature with gentle agitation.
- Rinsing: Rinse the tubing thoroughly inside and out with 50 mL of your starting buffer to remove unbound BSA.
- Sample Loading: Load the nanoparticle sample. Seal the tubing ends securely.
- Dialysate Additive: Add 0.01% Poloxamer 188 to the target buffer dialysate.
- Dialysis: Perform dialysis as per standard protocol, but use an orbital shaker (gentle rocking) instead of a magnetic stir bar to minimize shear stress.
- Sample Recovery: After final buffer change, carefully open the tubing and pipette the sample out. Rinse the tubing interior with 0.5 mL of fresh target buffer and pool with the sample to maximize recovery.
Diagrams
Diagram 1: Buffer Exchange Decision Pathway
Diagram 2: Dialysis-Induced Destabilization Mechanisms
The Scientist's Toolkit: Research Reagent Solutions
| Item | Function & Rationale |
|---|---|
| Regenerated Cellulose Dialysis Membranes (MWCO 3.5-100 kDa) | Provides size-selective exchange with lower protein/nanoparticle adsorption compared to cellulose ester. MWCO should be 3-5x the hydrodynamic diameter of the particle. |
| Slide-A-Lyzer MINI Dialysis Devices | For micro-volume samples (20-100 µL). Minimizes dilution and maximizes membrane surface area-to-volume ratio, speeding up dialysis. |
| HEPES Buffer (10-50 mM, pH 7.0-8.0) | A zwitterionic, biological buffer with minimal ionic strength, ideal for maintaining electrostatic stability of charged nanoparticles without introducing specific ion effects. |
| Poloxamer 188 (Pluronic F68) | A non-ionic triblock copolymer surfactant (0.001-0.1% w/v). Passivates surfaces and membranes, prevents aggregation via steric stabilization, and reduces shear stress. |
| Trehalose (0.5-5% w/v) | A disaccharide used as an isotonic agent and cryo-/lyo-protectant. Provides osmotic balance without ions and can form a stabilizing matrix on particle surfaces. |
| Zeta Potential Reference Standard (e.g., DTAP 005) | A suspension of nanoparticles with a known zeta potential (e.g., -50 mV ± 5). Essential for validating instrument performance before measuring samples post-dialysis. |
| Tangential Flow Filtration (TFF) Cassettes (100-300 kDa MWCO) | An alternative to dialysis for large-volume or time-sensitive buffer exchange. Uses convective flow to exchange buffer rapidly, minimizing sample dilution and processing time. |
| Benchtop Conductivity Meter | Used to monitor the ionic strength of the dialysate over time. Confirms when the exchange is complete (conductivity of dialysate matches target buffer). |
Technical Support & Troubleshooting Center
This section provides targeted guidance for common experimental challenges in nanoparticle buffer selection and stability assessment.
FAQs & Troubleshooting Guides
Q1: My lipid nanoparticles (LNPs) are aggregating immediately upon dilution into PBS from a concentrated stock. What is the cause and how can I mitigate this? A: This is often due to a rapid pH shift or ionic strength shock. PBS has a high ionic strength (~150 mM) which can screen electrostatic repulsion and cause aggregation if the LNPs are stored in a low-ionic-strength buffer (e.g., 10 mM Tris, pH 7.4).
- Solution: Implement a buffer exchange protocol using dialysis or tangential flow filtration (TFF) to gradually increase the ionic strength. Alternatively, formulate LNPs directly in a buffer with physiological ionic strength and osmolarity from the start.
Q2: I am observing degradation of my PLGA polymeric nanoparticles after 4 weeks of storage at 4°C. How can I improve formulation stability? A: PLGA degradation is autocatalytic and hydrolytic. Storage in aqueous buffers will inevitably lead to particle erosion and payload leakage.
- Solution: For long-term storage, lyophilize the nanoparticles using appropriate cryoprotectants (e.g., 5% sucrose or trehalose). Reconstitute in a mildly acidic buffer (e.g., 10 mM citrate, pH 5.5) just before use, as this slows the hydrolysis rate compared to neutral pH.
Q3: My citrate-capped gold nanocrystals are precipitating when I adjust the solution to physiological pH for cellular experiments. Why? A: Citrate capping provides stability via electrostatic repulsion at its native, slightly acidic pH (~pH 6 for many syntheses). At pH 7.4, the carboxyl groups on citrate become deprotonated, but the ionic strength of biological buffers reduces the Debye length, diminishing electrostatic stabilization.
- Solution: Perform ligand exchange to a sterically stabilizing polymer (e.g., mPEG-thiol) before buffer transfer. Alternatively, use a low-ionic-strength buffer like 2 mM HEPES, pH 7.4, for short-term experiments.
Q4: My siRNA-loaded LNPs show high encapsulation efficiency but poor gene silencing in vitro. Could the buffer be a factor? A: Yes. Some common cell culture media components (e.g., heparin sulfate) can displace the siRNA from the LNP. The buffer used for dispersion may also affect the LNP's fusogenicity.
- Solution: Ensure you are using a serum-free buffer (like Opti-MEM) during the initial cell transfection step. Verify that your formulation buffer (e.g., 10 mM citrate, pH 4.0) is properly exchanged to a neutral buffer post-formation to enable the "proton sponge" effect and endosomal escape.
Q5: The zeta potential of my nanoparticles changes dramatically when measured in different buffers. Which value should I report? A: Zeta potential is intrinsically dependent on the ionic strength and pH of the dispersion medium.
- Solution: Always report the exact buffer composition, ionic strength, and pH used for the measurement. For comparative studies, use a standard low-ionic-strength buffer (e.g., 1 mM KCl or 10 mM NaCl). For predictive biological behavior, measure in a buffer mimicking the final application (e.g., PBS or cell culture medium), noting that high ionic strength will compress the double layer and lower the apparent zeta potential.
Table 1: Comparative Stability of Nanoparticle Types in Common Buffers
| Nanoparticle Type | Optimal Buffer (Case Study) | Key Stability Indicator | Sub-Optimal Buffer | Observed Issue (Timeframe) |
|---|---|---|---|---|
| siRNA-LNP (ionizable lipid) | 10 mM Citrate, pH 4.0 (post-synthesis) | >95% EE, PDI <0.1 | PBS, pH 7.4 | Aggregation & siRNA leakage (<24h) |
| PLGA-PEG NP | 10 mM Histidine, pH 6.5 + 5% Sucrose | Size increase <10% (4 weeks, 4°C) | Tris-HCl, pH 7.4 | 40% size increase, payload burst release (2 weeks) |
| Citrate-Au Nanocrystals | 2 mM Citrate, pH 6.0 (as synthesized) | SPR peak shift <2 nm (1 month) | HEPES, 150 mM NaCl, pH 7.4 | Precipitation & SPR broadening (<1 hour) |
| SPIONs (DMSA-coated) | 10 mM MES, pH 6.0 | Hydrodynamic size stable at 25 nm | Phosphate Buffered Saline (PBS) | Aggregation to >500 nm clusters (immediate) |
Table 2: Key Buffer Properties and Their Influence
| Buffer Property | Impact on Lipid NPs | Impact on Polymeric NPs | Impact on Inorganic NCs |
|---|---|---|---|
| pH | Critical for ionizable lipid charge; affects fusion & encapsulation. | Influences degradation rate of polyesters (e.g., PLGA). | Determines surface ligand protonation & colloidal stability. |
| Ionic Strength | High strength can disrupt lipid packing, cause osmotic shock. | Generally minimal direct effect on stability. | Primary driver of electrostatic screening & aggregation. |
| Chelating Agents (e.g., EDTA) | Can destabilize membranes by extracting divalent cations. | Typically benign. | May strip surface ions/ligands, causing instability. |
| Specific Ions (Ca2+, Mg2+) | Can bridge and stabilize anionic lipid membranes. | Minimal effect. | Can cause specific ion adsorption or bridging flocculation. |
Detailed Experimental Protocols
Protocol 1: Buffer Exchange and Stability Assessment for LNPs via Tangential Flow Filtration (TFF)
- Objective: Transfer LNPs from a low-pH formulation buffer to a final storage buffer without inducing aggregation.
- Materials: LNP formulation, TFF system with 100 kDa MWCO cartridges, formulation buffer (e.g., 10 mM citrate, pH 4.0), final buffer (e.g., 1x PBS, pH 7.4, or Tris-sucrose), DLS/Zetasizer.
- Procedure:
- Dilute the initial LNP formulation 1:5 in the final target buffer.
- Assemble the TFF system and prime with the final buffer.
- Load the diluted LNP sample into the feed reservoir.
- Start the peristaltic pump and maintain a gentle cross-flow. Apply a transmembrane pressure (TMP) of 1-5 psi.
- Continuously diafilter against 10-20 volumes of the final buffer.
- Concentrate the retentate to the desired final volume.
- Recover the exchanged LNP sample. Measure particle size (DLS), PDI, and zeta potential immediately and after 24h storage at 4°C.
Protocol 2: Accelerated Stability Study for Polymeric Nanoparticles
- Objective: Predict long-term stability of PLGA NPs under various buffer conditions.
- Materials: PLGA NP suspension, buffers for testing (e.g., acetate pH 5.0, phosphate pH 7.4), controlled temperature incubator, DLS, HPLC for payload assay.
- Procedure:
- Aliquot identical volumes of the NP suspension into separate microcentrifuge tubes.
- Centrifuge each aliquot and carefully remove the supernatant.
- Resuspend each pellet in an equal volume of a different test buffer. One tube should use the "optimal" buffer as a control.
- Incubate all samples at 37°C (accelerated condition) and 4°C (standard condition).
- At predetermined time points (e.g., 1, 3, 7, 14 days), analyze each sample in triplicate for:
- Hydrodynamic diameter and PDI via DLS.
- Payload content in the supernatant after centrifugation (indicative of leakage).
Visualizations
Buffer Mismatch Troubleshooting for LNPs
Buffer Factors Influencing Nanoparticle Stability
The Scientist's Toolkit: Research Reagent Solutions
Table 3: Essential Materials for Nanoparticle Buffer Stability Research
| Reagent/Material | Primary Function | Example Use Case |
|---|---|---|
| HEPES Buffer (1M, pH 7.0-8.0) | Biological pH stabilization with minimal metal chelation. | Maintaining pH during short-term cellular uptake studies of inorganic NCs. |
| Histidine-HCl Buffer (10-50 mM) | Low ionic strength buffer with good buffering capacity near physiological pH. | Stabilizing therapeutic protein-loaded LNPs or polymeric NPs during storage. |
| Sucrose/Trehalose (5-10% w/v) | Cryoprotectant and lyoprotectant. | Lyophilization of NP formulations for long-term shelf-life. |
| Ethylenediaminetetraacetic Acid (EDTA) | Chelating agent for divalent cations (Ca2+, Mg2+). | Preventing metal-ion catalyzed degradation or investigating ion-dependent aggregation. |
| Dialysis Cassettes/TFF Systems | Buffer exchange and purification. | Removing organic solvents or transferring NPs to a new buffer system without aggregation. |
| Dynamic Light Scattering (DLS) Instrument | Measuring hydrodynamic size, PDI, and zeta potential. | Primary tool for quantifying colloidal stability in different buffers over time. |
| Citric Acid/Sodium Citrate | Providing a low-pH, low-ionic-strength environment. | Initial stabilization of cationic/ionizable LNPs post-synthesis. |
| Poloxamer 188 (Pluronic F-68) | Non-ionic surfactant and steric stabilizer. | Preventing aggregation of NPs in high-ionic-strength biological fluids. |
Solving Dispersion Challenges: Diagnosing and Fixing Buffer-Induced Instability
Troubleshooting Guides & FAQs
Dynamic Light Scattering (DLS) Issues
Q1: My DLS measurement shows multiple peaks. What does this mean and how should I proceed? A: Multiple peaks in the intensity-weighted size distribution typically indicate a polydisperse sample with aggregated species. First, verify the sample is free of dust by filtering buffers and using clean vials. Check the count rate; a low value may signal poor scattering from low concentration. Dilute the sample in its own buffer to rule out concentration-dependent aggregation. Run the measurement at multiple angles if possible; if larger aggregates disappear at higher angles, they may be few in number (as intensity weighting overemphasizes large particles). Correlate with a microscopy image.
Q2: The polydispersity index (PDI) from DLS is high (>0.2). Is my sample aggregated? A: A high PDI suggests a broad size distribution, which can be due to aggregation, but also to a genuinely polydisperse synthesis or the presence of a few large contaminants. Perform a step-by-step diagnostic:
- Filter the sample through a 0.22 µm or 0.45 µm filter. If PDI drops dramatically, the cause was large contaminants.
- Analyze the volume-weighted or number-weighted distribution (if instrument software provides it). These are less sensitive to large aggregates than the default intensity-weighted distribution.
- Use a complementary technique like TEM or SEM to visualize the population.
Zeta Potential Issues
Q3: My zeta potential measurement is unstable or shows very low magnitude. What buffer factors should I check? A: Low ionic strength buffers (<10 mM) are ideal for accurate zeta potential. High salt concentrations compress the double layer, reducing the measurable potential and increasing heating. Ensure your buffer has adequate buffering capacity at your measurement pH; drifting pH can cause particle charge to change. Avoid buffers with high mobility ions like citrate or phosphate for measurements in pure water; use dilute KCl or NaCl as the background electrolyte. The presence of non-ionic surfactants or polymers will not contribute to zeta but may stabilize particles sterically.
Q4: How do I interpret a zeta potential value in the context of stability? A: As a general rule of thumb, particles with zeta potentials greater than +30 mV or less than -30 mV are considered physically stable due to strong electrostatic repulsion. Values between ±10 mV are prone to aggregation. However, this rule applies primarily to electrostatic stabilization. Steric stabilizers (e.g., PEG) can provide stability even at low zeta potential. Always consider zeta in conjunction with DLS size trends over time.
Microscopy (TEM/SEM) Issues
Q5: My TEM images show aggregation that wasn't indicated by DLS. Why the discrepancy? A: This is common. DLS hydrodynamically averages over a large sample volume (µL), while TEM examines a tiny, dried fraction (nL). The sample preparation for TEM (droplet drying on a grid) can itself induce aggregation that wasn't present in solution. For a valid comparison, use cryo-TEM, which vitrifies the sample in its native, hydrated state. Also, DLS may not detect a small population of large aggregates if the majority of particles are monodisperse.
Q6: How can I ensure my microscopy sample preparation is representative? A: Always prepare the microscopy grid directly from the vial used for DLS/zeta, at the same time. For negative staining, apply a small droplet (3-5 µL), blot after 30-60 seconds (do not let dry completely), and immediately apply stain. Briefly glow-discharge grids prior to use to make them hydrophilic and ensure even sample spreading. Take images from multiple grid squares to account for variation.
Key Experimental Protocols
Protocol 1: Integrated DLS & Zeta Potential Measurement for Buffer Screening
Purpose: To systematically evaluate the colloidal stability of nanoparticles in different candidate buffers. Materials: Nanoparticle stock, candidate buffers (e.g., 10 mM HEPES pH 7.4, 10 mM PBS pH 7.4, 10 mM citrate pH 6.0), DLS/Zeta instrument, disposable folded capillary cells, syringe filters (0.22 µm). Method:
- Filter all buffers through a 0.22 µm membrane.
- Dialyze or dilute the nanoparticle stock 1:100 into each candidate buffer. Use the buffer as the diluent. Prepare 1 mL of each sample.
- Equilibrate samples at measurement temperature (e.g., 25°C) for 5 minutes.
- Load sample into a clean, disposable capillary cell, avoiding bubbles.
- Measure the zeta potential first (typically 10-100 runs). Record the mean and standard deviation.
- Immediately measure the DLS size and PDI in the same cell (3-10 measurements, 30 seconds each).
- Repeat for each buffer condition.
- Store samples under relevant conditions and repeat DLS measurements at 24h, 48h, and 1 week to monitor size increase over time.
Protocol 2: Correlative Analysis Using DLS and Negative Stain TEM
Purpose: To visually confirm DLS size data and identify aggregation morphology. Materials: Nanoparticle sample, TEM grid (e.g., carbon-coated copper), glow discharger, negative stain (2% uranyl acetate), filter paper, TEM. Method:
- Perform DLS measurement as per Protocol 1. Record the intensity-weighted size distribution.
- Glow-discharge the TEM grid for 30 seconds to render it hydrophilic.
- Apply 5 µL of the same nanoparticle sample used for DLS to the grid for 60 seconds.
- Wick away the liquid with filter paper from the edge, leaving a thin film.
- Immediately apply 5 µL of negative stain for 30 seconds.
- Wick away the stain completely and allow the grid to air dry.
- Image using TEM at appropriate magnifications. Measure the diameter of at least 100 particles from micrographs using ImageJ software.
- Compare the number-weighted distribution from TEM to the DLS volume-weighted distribution.
Table 1: Typical Correlation Between Zeta Potential and Stability
| Zeta Potential Range (mV) | Theoretical Stability Prediction | Likely Aggregation State in Low Ionic Strength Buffer |
|---|---|---|
| 0 to ±10 | Highly unstable | Rapid aggregation likely |
| ±10 to ±20 | Moderately unstable | Slow aggregation over time |
| ±20 to ±30 | Moderately stable | May be stable, sensitive to environmental changes |
| > ±30 | Highly stable | Electrostatic stabilization dominant |
Table 2: Diagnostic Output from Combined Techniques
| Observation | DLS (Size/PDI) | Zeta Potential | Microscopy | Likely Root Cause | ||
|---|---|---|---|---|---|---|
| Classic Aggregation | Increased size, high PDI, multimodal | Low magnitude (< | 20 | mV) | Visible clustered particles | Insufficient electrostatic repulsion |
| Presence of Few Large Contaminants | Moderate PDI, large tail in distribution | Normal | Rare, large debris | Dirty buffers or labware | ||
| Shear-Induced Aggregation | Size increases after vortexing/pipetting | May be normal | Large, irregular clusters | Particle surface is shear-sensitive | ||
| Steric Stabilization (e.g., PEG) | Stable size, low PDI | Low or near zero | Well-dispersed, individual particles | Effective steric coating present |
Diagrams
Title: DLS High PDI Diagnostic Workflow
Title: Buffer Screening Stability Protocol
The Scientist's Toolkit: Research Reagent Solutions
Table 3: Essential Materials for Nanoparticle Stability Diagnostics
| Item | Function & Importance |
|---|---|
| Disposable Zeta Cells | Prevents cross-contamination between samples, crucial for accurate zeta potential measurement. |
| Syringe Filters (0.22 µm) | Removes dust and large contaminants from buffers and samples, essential for reliable DLS data. |
| Dialysis Cassettes/Tubing | Allows for gentle, thorough buffer exchange of nanoparticle samples without concentrating or shearing. |
| Certified Zeta Standard | (e.g., -50 mV standard) Used to validate instrument performance and electrode condition before measurements. |
| Glow Discharger | Treats TEM grids to make them hydrophilic, ensuring even sample spreading for representative microscopy. |
| High-Purity Salts & Buffers | Essential for preparing low-conductivity, particle-free solutions to avoid interfering with measurements. |
| Negative Stains | (e.g., Uranyl acetate, Phosphotungstic acid) Provides contrast for imaging nanoparticles in TEM. |
Welcome to the Technical Support Center
This center provides troubleshooting and FAQs for researchers determining the isoelectric point (pI) of nanoparticles and optimizing pH for electrostatic stabilization. This guide is framed within the thesis: Selecting the right buffer for nanoparticle dispersion stability research.
FAQs & Troubleshooting Guides
Q1: During my pI determination via ζ-potential titration, my measurements are inconsistent and noisy. What could be the cause? A: Inconsistent ζ-potential readings during titration are common. Key troubleshooting steps include:
- Buffer Ionic Strength: Ensure the ionic strength is constant and low (e.g., 1-10 mM) throughout the titration. High ionic strength compresses the electrical double layer, making measurements unstable. Use the same background electrolyte (e.g., NaCl) at the same concentration in all samples.
- Equilibration Time: After each pH adjustment, allow the nanoparticle dispersion to equilibrate for at least 5-15 minutes with gentle stirring before measurement. pH electrodes and particle surfaces require time to reach equilibrium.
- Sample Conductivity: Excessively high conductivity can generate heat and interfere with measurement. Dilute samples with low-ionic-strength water if needed, maintaining particle concentration.
- Cleaning Protocol: Contamination is a major source of noise. Rinse the measurement cell and electrodes thoroughly with deionized water and a sample aliquot between measurements.
Q2: I found the pI, but my nanoparticles still aggregate near the pI even when I quickly change the pH. How can I study this without losing my sample? A: Aggregation at the pI is driven by the loss of electrostatic repulsion. To study this reversibly:
- Use a Well-Buffered System: Prepare two identical nanoparticle dispersions, one buffered at a pH well below the pI (positively charged) and one well above (negatively charged).
- Rapid, Controlled Mixing: Use a stopped-flow or rapid mixing apparatus to combine equal volumes of the two dispersions. The final mixture will be at the pI.
- Immediate Characterization: Use in-situ diagnostics like dynamic light scattering (DLS) to monitor hydrodynamic size immediately upon mixing. This allows you to observe aggregation kinetics without irreversible sedimentation.
- Stabilizer Pre-inclusion: This experiment proves the need for steric stabilizers (e.g., polymers) if colloidal stability is required across a wide pH range including the pI.
Q3: For long-term stability, how far from the pI should I adjust the pH? Is there a general rule? A: Stability depends on the magnitude of the ζ-potential. The following table summarizes general guidelines:
| ζ-Potential Magnitude (mV) | Colloidal Stability Prediction | Recommended Action for Long-Term Storage |
|---|---|---|
| 0 to ±5 | Highly unstable; rapid aggregation | Avoid completely. This is the aggregation zone. |
| ±10 to ±20 | Moderate (short-term) stability | May be suitable for processing, not storage. |
| ±20 to ±30 | Good stability | Generally acceptable for many applications. |
| > ±30 | Excellent physical stability | Ideal for long-term storage and formulation. |
For robust electrostatic stabilization, target a pH that yields a ζ-potential magnitude > |±25| mV. The required buffer capacity must maintain this pH against external stresses.
Q4: My chosen buffer is maintaining pH, but my nanoparticles are aggregating over time. What's wrong? A: The buffer may be interacting with the nanoparticle surface.
- Specific Ion Adsorption: Buffer ions can specifically adsorb onto the nanoparticle surface, altering the effective surface charge and pI. For example, citrate ions can make surfaces more negative.
- Troubleshooting Test: Perform ζ-potential vs. pH titrations using two different buffer systems (e.g., acetate vs. phosphate) at the same ionic strength. If the resulting pI shifts, you have evidence of specific ion adsorption.
- Solution: Select a non-adsorbing buffer. Good initial choices are simple ionic buffers like NaClO₄ or NaNO₃ for background electrolyte, with careful pH adjustment using minimal volumes of NaOH/HCl. For buffering, consider organic buffers like MOPS or HEPES that are less likely to adsorb on many surfaces.
Detailed Experimental Protocols
Protocol 1: Determining the Isoelectric Point (pI) via ζ-Potential Titration
Objective: To measure the pH at which the nanoparticle ζ-potential is zero.
Materials:
- Nanoparticle dispersion (concentrated stock)
- Low-ionic-strength background electrolyte (e.g., 1 mM NaCl)
- HCl (0.1 M) and NaOH (0.1 M) for titration
- pH meter with micro-electrode
- ζ-potential analyzer (e.g., Malvern Zetasizer)
- Magnetic stirrer & micro stir bars
- Centrifugal filters (if buffer exchange is needed)
Method:
- Buffer Exchange: Dialyze or filter-centrifuge the nanoparticle dispersion against 1 mM NaCl solution to remove any original salts or buffers. Redisperse to desired concentration.
- Sample Preparation: Prepare 10-12 samples of equal nanoparticle volume (e.g., 1.5 mL each).
- pH Adjustment: Adjust each sample to a target pH spanning a wide range (e.g., pH 3 to 10). Use small aliquots of 0.1 M HCl or NaOH. Record the final exact pH.
- Equilibration: Let each sample equilibrate for 10 minutes with gentle stirring.
- Measurement: Load each sample into the ζ-potential cell. Measure ζ-potential at 25°C with appropriate instrument settings.
- Data Analysis: Plot ζ-potential vs. pH. Fit a curve through the data points. The x-intercept (where ζ-potential = 0) is the isoelectric point (pI).
Protocol 2: Assessing Long-Term Stability at Target pH
Objective: To verify colloidal stability after identifying an optimal pH from Protocol 1.
Method:
- Dispersion Preparation: Prepare three nanoparticle dispersions at the same concentration and ionic strength:
- Sample A: pH << pI (e.g., pI - 3 units)
- Sample B: pH >> pI (e.g., pI + 3 units)
- Sample C: pH near the pI (control).
- Buffer Selection: Use a buffer with adequate capacity (e.g., 10-20 mM) that does not adsorb (see FAQ Q4). Filter sterilize (0.22 µm) if needed.
- Initial Characterization: Measure and record for each sample: pH, ζ-potential, and hydrodynamic diameter (by DLS) at Time = 0.
- Stability Monitoring: Store samples under relevant conditions (e.g., 4°C, 25°C). Periodically (e.g., 1 day, 1 week, 1 month) re-measure pH, ζ-potential, and size. Observe for visual precipitation.
- Analysis: Stable samples will maintain constant size and ζ-potential. An increase in mean size indicates aggregation.
Visualizations
Diagram 1: Workflow for Nanoparticle pH Optimization & Stability Screening
Diagram 2: Forces Governing Nanoparticle Dispersion Stability
The Scientist's Toolkit: Key Research Reagent Solutions
| Reagent / Material | Function in Experiment | Critical Consideration |
|---|---|---|
| Low-Ionic-Strength Electrolyte (e.g., 1 mM NaCl) | Provides constant, minimal ionic background for ζ-potential measurements without compressing the double layer. | Purity is key. Use analytical grade and prepare with ultra-pure water (18.2 MΩ·cm). |
| Non-Adsorbing Buffer Salts (e.g., MOPS, HEPES) | Maintains target pH without specifically adsorbing to nanoparticle surfaces and shifting the pI. | Verify compatibility with your nanomaterial. Test pI in multiple buffer systems. |
| ζ-Potential Analyzer | Measures the electrostatic potential at the slipping plane of particles, determining surface charge and pI. | Ensure correct concentration, temperature equilibration, and cell cleaning between samples. |
| pH Micro-Electrode | Accurately measures the pH of small volume samples before ζ-potential analysis. | Requires frequent calibration (2-point minimum) and proper storage in KCl solution. |
| Dynamic Light Scattering (DLS) Instrument | Monitors hydrodynamic diameter over time to quantify aggregation and assess long-term stability. | Always filter buffers (0.22 µm) to eliminate dust, a major source of artifact. |
| Centrifugal Filter Units (e.g., 10 kDa MWCO) | Exchanges the dispersion medium into the desired buffer/electrolyte for controlled sample preparation. | Select a molecular weight cutoff (MWCO) significantly smaller than your nanoparticle size. |
Technical Support & Troubleshooting Center
FAQs & Troubleshooting Guides
Q1: My nanoparticles aggregate immediately upon adding a standard PBS buffer for a drug loading experiment. What went wrong? A: This is a classic sign of electrolyte-induced aggregation. PBS has a high ionic strength (~150-200 mM). Many nanoparticles, especially liposomes or polymeric NPs with a low surface charge density (zeta potential), are unstable at high ionic strength due to compression of the electrical double layer. The salts in PBS screen the repulsive forces between particles, allowing van der Waals attraction to dominate and cause aggregation. Solution: Switch to or dilute with a low-ionic-strength buffer (e.g., 2-10 mM HEPES or Tris, pH-adjusted). Consider using sucrose or mannitol for isotonicity instead of NaCl. Always add buffer to the nanoparticle dispersion slowly and with gentle mixing.
Q2: I am trying to "salt-out" proteins from a nanoparticle mixture, but my nanoparticles also precipitate. How can I selectively isolate the protein? A: The salting-out effect (e.g., using ammonium sulfate) is non-specific and will destabilize any colloidal entity, including your nanoparticles. Solution: You must first optimize the salt concentration. Use a precipitation curve to find the range where the protein precipitates but the nanoparticles remain stable (typically at lower % saturation). Perform a pilot experiment with a broad range of salt concentrations and monitor both protein recovery (via Bradford assay) and nanoparticle stability (via DLS size and PDI). See Table 1 and Protocol 1.
Q3: My DLS results show increased size and PDI after filtering my nanoparticle suspension through a sterile 0.22 µm filter with a certain buffer. The buffer alone shows no particles. A: This is likely filter-induced aggregation, exacerbated by buffer ionic strength. Filters can create shear forces and interact with nanoparticle surfaces. Solution:
- Verify the filter material is compatible with your nanoparticles (e.g., cellulose acetate over PVDF for liposomes).
- Pre-wet the filter with 5-10 mL of your final low-ionic-strength buffer.
- Consider sequential filtration through larger pore sizes (e.g., 1.0 µm then 0.45 µm then 0.22 µm) to reduce shear stress.
- Re-check the ionic strength and pH of your final buffer.
Q4: How do I systematically choose a buffer for long-term stability studies of my novel lipid nanoparticle formulation? A: Stability is a function of pH (affects surface charge), ionic strength (affects double layer), and chemical compatibility. Follow a decision workflow (See Diagram 1) and a systematic screening protocol (See Protocol 2).
Data Presentation
Table 1: Effect of Common Buffer Ionic Strength on Model Nanoparticle Stability Data based on typical DLS and zeta potential measurements for 100 nm liposomes and 50 nm polymeric NPs (PLGA).
| Buffer System | Approx. Ionic Strength (mM) | Observed Effect on Liposome (ζ ~ -30 mV) | Observed Effect on PLGA NP (ζ ~ -15 mV) | Recommended Use Case |
|---|---|---|---|---|
| 1 mM HEPES, pH 7.4 | ~1 | Stable; negligible size change over 24h. | Stable; slight aggregation after 48h. | Initial dispersion, purification. |
| 10 mM HEPES + 5% Sucrose, pH 7.4 | ~10 | Stable long-term (>1 week). | Stable for 72h. | Long-term storage, cryopreservation. |
| 10 mM Phosphate Buffer, pH 7.4 | ~20 | Moderate growth in PDI after 6h. | Rapid aggregation within 1h. | Not recommended for low-ζ systems. |
| Standard PBS (1X), pH 7.4 | ~150 | Immediate, visible aggregation. | Immediate, visible aggregation. | Avoid for colloidal stability studies. |
| 20 mM Tris + 50 mM NaCl, pH 8.0 | ~60 | Slow aggregation over 2h. | Immediate aggregation. | Use only for charged, stable NPs. |
Experimental Protocols
Protocol 1: Determining the Critical Aggregation Concentration (CAC) for Electrolytes Objective: To find the ionic strength threshold at which a specific nanoparticle formulation aggregates. Materials: Nanoparticle stock suspension, low-ionic-strength base buffer (e.g., 1 mM HEPES, pH 7.4), concentrated salt solution (e.g., 2M NaCl), DLS instrument, microcentrifuge tubes. Steps:
- Prepare a dilution series of the concentrated salt solution in the base buffer to create 1 mL solutions with final NaCl concentrations of 0, 10, 25, 50, 75, 100, 150, and 200 mM.
- Add 10 µL of concentrated nanoparticle stock to 990 µL of each salt solution. Mix by gentle inversion (10x).
- Incubate at room temperature for 15 minutes.
- Measure the hydrodynamic diameter (Z-average) and PDI of each sample via DLS immediately.
- Plot Z-average and PDI vs. NaCl concentration. The CAC is identified as the point where a sharp, sustained increase in both parameters occurs.
- The maximum stable ionic strength for your formulation is 20-30% below this CAC.
Protocol 2: Systematic Buffer Screening for Dispersion Stability Objective: To compare the stabilizing efficacy of different buffer systems for a novel nanoparticle formulation. Materials: Nanoparticle concentrate, candidate buffers (see Scientist's Toolkit), DLS/Zetasizer, incubation equipment. Steps:
- Prepare Buffers: Prepare 10 mL of each candidate buffer. Filter all (0.22 µm).
- Disperse: Add nanoparticles to each buffer to achieve standard concentration (e.g., 0.1 mg/mL). Use consistent mixing.
- Time Point Zero (T0): Measure particle size (Z-avg, PDI) and zeta potential for each sample in triplicate.
- Incubate: Aliquot each sample into separate vials for different stress conditions: A) 25°C (room temp), B) 4°C (fridge), C) 37°C (physiological).
- Monitor: Measure size and PDI at T= 1h, 4h, 24h, 72h, and 1 week for each condition.
- Analyze: The optimal buffer maintains size (±10% of T0), PDI (<0.2), and zeta potential (±5 mV) across all time points and stress conditions.
Mandatory Visualizations
Diagram 1: Buffer Selection Workflow for NP Stability
Diagram 2: Electrolyte-Induced Aggregation Pathway
The Scientist's Toolkit: Research Reagent Solutions
Table 2: Essential Materials for Ionic Strength Management Studies
| Item | Function & Key Consideration |
|---|---|
| HEPES Buffer (1-10 mM) | Standard low-ionic-strength buffer. Good's buffer with minimal metal binding. Ideal for creating baseline dispersion. |
| Tris-HCl Buffer (1-20 mM) | Common low-ionic-strength buffer. Watch for pH sensitivity to temperature. |
| Ammonium Sulfate | For controlled salting-out studies. High solubility allows precise adjustment of ionic strength. |
| Sucrose / Trehalose | Non-ionic osmolytes. Used to achieve physiological osmolarity (~300 mOsm/kg) without increasing ionic strength. |
| Dialysis Cassettes (3.5 kDa MWCO) | For buffer exchange into low-ionic-strength buffers post-synthesis or purification. |
| Sterile Syringe Filters (Cellulose Acetate, 0.22 µm) | For gentle filtration of sensitive nanoparticle dispersions without inducing aggregation. |
| Zeta Potential Reference Standard (e.g., -50 mV) | To validate instrument performance before measuring sample zeta potential, a critical stability indicator. |
| Dynamic Light Scattering (DLS) Plates/Cuvettes | For high-throughput or standard size/PDI measurements across multiple buffer conditions. |
Technical Support Center: Troubleshooting & FAQs
This support center addresses common issues in formulating buffers for nanoparticle dispersion stability, framed within the thesis: Selecting the right buffer for nanoparticle dispersion stability research.
FAQ: Core Concepts & Selection
Q1: What is the primary functional difference between a stabilizer and a surfactant in my nanoparticle dispersion buffer? A: Both aim to prevent aggregation, but their mechanisms differ. Stabilizers (e.g., polymers like PVP, polysaccharides) provide steric hindrance by adsorbing onto the nanoparticle surface, creating a physical barrier. Surfactants (e.g., Polysorbate 20, SDS) provide electrostatic and/or steric stabilization. Ionic surfactants charge the surface, increasing electrostatic repulsion (electrostatic stabilization), while non-ionic ones provide steric hindrance. Choice depends on nanoparticle surface properties and desired stabilization mechanism.
Q2: When is a cryoprotectant necessary in my buffer formulation? A: Cryoprotectants are essential if you plan to lyophilize (freeze-dry) your nanoparticle dispersion or subject it to freeze-thaw cycles. Without them, ice crystal formation and increased solute concentration during freezing can destabilize particles, leading to irreversible aggregation upon reconstitution. Common cryoprotectants include sucrose, trehalose, and mannitol.
Q3: How do I choose between a polysorbate (e.g., Tween 80) and a poloxamer (e.g., P188) as a surfactant/stabilizer? A: Consider your nanoparticle composition and research phase. Polysorbates (small molecules) offer strong interfacial activity and are common in final drug products. Poloxamers (block copolymers) provide robust steric stabilization due to their larger size. For in vitro studies, poloxamers are often preferred for long-term steric stability. For translational research mimicking drug product, polysorbates may be required. Compatibility studies are crucial.
Troubleshooting Guides
Issue 1: Nanoparticle Aggregation Upon Buffer Exchange or Dilution.
- Potential Cause: Inadequate concentration of stabilizer/surfactant below the critical micelle concentration (CMC) or required minimum steric coating level.
- Solution: Determine the optimal concentration. Prepare a series of buffer formulations with increasing excipient concentration. Disperse nanoparticles and measure hydrodynamic diameter (e.g., via DLS) over 24-48 hours. The lowest concentration that maintains stable size is optimal.
- Protocol: Determination of Minimum Stabilizing Concentration (MSC)
- Prepare 10 mL of your base buffer (e.g., 10 mM PBS, pH 7.4).
- Spike in your chosen stabilizer/surfactant to create concentrations: 0.001%, 0.01%, 0.05%, 0.1%, 0.5% w/v.
- Add a fixed volume of your concentrated nanoparticle stock to each buffer to achieve a target final particle concentration.
- Mix gently by inversion. Measure the Z-average diameter and PDI via DLS immediately (t=0), after 1 hour, and 24 hours.
- Plot size & PDI vs. excipient concentration. The MSC is the point before a significant size increase occurs.
Issue 2: Particle Size Increases After Lyophilization and Reconstitution.
- Potential Cause: Insufficient cryoprotectant or suboptimal freezing rate, leading to cryo-destabilization.
- Solution: Increase the cryoprotectant-to-nanoparticle ratio and optimize the lyophilization cycle. Sucrose or trehalose at 5-10% w/v is often effective.
- Protocol: Cryoprotectant Screening for Lyophilization
- Formulate five identical nanoparticle dispersions in their final buffer with stabilizers.
- Add: (1) No cryoprotectant (control), (2) 2% sucrose, (3) 5% sucrose, (4) 5% trehalose, (5) 5% mannitol.
- Aliquot 1 mL into identical glass lyophilization vials.
- Snap-freeze in a dry ice/ethanol bath or use a controlled rate freezer.
- Lyophilize using a standard primary and secondary drying cycle.
- Reconstitute with 1 mL of purified water. Vortex gently for 30 seconds.
- Measure recovered particle size, PDI, and assess for visible aggregates. The optimal cryoprotectant yields size and PDI closest to the pre-lyophilization values.
Issue 3: High Polydispersity Index (PDI > 0.2) After Introducing a New Surfactant.
- Potential Cause: Incompatibility between surfactant and nanoparticle surface or buffer components, leading to heterogeneous coating and partial aggregation.
- Solution: Perform a compatibility test. Check if the surfactant's charge (anionic/cationic/non-ionic) opposes your nanoparticle's core charge, causing flocculation.
- Protocol: Rapid Surfactant/Stabilizer Compatibility Test
- In a microplate or small tubes, prepare 500 µL of nanoparticle dispersion at 2x the typical working concentration.
- Prepare separate 500 µL solutions of candidate surfactants/stabilizers at 2x the target final concentration in buffer.
- Mix one part nanoparticle with one part excipient solution (1:1 ratio). Include a buffer-only control.
- Incubate at room temperature for 1 hour.
- Visually inspect for cloudiness or precipitates. Measure absorbance at 600 nm (turbidity) and DLS size/PDI. A significant increase in any parameter indicates incompatibility.
Table 1: Common Excipients in Nanoparticle Buffer Formulations
| Excipient Category | Example Compounds | Typical Working Concentration Range | Primary Stabilization Mechanism | Key Note for Selection |
|---|---|---|---|---|
| Surfactants | Polysorbate 20 (Tween 20) | 0.001 - 0.1% v/v | Steric / Electrostatic | Can cause immune reactions; monitor hydrolysis. |
| Polysorbate 80 (Tween 80) | 0.001 - 0.1% v/v | Steric / Electrostatic | Common for hydrophobic NPs. Slightly more lipophilic than PS20. | |
| Sodium Dodecyl Sulfate (SDS) | 0.01 - 0.1% w/v | Electrostatic (Anionic) | Harsh, often for in vitro only. Can denature proteins. | |
| Polymeric Stabilizers | Polyvinylpyrrolidone (PVP K30) | 0.1 - 5% w/v | Steric Hindrance | Excellent for metal nanoparticles. |
| Polyethylene Glycol (PEG, 2k-5k Da) | 0.1 - 2% w/v | Steric Hindrance | "Stealth" effect, reduces protein adsorption. | |
| Poloxamer 188 (Pluronic F68) | 0.1 - 2% w/v | Steric Hindrance | Biocompatible; often used for lipid-based NPs. | |
| Cryoprotectants | Sucrose | 2 - 10% w/v | Vitrification / Water Replacement | Prevents ice crystal damage during freeze-drying. |
| Trehalose | 2 - 10% w/v | Vitrification / Water Replacement | More stable than sucrose at high temps. | |
| Mannitol | 2 - 5% w/v | Crystalline Matrix Formation | Can form a crystalline cake, good for bulking. |
Table 2: Troubleshooting Guide Summary Table
| Observed Problem | Most Likely Culprit | Immediate Diagnostic Test | Recommended Corrective Action |
|---|---|---|---|
| Fast aggregation in fresh dispersion | Surfactant/Stabilizer concentration too low | Measure size immediately after prep and after 1 hr. | Increase excipient conc. up to MSC. |
| Aggregation over days/weeks | Long-term colloidal instability | Monitor size & zeta potential over 7 days. | Optimize pH closer to nanoparticle's isoelectric point or switch to stronger steric stabilizer. |
| Aggregation only upon dilution | Dynamic desorption of weakly-adsorbed excipient | Dilute sample 10-fold and measure size over 30 mins. | Use a polymeric stabilizer with multi-point anchoring (e.g., poloxamer) or increase conc. |
| Cloudiness after freeze-thaw | Missing or wrong cryoprotectant | Perform a single freeze-thaw cycle and check turbidity. | Incorporate 5% sucrose or trehalose. Use faster freezing (liquid N2). |
Experimental Workflow Diagram
Title: Nanoparticle Buffer Formulation Optimization Workflow
The Scientist's Toolkit: Research Reagent Solutions
| Essential Material | Function in Buffer Formulation | Example Supplier/ Catalog Consideration |
|---|---|---|
| PBS, 10X Concentrate | Provides physiological pH and ionic strength. Dilute to 1X-10 mM for minimal salt-induced aggregation. | Thermo Fisher, Sigma-Aldrich. Use ultrapure, nanoparticle-tested grades. |
| HEPES Buffer Powder | Effective zwitterionic buffer for pH 7.0-8.5, often with less metal chelation than phosphate. | BioPerformance Certified (Sigma), suitable for cell-based assays. |
| Polysorbate 80 (Tween 80) | Non-ionic surfactant for steric stabilization. Reduces surface tension and adsorption. | Use low-peroxide, cell-culture tested grades for biological assays. |
| Poloxamer 188 (Pluronic F68) | Triblock copolymer stabilizer. Provides robust steric hindrance for long-term stability. | Select powder with defined average molecular weight for reproducibility. |
| D-(+)-Trehalose Dihydrate | Non-reducing disaccharide cryoprotectant. Protects nanoparticles during freeze-drying. | Molecular biology or anhydrous grade >99% purity. |
| Zeta Potential Standard | (e.g., DTAP-050) Verifies instrument performance for surface charge measurements. | Available from Malvern Panalytical or other DLS/zeta potential instrument manufacturers. |
| Sterile Syringe Filters, 0.22 µm | For sterile filtration of buffers before adding nanoparticles to remove particulate contaminants. | Use PES or cellulose acetate membranes; avoid protein-binding membranes. |
| Dialysis Tubing/Slide-A-Lyzer | For buffer exchange into the final formulated buffer, removing solvents, salts, or unbound ligands. | Choose appropriate MWCO (e.g., 10kDa) relative to nanoparticle and excipient size. |
Troubleshooting Guide & FAQs
Q1: Why does my nanoparticle dispersion aggregate after 4°C storage for one month, even though the initial DLS showed excellent monodispersity?
A: This is a classic sign of buffer degradation or insufficient buffering capacity. Common causes are:
- pH Drift: CO₂ absorption from air can acidify carbonate/bicarbonate or amine-based buffers (e.g., Tris), reducing electrostatic repulsion between particles.
- Microbial Growth: In non-sterile conditions, microbial contamination in buffers like phosphate can alter pH and ionic strength.
- Evaporation: Improperly sealed containers lead to increased ionic strength, compressing the electrical double layer.
- Chemical Degradation: For example, EDTA can precipitate out of solution over time, especially with divalent cations present.
Protocol for Diagnosis: Isolate the variable by testing fresh nanoparticles in: (1) the aged buffer and (2) freshly prepared identical buffer. Measure pH, osmolality, and DLS size. If aggregation occurs only in the aged buffer, the buffer is the culprit.
Q2: My buffer contains a stabilizing agent (e.g., BSA, Polysorbate 20). How do I assess its degradation over long-term storage?
A: Functional degradation of stabilizers is critical. For surfactants like Polysorbate, monitor for hydrolysis (forming free fatty acids, which can lower pH and form particulates). For proteins like BSA, check for aggregation or fragmentation.
Protocol for Surfactant Analysis: Use a colorimetric assay (e.g., Ferric Thiocyanate) to quantify peroxide value as an indicator of oxidative degradation. Combine with pH measurement and visual inspection for haziness.
Q3: What are the best practices for preparing and storing buffers specifically for multi-year nanoparticle stability studies?
A: Key practices include:
- Use of Preservatives: For non-injectable research formulations, add 0.02% sodium azide to inhibit microbial growth.
- Aseptic Filtration: Sterilize buffers through a 0.22 µm filter into pre-sterilized containers.
- Inert Atmosphere: For oxygen- or CO₂-sensitive buffers, sparge with argon or nitrogen and use airtight seals.
- Aliquoting: Store in small, single-use volumes to minimize freeze-thaw cycles and repeated exposure to air.
- Material: Use glass or CO₂-impermeable polymers (e.g., Aclar) instead of standard polystyrene.
Key Quantitative Data on Buffer Stability
Table 1: Typical Shelf-Life and Degradation Modes of Common Buffers Under Various Storage Conditions
| Buffer (100 mM) | Recommended Storage Temp | Typical Stable Shelf-Life (Unpreserved) | Primary Degradation Mode | Impact on Nanoparticles |
|---|---|---|---|---|
| Phosphate (PBS) | 4°C, protected from light | 1-3 months | Microbial growth, pH drop (CO₂) | Aggregation, altered surface properties |
| Tris-HCl | 4°C, sealed | 3-6 months | pH rise (CO₂ absorption) | Loss of electrostatic stability for cationic particles |
| Citrate | -20°C (aliquoted) | 6-12 months | Microbial growth | Chelation changes affecting coated particles |
| HEPES | Room temp, sealed | >12 months | Photo-oxidation (generate H₂O₂) | Oxidative damage to surface ligands |
| Acetate | 4°C | 2-4 months | Microbial growth, evaporation | pH drop leading to aggregation near pI |
Table 2: Effect of Buffer Additive Degradation on Nanoparticle Hydrodynamic Diameter (DLS Measurement)
| Additive (Common Concentration) | Degradation Product | Storage Condition Leading to Change | Typical Change in PDI | Recommended Monitoring Method |
|---|---|---|---|---|
| Polysorbate 20 (0.01% w/v) | Free Fatty Acids | 40°C for 4 weeks (Stress) | Increase from 0.05 to >0.2 | RP-HPLC, Visual inspection |
| EDTA (0.1 mM) | Metal Complex Precipitation | Freeze-Thaw (5 cycles) | Slight increase (+0.03) | Light obscuration particle count |
| BSA (0.1% w/v) | Aggregates/Fragments | 4°C for 6 months | Bimodal distribution appears | SEC-HPLC, SDS-PAGE |
Experimental Protocols
Protocol 1: Accelerated Stability Study for Buffer Screening
Objective: To predict long-term nanoparticle stability in different buffers within 4 weeks.
Materials:
- Nanoparticle stock dispersion
- Candidate buffers (e.g., PBS, Tris, HEPES, Citrate) at identical pH and molarity
- Sterile vials
- Dynamic Light Scattering (DLS) instrument
- pH meter
- Refrigerated centrifuge
Methodology:
- Dialyze or dilute the nanoparticle stock into each candidate buffer. Filter (0.22 µm) if applicable.
- Aliquot each buffer-nanoparticle system into 3 vials per condition.
- Store one set at 4°C (control), one at 25°C (room temp), and one at 40°C (accelerated).
- At t=0, 1, 2, and 4 weeks, sample each condition.
- Measure and record: Hydrodynamic Diameter (Z-Avg), PDI, Zeta Potential, and pH.
- Visually inspect for precipitation or color change.
- Centrifuge a sample at mild speed (e.g., 5000 RCF for 10 min) and measure supernatant absorbance to assess sedimentation.
Protocol 2: Monitoring Buffer pH Under Simulated Usage Conditions
Objective: To quantify pH drift due to CO₂ absorption and evaporation in real-world lab use.
Materials:
- Buffer solution (e.g., 100 mM Tris, pH 7.4)
- Conical tubes (polypropylene vs. glass)
- Parafilm
- Micro-pH probe
- Analytical balance
Methodology:
- Prepare 50 mL of buffer, confirm initial pH (pH₀) and weight (W₀).
- Aliquot 10 mL into: (A) loosely capped poly tube, (B) tightly capped poly tube, (C) Parafilm-sealed poly tube, (D) tightly capped glass bottle.
- Place all containers on a lab bench at 25°C.
- Every 48 hours for 2 weeks: Weigh container, record mass loss (ΔW). Measure pH without stirring to avoid re-equilibration.
- Plot pH vs. time and ΔW vs. time. Correlate mass loss (evaporation) with pH change.
Visualizations
Diagram 1: Buffer Degradation Impact on Nanoparticle Stability
Diagram 2: Workflow for Long-Term Stability Study Design
The Scientist's Toolkit
Table 3: Essential Reagents & Materials for Nanoparticle Buffer Stability Studies
| Item | Function/Justification | Key Consideration for Long-Term Studies |
|---|---|---|
| HEPES Buffer | Excellent pH buffering in physiological range (7.2-8.2) with minimal temperature and CO₂ sensitivity. | Susceptible to photo-oxidation; must store in amber bottles or foil-wrapped. |
| Sterile Syringe Filters (0.22 µm PES) | For aseptic filtration of buffers to eliminate microbial contamination at baseline. | Low protein/buffer binding PES membrane preferred over cellulose acetate. |
| Sodium Azide (NaN₃) | Preservative to inhibit microbial growth in research samples (typically 0.02-0.05% w/v). | TOXIC. Not for in vivo use. Incompatible with azide-sensitive conjugates (e.g., alkyne groups). |
| Argon/N₂ Gas Canister | For sparging and blanketing oxygen-sensitive buffers or nanoparticle dispersions. | Use high-purity grade (>99.9%). Equip with sterile, hydrophobic vent filters on storage vials. |
| CO₂-Impermeable Vials | Vials made from Aclar, glass, or cyclic olefin copolymer to minimize pH drift. | More effective than standard polypropylene. Confirm compatibility with nanoparticles. |
| Dynamic Light Scattering (DLS) Cuvette | Disposable, sealed microcuvettes for repeated, contamination-free size measurements. | Prefer sealed, single-use cuvettes over open-top cells to prevent evaporation during measurement. |
| Micro pH Electrode | For accurate pH measurement of small volume samples (as low as 100 µL). | Essential for tracking drift without wasting precious nanoparticle samples. |
| Osmometer | To monitor ionic strength changes due to evaporation or degradation. | Colloid stability is highly sensitive to osmotic pressure changes. |
| HPLC with SEC Column | To quantify degradation of polymer stabilizers (e.g., PEG, Poloxamer) or protein excipients. | Provides direct evidence of excipient integrity loss before aggregation is visible. |
Benchmarking Buffer Performance: Validation Methods and Comparative Analysis
Troubleshooting Guides & FAQs
Q1: Why do I observe a large increase in hydrodynamic size (e.g., >50 nm shift) after diluting my nanoparticle sample in a new buffer for zeta potential measurement?
A: This is a classic sign of aggregation due to buffer incompatibility. The ionic strength or pH of the new buffer is likely destabilizing the nanoparticle surface, reducing electrostatic repulsion. Troubleshooting Steps:
- Check the pH difference: Ensure the dilution buffer pH is within ±1.0 unit of your nanoparticle's original dispersion buffer. A large shift can neutralize surface charge.
- Assess ionic strength: High salt concentration (>100 mM) can screen surface charges, leading to aggregation. Use a low-conductivity buffer (e.g., 1 mM KCl) or a buffer specifically matched to your nanoparticle's isoelectric point (pI).
- Protocol Correction: Always perform a serial dilution of the new buffer into your nanoparticle stock while monitoring size. If aggregation occurs, consider dialysis or tangential flow filtration for gradual buffer exchange.
Q2: My PDI is consistently high (>0.3) even with fresh, monodisperse standards. What could be the cause?
A: High PDI indicates a polydisperse population. Common causes are:
- Contaminated Cuvettes: Residual material from previous samples is a frequent culprit. Clean thoroughly with appropriate solvent and lint-free wipes.
- Non-Optimal Sample Concentration: A concentration outside the instrument's ideal range (typically 0.1-1 mg/mL for many nanoparticles) can cause unreliable correlation functions. Action: Dilute or concentrate your sample and re-measure.
- Presence of Aggregates or Debris: Filter your sample using a compatible syringe filter (e.g., 0.45 µm or 0.2 µm pore size) before measurement. Note: This may remove large aggregates, altering your results interpretively.
Q3: The zeta potential measurement shows near-zero (±5 mV) values, suggesting instability, but my sample remains visually clear with constant size. Why the discrepancy?
A: Your nanoparticles may be stabilized by steric, not electrostatic, forces. If coated with polymers (e.g., PEG, PVA), the zeta potential may be masked or low, yet the sample is stable. Interpretation: For sterically stabilized nanoparticles, confirm stability by monitoring hydrodynamic size over time (days/weeks) at storage conditions, not just zeta potential. A stable size confirms steric stabilization.
Q4: How do I accurately track nanoparticle concentration after buffer exchange or purification steps (e.g., dialysis, ultrafiltration)?
A: Concentration loss is common. Implement a quantitative method:
- UV-Vis Spectroscopy: Use the specific absorbance (extinction coefficient) of your nanoparticle's core (e.g., gold at 520 nm) or a dye label. Prepare a standard curve in the final buffer.
- Protocol - Concentration by UV-Vis:
- Measure the absorbance of your purified sample at the characteristic wavelength (λ_max).
- Compare against a standard curve of known concentrations of the same nanoparticle type in the identical buffer.
- Apply Beer-Lambert law (A = εcl) to calculate concentration (c), ensuring the absorbance reading is within the linear range of the instrument (typically A < 2).
Q5: The size distribution by intensity shows a single peak, but the distribution by volume shows multiple peaks. Which one should I trust?
A: The intensity distribution is most sensitive to larger particles (scales to diameter^6). A single peak here suggests no large aggregates. The volume distribution is derived and can be more intuitive but is less sensitive to small amounts of large aggregates. Action: Trust the intensity distribution for assessing aggregation. Use the volume distribution as a secondary check, but if discrepancies exist, the intensity-weighted data from a clean correlation function is primary.
Experimental Protocols for Key Metrics
Protocol 1: Dynamic Light Scattering (DLS) for Hydrodynamic Size & PDI
Objective: Measure the intensity-weighted mean hydrodynamic diameter (Z-average) and Polydispersity Index (PDI) of nanoparticles in suspension. Materials: DLS instrument (e.g., Malvern Zetasizer), disposable sizing cuvettes, syringe filters (0.2 µm), appropriate buffer. Procedure:
- Sample Preparation: Filter your nanoparticle dispersion through a 0.2 µm filter directly into a clean sizing cuvette to remove dust.
- Equipment Setup: Turn on instrument and equilibrate at 25°C for 10 minutes.
- Measurement: Place cuvette in the holder. Set parameters: material RI = as per nanoparticle core, dispersant RI/viscosity = as per buffer, measurement angle = 173° (backscatter).
- Run: Perform a minimum of 3 consecutive measurements of 10-15 sub-runs each.
- Analysis: Record the Z-average diameter and PDI. The PDI should be <0.2 for monodisperse samples. Ensure the correlation function decays smoothly.
Protocol 2: Electrophoretic Light Scattering (ELS) for Zeta Potential
Objective: Determine the zeta potential (surface charge) of nanoparticles. Materials: Zeta potential instrument (e.g., Malvern Zetasizer), disposable folded capillary cells, 1 mM KCl solution or desired low-conductivity buffer. Procedure:
- Sample Preparation: Dilute nanoparticles in 1 mM KCl or a buffer of conductivity <5 mS/cm to a final concentration of ~0.1 mg/mL. High salt causes heating and poor measurement.
- Cell Loading: Using a syringe, inject sample into the clean folded capillary cell, avoiding bubbles.
- Equipment Setup: Set temperature to 25°C, material properties as in Protocol 1.
- Measurement: Run the zeta potential measurement. The instrument will apply a voltage and measure particle velocity.
- Analysis: Record the mean zeta potential (in mV) from the phase analysis light scattering (PALS) measurement. Report the average of 5-10 measurements. A minimum of ±30 mV indicates good electrostatic stability.
Protocol 3: UV-Vis Spectroscopy for Concentration Tracking
Objective: Quantify nanoparticle concentration after synthesis or purification. Materials: UV-Vis spectrophotometer, quartz cuvettes, buffer for blanks. Procedure:
- Standard Curve Generation:
- Prepare 5-6 serial dilutions of a nanoparticle stock with known concentration (e.g., from elemental analysis) in the target buffer.
- Measure the absorbance (A) at the characteristic plasmon peak (for metal NPs) or a suitable wavelength.
- Plot A vs. concentration (c). Perform linear regression to obtain the slope (extinction coefficient ε, if path length l=1 cm).
- Unknown Sample Measurement:
- Dilute the unknown sample in the same buffer so its absorbance falls within the linear range of the standard curve (A ~0.1-1).
- Measure the absorbance at the same wavelength.
- Calculate concentration using the linear equation from the standard curve.
Table 1: Interpretation Guidelines for Key Metrics
| Metric | Ideal Value Range | Caution Range | Problem Range | Typical Cause in Buffer Studies |
|---|---|---|---|---|
| Hydrodynamic Size | Consistent with TEM/core size + coating. | Variation >10% from baseline. | Increase >50% or bimodal peak. | Buffer-induced aggregation or swelling. |
| Polydispersity Index (PDI) | <0.2 (Monodisperse) | 0.2 - 0.3 (Moderately polydisperse) | >0.3 (Polydisperse) | Poor synthesis, aggregation, or contaminated sample. |
| Zeta Potential (mV) | > ±30 (Highly stable) | ±20 to ±30 (Moderate stability) | ±5 to ±20 (Limited stability) | Ionic strength too high, pH near particle's pI. |
| Concentration Recovery | >90% after purification | 70-90% | <70% | Loss on filters, adsorption to tubing/vessels. |
Table 2: Recommended Buffer Properties for Nanoparticle Dispersion
| Buffer Type | Typical Ionic Strength | Best For Nanoparticles With | Key Consideration for Stability |
|---|---|---|---|
| 1 mM KCl | Very Low (~1.5 mS/cm) | Electrostatic stabilization; baseline zeta meas. | No buffering capacity, pH drifts easily. |
| 10 mM PBS | Moderate (~1.6 S/m) | Biological testing conditions. | High salt can screen charge; use diluted (1-2 mM). |
| 5 mM HEPES | Low | pH-sensitive particles (pH 7.0-8.0). | Good buffering at low ionic strength. |
| 1 mM Citrate | Low | Gold, silver nanoparticles (anionic stabilization). | Buffering range pH 3.0-6.2. |
Visualizations
The Scientist's Toolkit: Research Reagent Solutions
| Item | Function & Role in Buffer Stability Studies |
|---|---|
| Disposable Zeta Cells (Folded Capillary) | For zeta potential measurement. Ensures proper electric field formation and prevents electrode contamination. |
| Syringe Filters (0.2 µm, PVDF or Nylon) | For removing dust and large aggregates from DLS samples. Material must be compatible with organic/aqueous solvents. |
| Low-Volume Disposable Sizing Cuvettes | For DLS size/PDI measurement. Minimizes sample volume (as low as 12 µL) and reduces cleaning errors. |
| Dialysis Cassettes/Tubing (MWCO appropriate) | For gentle buffer exchange against a large volume of target buffer, minimizing aggregation shock. |
| Ultrafiltration Spin Concentrators | For rapid buffer exchange, concentration, and purification of nanoparticles based on size exclusion. |
| Certified Nanosphere Size Standards (e.g., 60 nm, 100 nm) | For validating DLS instrument performance and alignment before critical measurements. |
| pH/Conductivity Standard Solutions | For calibrating meters to ensure accuracy of buffer pH and ionic strength preparation. |
| UV-Vis Quartz Cuvettes (Micro-volume) | For accurate concentration measurement via absorbance, minimizing sample requirements. |
Technical Support Center & Troubleshooting Guides
FAQs and Troubleshooting for Nanoparticle Dispersion Stability Research
Q1: My nanoparticles are aggregating rapidly in PBS. What could be the cause and how can I troubleshoot this? A: PBS is a high ionic strength buffer (~150 mM NaCl). This can screen electrostatic repulsion between nanoparticles, leading to aggregation. Troubleshooting Steps: 1) Check the zeta potential of your nanoparticles in PBS. If it is between -10 mV and +10 mV, aggregation is likely. 2) Dilute the PBS to reduce ionic strength and re-measure stability. 3) Consider switching to a low-ionic-strength buffer like 5 mM HEPES or citrate, or include a steric stabilizer (e.g., 0.1% w/v PVP or PEG).
Q2: The pH of my Tris buffer drifts significantly during my 24-hour nanoparticle stability experiment at 4°C. Why? A: Tris has a high temperature coefficient (ΔpKa/ΔT ≈ -0.031 °C⁻¹). The pH changes with temperature. Troubleshooting Steps: 1) Always prepare and adjust the pH of Tris buffer at the exact temperature at which your experiment will be conducted. 2) For long-term or temperature-variable studies, use a buffer with a low temperature coefficient like HEPES (ΔpKa/ΔT ≈ -0.014 °C⁻¹). 3) Monitor pH in-line if possible, or use a pH-stable reference electrode for periodic checks.
Q3: I see inconsistent cellular uptake results when my nanoparticle formulation uses HEPES buffer. What should I investigate? A: HEPES can generate reactive oxygen species (ROS) under certain illumination conditions (e.g., microscopy), which can compromise cell viability and alter uptake mechanisms. Troubleshooting Steps: 1) Minimize light exposure of HEPES-buffered samples prior to and during the assay. 2) Include an ROS scavenger (e.g., 0.1 mM ascorbic acid) in the protocol as a control. 3) Validate findings by comparing uptake in PBS or Tris-buffered controls kept in the dark.
Q4: My citrate-buffered gold nanoparticles are stable at pH 6.0 but aggregate when I adjust to pH 7.4 for a biological assay. How can I transition pH without causing aggregation? A: Citrate acts as both a buffer and a stabilizing ligand. At higher pH, the citrate's carboxyl groups become more deprotonated, which can alter its binding affinity to the nanoparticle surface. Troubleshooting Steps: 1) Do not adjust pH by simple addition of NaOH. Instead, perform buffer exchange via dialysis or centrifugal filtration into a pre-made, identical ionic strength citrate buffer at pH 7.4. 2) Consider adding a secondary, non-interfering stabilizer (e.g., a thiolated PEG) before the pH transition to provide stability across the pH range.
Buffer Comparison Data for Nanoparticle Research
Table 1: Key Biochemical Properties of Common Buffers
| Buffer | Effective pH Range | pKa at 25°C | Key Ionic Strength Feature | Common Nanoparticle Compatibility Notes |
|---|---|---|---|---|
| Phosphate (PBS) | 6.1 - 7.5 | 7.21 (pKa₂) | High (~150 mM) | Can precipitate Ca²⁺/Mg²⁺; high salt may screen charge. |
| Tris | 7.0 - 9.0 | 8.06 | Variable (often low) | Temperature-sensitive; may react with aldehydes. |
| HEPES | 6.8 - 8.2 | 7.48 | Variable (often low) | Can form ROS in light; minimal metal complexation. |
| Citrate | 3.0 - 6.2 | 3.13, 4.76, 6.39 | Variable | Excellent chelator; can be a reducing/stabilizing agent. |
Table 2: Impact on Nanoparticle Stability & Experimental Parameters
| Buffer | Pros for Nanoparticle Research | Cons for Nanoparticle Research | Recommended Stability Test Protocol |
|---|---|---|---|
| PBS | Physiological; common for bio-assays. | High ionic strength promotes aggregation; phosphate can bind to surfaces. | Measure hydrodynamic size (DLS) and zeta potential over 24-48 hrs. |
| Tris | Low ionic strength options easy to prepare. | pH drifts with temperature; can interfere in surface conjugation chemistry. | Perform stability tests at a constant, controlled temperature. |
| HEPES | Good pH control in physiological range; low ion binding. | Photo-sensitivity risks ROS generation; more expensive. | Keep samples in dark; compare DLS size before/after light exposure. |
| Citrate | Excellent for synthesis & stabilization of metal NPs; chelating. | Narrow effective pH range; can be metabolized by cells. | Titrate pH while monitoring zeta potential to find optimal stability point. |
Experimental Protocols for Buffer Assessment in Dispersion Stability
Protocol 1: Standardized Nanoparticle Stability Screening Across Buffers
Objective: Systematically compare the colloidal stability of nanoparticles in four common buffers.
- Buffer Preparation: Prepare 10 mM solutions of PBS, Tris, HEPES, and Sodium Citrate. Adjust all buffers to pH 7.4 at 25°C. Filter through a 0.22 µm membrane.
- Nanoparticle Dispersion: Take a concentrated stock of your nanoparticles. Use centrifugal filtration (100kDa MWCO) to exchange the dispersant into each of the four buffers. Perform three wash cycles.
- Initial Characterization (T=0): For each buffer sample, measure: a) Hydrodynamic diameter (by DLS), b) Polydispersity Index (PDI), c) Zeta Potential.
- Incubation: Aliquot each sample into separate vials. Store one set at 4°C, one set at 25°C, and one set at 37°C. Protect from light.
- Time-Point Measurement: Repeat Step 3 at T = 1 hour, 4 hours, 24 hours, and 7 days.
- Analysis: A >10% increase in mean diameter or a significant shift in PDI (>0.1) indicates instability. Correlate with zeta potential changes.
Protocol 2: Buffer-Titration for Optimal pH Stability
Objective: Determine the most stable pH for nanoparticles within a buffer's range.
- Prepare a 20 mM stock solution of your chosen buffer (e.g., Citrate).
- Using a pH meter, prepare 1 mL aliquots at 0.5 pH unit intervals across the buffer's effective range (e.g., pH 3.0, 3.5, 4.0...6.0 for citrate).
- Add a fixed volume of concentrated nanoparticles to each aliquot. Mix gently.
- Immediately measure the zeta potential of each sample.
- Incubate samples for 2 hours at room temperature, then measure the hydrodynamic diameter of each.
- Identify Optimal pH: The pH that yields the highest magnitude zeta potential (|ζ| > |±30| mV is excellent) and shows no size increase after incubation is optimal for electrostatic stability.
Visualizations
Diagram 1: Buffer Selection Workflow for NP Stability
Title: Buffer Selection Workflow for NP Stability
Diagram 2: Mechanisms of Nanoparticle Instability in Buffers
Title: Mechanisms of Nanoparticle Instability in Buffers
The Scientist's Toolkit: Essential Reagents for Buffer Stability Studies
| Item | Function in Experiment | Key Consideration |
|---|---|---|
| Zeta Potential Cell | Holds sample for measuring surface charge (electrophoretic mobility). | Choose the correct cell material (e.g., dip cell vs. capillary) for your instrument and sample. |
| Disposable Size Filter (0.22 µm) | Removes dust and aggregates from buffer solutions prior to DLS. | Always filter buffers, not the nanoparticle sample, to avoid loss of material. |
| Amicon Ultra Centrifugal Filters | For buffer exchange and concentration of nanoparticle samples. | Select a molecular weight cutoff (MWCO) at least 10x smaller than the nanoparticle's hydrodynamic size. |
| pH Standard Buffers (4.01, 7.00, 10.01) | For precise calibration of the pH meter before adjusting buffer pH. | Calibrate at the same temperature as the buffer adjustment will be made. |
| UV-Vis Cuvettes (Micro) | For monitoring nanoparticle concentration and plasmon bands (for metal NPs). | Use the same cuvette for a time-series experiment to minimize instrumental variance. |
| Dynamic Light Scattering (DLS) Plates/Tubes | Low-volume, disposable containers for DLS size measurements. | Ensure material is compatible with your nanoparticles and does not cause static adhesion. |
Technical Support Center
Troubleshooting Guides & FAQs
Q1: My nanoparticles aggregate rapidly when I introduce a chelating agent like EDTA into my phosphate buffer. What is causing this and how can I prevent it? A: Chelating agents can strip stabilizing ions from nanoparticle surfaces. For metal oxide nanoparticles, EDTA may remove surface cations, compromising electrostatic stability. Solution: Use a lower concentration of chelating agent (e.g., 0.1 mM vs. 1 mM) or switch to a buffer-citrate composite system where citrate provides both buffering and milder chelation. Pre-incubate the nanoparticles with the chelating agent in buffer before adding other components to assess tolerance.
Q2: I am working with gold nanoparticles stabilized with citrate. When I add a reducing agent like DTT or TCEP to create a reducing environment, the color changes from red to blue, indicating aggregation. Why does this happen? A: Citrate on AuNP surfaces is mildly reducing. Adding strong reducing agents can destabilize the citrate layer, reducing electrostatic repulsion and enabling aggregation. Solution: (1) Use a gentler reducing agent like β-mercaptoethanol at lower concentrations (1-5 mM). (2) Consider switching to PEGylated or BSA-coated nanoparticles which are more resistant to reducing environments. (3) Ensure your buffer (e.g., HEPES) maintains pH accurately post-additive, as reducing agents can alter pH.
Q3: My nanoparticle dispersion in PBS is stable alone, but immediately precipitates when added to cell culture media containing 10% FBS. What is the issue? A: This is a classic case of protein corona-induced aggregation. The high ionic strength of PBS reduces electrostatic stabilization, allowing serum proteins to bridge nanoparticles. Solution: Disperse nanoparticles in a low-ionic-strength buffer like 5 mM HEPES or 2 mM Tris, pH 7.4, before introducing them to serum-containing media. This maintains a stronger surface charge (higher zeta potential) initially, leading to a more controlled protein corona formation and improved colloidal stability.
Q4: How do I choose between HEPES, Tris, and phosphate buffers when using chelating agents for nanoparticle dispersion? A: The choice is critical due to metal ion buffering capacity. See Table 1.
Table 1: Buffer Compatibility with Chelating Agents
| Buffer | Key Interaction with Chelators | Recommended Use Case | Typical Stable Concentration with 0.5 mM EDTA |
|---|---|---|---|
| Phosphate (PBS) | Binds divalent cations (Ca²⁺, Mg²⁺) itself; can compete with EDTA, causing unpredictable ion depletion. | Not recommended for strong chelation studies. Use only if system is characterized. | Variable; high risk of aggregation for cationic nanoparticles. |
| HEPES | Minimal metal ion binding. Allows chelator to function as intended without buffer competition. | Ideal for controlled studies on the effect of chelation on nanoparticle stability. | Up to 50 mM HEPES stable for most Au and polymeric NPs. |
| Tris | Can bind some metal ions, acting as a mild chelator itself, which may synergize with added chelators. | Useful for creating a gradient of chelating power. | Up to 20 mM Tris; test for pH drift over time. |
Q5: What is a reliable protocol for testing nanoparticle stability in a reducing buffer? A: Follow this detailed protocol:
- Materials: Nanoparticle stock, Reducing agent (e.g., DTT, TCEP), Degassed buffer (e.g., 10 mM HEPES, pH 7.4), Nitrogen gas, UV-Vis spectrophotometer, Dynamic Light Scattering (DLS) instrument.
- Method:
- Buffer Preparation: Degas HEPES buffer by bubbling with nitrogen for 15 minutes to prevent oxidation of the reducing agent. Purge the vial headspace with nitrogen.
- Reducing Agent Solution: Prepare a fresh, high-concentration stock of the reducing agent in the degassed buffer.
- Experiment Setup: In a sealable cuvette, mix nanoparticle dispersion with buffer to achieve standard optical density.
- Baseline Measurement: Immediately take UV-Vis absorbance (400-800 nm) and DLS (hydrodynamic diameter, PDI) readings.
- Reduction Initiation: Add the reducing agent stock directly in the cuvette to achieve the desired final concentration (e.g., 0, 1, 5, 10 mM). Seal and invert to mix.
- Kinetic Monitoring: Measure UV-Vis absorbance and DLS at defined time points (e.g., 1, 5, 15, 30, 60 min). Maintain sample under inert atmosphere if possible.
- Analysis: Plot absorbance at the plasmon peak (for metal NPs) or hydrodynamic diameter vs. time. An increase in peak width or diameter >10% indicates instability.
Experimental Workflow for Serum Stability Assessment
Title: Nanoparticle Serum Stability Test Workflow
The Scientist's Toolkit: Research Reagent Solutions
Table 2: Essential Materials for Nanoparticle Buffer Stability Studies
| Reagent/Material | Function | Key Consideration |
|---|---|---|
| HEPES Buffer | Provides stable pH (7.2-7.6) with minimal metal ion binding, ideal for chelation studies and physiological simulation. | Low temperature dependence; does not form radicals under light like Tris. |
| Ethylenediaminetetraacetic Acid (EDTA) | A strong chelating agent used to sequester divalent cations (Ca²⁺, Mg²⁺). | Can destabilize nanoparticles by stripping surface ions. Use at lowest effective concentration (0.01-0.1 mM). |
| Tris(2-carboxyethyl)phosphine (TCEP) | A strong, odorless reducing agent to maintain a reducing environment. | More stable than DTT; acidic, requires pH adjustment after addition to buffer. |
| Fetal Bovine Serum (FBS) | Provides a complex protein mixture to study protein corona formation and stability in biological media. | Batch variability is high. Use the same batch for a series of experiments. Heat-inactivate if required. |
| Zeta Potential Cell | A specialized cuvette for measuring electrophoretic mobility, which is converted to zeta potential—a key stability indicator. | Ensure it is clean and compatible with your nanoparticle material (e.g., not metal electrodes for reactive NPs). |
| 0.02 µm Filtered Buffers | Removes particulate contaminants that can act as nucleation sites for nanoparticle aggregation. | Critical step. Always filter buffers before use in stability studies. Use syringe filters compatible with your buffer. |
| Dialysis Tubing/Cassettes | For exchanging nanoparticles from a storage buffer into a specialized experimental buffer. | Choose appropriate molecular weight cut-off (MWCO) to retain nanoparticles while allowing small molecule exchange. |
FAQ: Isothermal Titration Calorimetry (ITC)
Q: We observe very small or negligible heat changes during our ITC titration of buffer components into nanoparticle (NP) dispersions. What could be the cause?
- A: This is common. The binding enthalpy (ΔH) for weak buffer-NP interactions (e.g., physisorption, hydration layer effects) is often very low. Ensure your NP concentration is high (e.g., 5-10 mg/mL) and use a buffer with a significant ionization enthalpy (e.g., Tris, phosphate) to amplify the signal. A control experiment titrating buffer into pure water is essential to subtract the background dilution heat.
Q: The ITC data fitting is poor or the stoichiometry (N) value is nonsensical (e.g., >>1000). How do we troubleshoot?
- A: An extremely high N value typically indicates non-specific, bulk interactions rather than defined binding sites. Re-evaluate your model; a "one-set-of-sites" model is often inappropriate. Consider using a model for surface adsorption or simply report the raw integrated heat per mole of injectant as a qualitative measure of interaction strength. Verify that your nanoparticle dispersion is monodisperse and stable throughout the experiment to avoid artifacts from aggregation.
Experimental Protocol: ITC for Buffer-NP Interaction Enthalpy
- Sample Preparation: Dialyze the nanoparticle dispersion extensively against the buffer of interest for 24-48 hours. Use the dialysate as the matching buffer for the ITC syringe and reference cell.
- Instrument Setup: Load the NP dispersion (e.g., 1.4 mL at 5 mg/mL) into the sample cell. Load the matched buffer into the syringe (typically 250-300 µL).
- Titration Parameters: Set temperature to 25°C. Use a titration scheme of 19-25 injections (2-4 µL each) with 180-240 seconds spacing between injections to allow for baseline equilibrium.
- Control Experiment: Perform an identical titration of buffer into dialysate (buffer-only) to measure the heat of dilution.
- Data Analysis: Subtract the control data from the sample data. Integrate the peak areas. Attempt fitting with appropriate models, but prioritize reporting the raw corrected injection heats if fitting is unreliable.
FAQ: Surface Plasmon Resonance (SPR)
Q: We cannot achieve a stable baseline or consistent immobilization of nanoparticles on the SPR sensor chip.
- A: NP immobilization is challenging. For gold NPs, use a bare gold chip and exploit chemisorption. For other NPs, use a hydrophobic chip (HPA) for lipid NPs or a carboxylated chip (CM5) for covalent amine coupling via EDC/NHS chemistry. A high flow rate (e.g., 50 µL/min) and a non-ionic surfactant (e.g., 0.005% Tween 20) in the running buffer can minimize non-specific binding and stabilize the baseline.
Q: The sensorgram during buffer injection shows a large bulk shift and/or a drifting signal, complicating data analysis.
- A: This is a classic buffer artifact. The bulk shift occurs due to differences in refractive index (RI) between the running buffer and the sample buffer. You must use the exact same buffer for running buffer, sample dilution, and injection blanks. Always perform a double referencing: subtract both the signal from a reference flow cell and the signal from a buffer-only injection.
Experimental Protocol: SPR for Buffer Exchange Analysis
- Chip Preparation: Immobilize a monolayer of nanoparticles on the sensor chip surface using an appropriate method (e.g., direct chemisorption for AuNPs).
- System Equilibration: Prime the system with the "Buffer A" (running buffer) until a stable baseline is achieved.
- Binding Experiment: Inject a solution of "Buffer B" (the test buffer) over the NP surface for 60-120 seconds at 30 µL/min.
- Dissociation: Switch back to Buffer A flow to monitor dissociation.
- Data Analysis: The response (RU) change during Buffer B injection represents the combined effect of specific buffer component adsorption and the bulk RI shift. The residual response after switching back to Buffer A indicates irreversible or slowly reversible binding of buffer components.
FAQ: Nuclear Magnetic Resonance (NMR)
Q: The ¹H NMR signals from our buffer (e.g., Tris) broaden or disappear upon addition of nanoparticles.
- A: Signal broadening indicates binding events that increase the correlation time (τc) of the buffer molecule, promoting spin-spin relaxation (increasing R2). This is direct evidence of interaction. Quantify the change in transverse relaxation rate (ΔR₂ = 1/ΔT₂). Ensure the NMR tube is not shaken vigorously to avoid introducing air bubbles, which can cause inhomogeneity.
Q: How do we distinguish between specific binding and general line broadening from solution viscosity or magnetic susceptibility?
- A: Perform a control experiment with a chemically inert reference compound (e.g., DSS or TMS) that does not interact with the NPs. If the reference signal also broadens proportionally, the effect is global (e.g., from increased viscosity or magnetic inhomogeneity). If only the buffer signals broaden, it confirms specific interaction.
Experimental Protocol: NMR Diffusion Ordered Spectroscopy (DOSY)
- Sample Preparation: Prepare 500 µL of buffer in D₂O (for lock). Acquire a standard ¹H spectrum. Then add a concentrated NP dispersion in the same buffer (in H₂O) to achieve a final NP concentration of ~1 mg/mL.
- DOSY Acquisition: Use a stimulated echo pulse sequence with bipolar gradient pulses for diffusion. Linearly vary the gradient strength over 16-32 steps.
- Processing: Process data to generate a 2D plot with ¹H chemical shift vs. diffusion coefficient.
- Analysis: Compare the apparent diffusion coefficients (D) of buffer peaks before and after NP addition. A significant decrease in D for buffer molecules indicates binding/association with the larger, slower-diffusing NPs.
Data Summary Table: Comparison of Techniques
| Technique | Measured Parameter | Information Gained | Sample Throughput | Typical NP Concentration |
|---|---|---|---|---|
| ITC | Heat flow (ΔH) | Binding enthalpy, stoichiometry (if defined), kinetics (k) | Low (1-2/day) | High (5-10 mg/mL) |
| SPR | Resonance angle shift (RU) | Association/dissociation rates (kₐ, kₑ), affinity (K_D), binding specificity | Medium (4-8/day) | Low (for immobilization) |
| NMR | Chemical shift (δ), Relaxation (R₂, R₁), Diffusion (D) | Binding site identification, dynamics, binding constant (K_A), hydrodynamic changes | High (for screening) | Low-Medium (0.1-2 mg/mL) |
The Scientist's Toolkit: Research Reagent Solutions
| Item | Function in Buffer-NP Studies |
|---|---|
| Dialysis Tubing (MWCO 10-50 kDa) | Ensures perfect buffer matching for ITC and NMR by removing unbound ions/ligands. |
| EDC/NHS Crosslinking Kit | For covalent immobilization of functionalized NPs onto SPR carboxylated sensor chips. |
| NMR Reference Compound (e.g., DSS) | Provides an internal standard for chemical shift referencing and a control for non-specific effects. |
| ITC Cleaning Solution | Specific detergent (e.g., Contrad 70) to remove nanoparticles and adsorbed buffer from the calorimetry cell. |
| SPR Sensor Chips (CM5, HPA, Gold) | CM5: General purpose for amine coupling. HPA: For lipid bilayers/lipid NPs. Gold: For thiol-gold chemistry. |
| Deuterated Buffer Salts | For preparing buffers in D₂O for NMR experiments, minimizing the solvent signal. |
Title: Decision Workflow for Buffer-NP Interaction Analysis
Title: Core Measurement Principles of ITC, SPR, and NMR
Troubleshooting Guide & FAQs
Q1: My nanoparticles aggregate immediately upon dilution in biological assay buffers, leading to inconsistent activity data. What could be the cause and how can I fix it?
A: This is a classic buffer-nanoparticle mismatch. The ionic strength or pH of your assay buffer is likely destabilizing the nanoparticle dispersion.
- Troubleshooting Steps:
- Characterize Stability: First, use Dynamic Light Scattering (DLS) to measure the hydrodynamic diameter and polydispersity index (PDI) of your nanoparticles in your storage buffer vs. your assay buffer. A significant increase in size and PDI confirms aggregation.
- Adjust Buffer Conditions: Systematically modify the assay buffer. Consider:
- Reducing ionic strength. High salt concentrations can screen surface charges, collapsing the electrostatic stabilization layer.
- Adjusting pH to move away from the nanoparticle's isoelectric point (pI) to maximize surface charge (zeta potential).
- Adding a steric stabilizer: Include a low concentration (e.g., 0.1% w/v) of a non-ionic surfactant (like Polysorbate 80) or polymer (like PEG) to provide steric hindrance against aggregation.
- Pre-equilibrate Nanoparticles: Pre-incubate (dialyze) the nanoparticles into the final assay buffer before adding them to the functional assay, rather than diluting them directly.
Q2: I observe good nanoparticle stability in buffer (by DLS), but my cellular uptake results are highly variable between replicates. What experimental factors should I check?
A: Discrepancy between colloidal stability and functional performance often points to interactions with assay components.
- Troubleshooting Steps:
- Check Serum Protein Interaction: If your uptake assay uses serum-containing media, proteins may adsorb to the nanoparticle surface (forming a protein corona), altering its effective size, charge, and cellular interaction. Perform DLS and zeta potential measurements after incubating nanoparticles in complete cell culture media for 1 hour.
- Control for Temperature: Uptake assays are done at 37°C, while stability is often checked at 25°C. Re-run DLS at 37°C to rule out temperature-induced aggregation.
- Verify Concentration Linearity: Ensure your measured uptake signal (e.g., fluorescence) is linear with the administered nanoparticle dose. Aggregation can cause non-linear dosing.
Q3: My binding affinity (e.g., SPR, ELISA) seems weaker than expected based on the ligand density on my nanoparticles. Could stability be an issue?
A: Yes. Instability during the binding assay can lead to misleading results.
- Troubleshooting Steps:
- Analyze Flow System Deposits: In Surface Plasmon Resonance (SPR), check for visible deposits or increased baseline drift in the flow cell, indicating nanoparticle adhesion/aggregation on the sensor chip.
- Optimize Running Buffer: The SPR or ELISA running buffer must maintain nanoparticle stability. Incorporate stabilizing agents (as in Q1) into the running buffer. Include a negative control surface to measure non-specific binding.
- Validate Ligand Accessibility: Aggregation may bury functional ligands. Use a soluble receptor or competitive ligand in solution to confirm that the drop in binding is due to avidity/steric effects from instability, not inactive ligands.
Q4: How do I choose the right buffer for screening nanoparticle stability relevant to functional assays?
A: Select buffers that mimic the key conditions of your downstream functional assays. A systematic screening approach is recommended.
Table 1: Buffer Selection & Stability Screening Parameters
| Functional Assay | Critical Buffer Parameters to Mimic | Key Stability Metric (DLS) | Acceptance Criteria for Proceeding | ||
|---|---|---|---|---|---|
| Binding (SPR, BLI) | Ionic strength, pH, often low surfactant | Hydrodynamic Diameter, PDI | Diameter change < 10%, PDI < 0.2 over assay duration | ||
| In Vitro Activity | Cell culture media (with/without serum), pH 7.4 | Zeta Potential, Size in media | Stable size in serum for ≥24h, significant surface charge ( | ζ | > 15 mV) in plain buffer |
| Cellular Uptake | Serum proteins, temperature (37°C), endosomal pH range (4.5-6.5) | Size & PDI in complete media at 37°C; stability at pH 5.5-6.5 | No aggregation in media at 37°C; may tolerate controlled aggregation at low pH |
Experimental Protocols
Protocol 1: Standardized Nanoparticle Stability Assessment by DLS Objective: To quantitatively assess colloidal stability of nanoparticles under varied buffer conditions. Materials: Nanoparticle dispersion, target buffers (e.g., PBS, HEPES, cell culture media), DLS instrument, disposable cuvettes. Procedure:
- Equilibration: Dialyze or dilute the nanoparticle stock into each target buffer to the desired working concentration. Incubate at the relevant temperature (25°C or 37°C) for 1 hour.
- Measurement: Load sample into a clean cuvette. Perform DLS measurement with appropriate instrument settings (e.g., 3 runs of 60 seconds each).
- Data Analysis: Record the intensity-weighted mean hydrodynamic diameter (Z-average) and the Polydispersity Index (PDI) from the instrument's software.
- Time Course: For critical assays, repeat measurements at 0, 1, 4, and 24 hours to monitor stability over time.
Protocol 2: Assessing Protein Corona Formation & Its Impact on Size/Zeta Potential Objective: To evaluate how serum proteins affect nanoparticle properties relevant to cellular uptake. Materials: Nanoparticle dispersion, complete cell culture media (e.g., DMEM + 10% FBS), ultracentrifuge, DLS/Zeta potential instrument. Procedure:
- Incubation: Mix nanoparticles with complete media at the intended concentration for cellular uptake studies. Incubate at 37°C for 1 hour.
- Isolation (Optional): For hard corona analysis, pellet the nanoparticles via ultracentrifugation (e.g., 100,000 x g, 1 hour). Carefully re-suspend the soft and hard corona-coated nanoparticles in a matched-ionic-strength buffer (e.g., 1X PBS).
- Measurement: Analyze the size distribution and zeta potential of the nanoparticle-media mixture (or the re-suspended pellet) using DLS and electrophoretic light scattering.
The Scientist's Toolkit: Research Reagent Solutions
Table 2: Essential Materials for Nanoparticle Stability & Functional Correlation Studies
| Item | Function & Rationale |
|---|---|
| Dynamic Light Scattering (DLS) Instrument | Measures hydrodynamic diameter and size distribution (PDI), the primary metrics for colloidal stability. |
| Zeta Potential Analyzer | Measures surface charge, predicting electrostatic stabilization and interaction with biological components. |
| Dialysis Tubing/Cassettes (various MWCO) | For buffer exchange of nanoparticles into assay-specific buffers without dilution or shear stress. |
| Non-ionic Surfactants (e.g., Polysorbate 80) | Added at low concentrations (0.01-0.1%) to assay buffers to provide steric stabilization against aggregation. |
| Biologically Relevant Buffers | HEPES (for binding assays), cell culture media (± serum), and endosomal-mimicking buffers (pH 5.5-6.5). |
| Size Exclusion Chromatography (SEC) Columns | To purify nanoparticles from aggregates or unencapsulated material before functional assays. |
| Fluorescent Dyes (e.g., Cy5, FITC) | For labeling nanoparticles to enable quantitative tracking in cellular uptake and binding assays. |
| Differential Scanning Calorimetry (DSC) | To assess the thermal stability of lipid-based or polymeric nanoparticle formulations. |
Diagrams
Title: Impact of Buffer Choice on Assay Performance
Title: Stability-Function Correlation Workflow
Conclusion
Selecting the optimal buffer is not a one-size-fits-all task but a critical, multi-parameter optimization process integral to nanoparticle development. A successful strategy integrates foundational colloidal science with systematic screening, proactive troubleshooting, and rigorous validation. By understanding the interplay between nanoparticle surface properties and buffer components—ionic strength, pH, and excipients—researchers can prevent instability and ensure reliable performance. Future directions point toward intelligent, application-tailored buffers that address challenges in complex biological media and enable next-generation therapeutic nanocarriers with enhanced targeting, circulation, and efficacy. Mastering buffer selection is, therefore, a fundamental step in translating innovative nanomaterials from the bench to the clinic.