Beyond PEG: Advanced Strategies for Stabilizing Nanoparticles in Drug Delivery Applications
This article provides a comprehensive overview of Polyethylene Glycol (PEG)-free stabilization strategies for nanoparticles, addressing the emerging need to overcome limitations associated with PEG, such as anti-PEG immune responses and...
Beyond PEG: Advanced Strategies for Stabilizing Nanoparticles in Drug Delivery Applications
Abstract
This article provides a comprehensive overview of Polyethylene Glycol (PEG)-free stabilization strategies for nanoparticles, addressing the emerging need to overcome limitations associated with PEG, such as anti-PEG immune responses and accelerated blood clearance (ABC). It begins by exploring the fundamental motivations for moving beyond PEG. It then details a range of methodological alternatives, including polymer-based, biomimetic, and small-molecule coatings, along with their applications in drug delivery. The article further addresses critical challenges in formulation optimization, reproducibility, and scaling. Finally, it offers a comparative analysis of these novel strategies, evaluating their performance against traditional PEGylation in terms of stability, pharmacokinetics, immunogenicity, and efficacy, equipping researchers and drug development professionals with a modern toolkit for next-generation nanomedicine design.
Why Move Beyond PEG? Understanding the Limitations and the Drive for Innovation
The Rise and Reign of PEGylation in Nanomedicine
Application Notes
Note 1: PEGylation for Prolonged Systemic Circulation
PEGylation creates a hydrophilic, steric barrier around nanoparticles (NPs), reducing opsonization and reticuloendothelial system (RES) clearance. This increases systemic circulation half-life, enhancing drug bioavailability at target sites.
| Parameter | Non-PEGylated NPs | PEGylated NPs (5kDa Linear) | PEGylated NPs (20kDa Branched) |
|---|---|---|---|
| Plasma Half-life (hr) | 0.5 - 2 | 10 - 15 | 20 - 40 |
| Liver/Spleen Uptake (%ID/g) | 60 - 85 | 20 - 40 | 10 - 25 |
| Tumor Accumulation (%ID/g) | 1 - 3 | 3 - 8 | 4 - 10 |
Note 2: Mitigating Anti-PEG Immunity
Recent studies show the prevalence of anti-PEG antibodies (APA) in up to 40-70% of the population due to prior exposure, leading to accelerated blood clearance (ABC) and potential hypersensitivity. This is a primary driver for researching PEG-free alternatives.
| Anti-PEG Antibody Type | Prevalence Estimate (%) | Primary Consequence |
|---|---|---|
| IgM (pre-existing) | ~40% | Accelerated Blood Clearance (ABC) of dose 2+ |
| IgG | ~20-30% | Reduced efficacy, potential anaphylactoid reactions |
Detailed Protocols
Protocol 1: Conjugation of mPEG-NHS Ester to Amine-Functionalized Nanoparticles
Objective: Covalently attach methoxy-PEG-N-hydroxysuccinimide ester (mPEG-NHS) to polymeric nanoparticles (e.g., PLGA-NH2) to create a sterically stabilized formulation.
Materials (Research Reagent Solutions):
| Reagent/Material | Function/Role |
|---|---|
| PLGA-NH2 NPs (100 nm) | Core nanoparticle with surface amine groups for conjugation. |
| mPEG-NHS Ester (5 kDa) | Activated PEG derivative; NHS ester reacts with primary amines. |
| DMSO (Anhydrous) | Solvent for dissolving mPEG-NHS ester. |
| Borate Buffer (0.1 M, pH 8.5) | Alkaline pH optimizes nucleophilic attack by amine. |
| Sephadex G-25 PD-10 Column | Size-exclusion chromatography for removing unconjugated PEG. |
| TNBSA Assay Kit | Quantifies remaining surface amines to calculate conjugation efficiency. |
Procedure:
- Nanoparticle Preparation: Purify amine-functionalized PLGA nanoparticles via centrifugation (15,000 x g, 20 min) and resuspend in Borate Buffer to a final concentration of 5 mg/mL.
- PEG Solution: Dissolve mPEG-NHS ester in anhydrous DMSO to 50 mg/mL immediately before use.
- Conjugation: Add the mPEG-NHS solution dropwise to the nanoparticle suspension under gentle vortexing to achieve a 10:1 molar ratio (PEG:estimated surface amine). React for 2 hours at room temperature with mild stirring.
- Purification: Pass the reaction mixture through a Sephadex G-25 column equilibrated with PBS (pH 7.4). Collect the eluted nanoparticle fraction (first colored/opalescent band).
- Characterization:
- Size & Zeta Potential: Use DLS. Successful PEGylation typically increases hydrodynamic diameter by 5-15 nm and shifts zeta potential towards neutral.
- Conjugation Efficiency: Perform TNBSA assay on pre- and post-conjugation samples per kit instructions. Calculate efficiency:
[1 - (Post-conj Amines / Pre-conj Amines)] * 100%.
Protocol 2: In Vivo Assessment of Accelerated Blood Clearance (ABC) Phenomenon
Objective: Evaluate the induction of anti-PEG antibodies and their impact on the pharmacokinetics of a second PEGylated nanoparticle dose.
Materials (Research Reagent Solutions):
| Reagent/Material | Function/Role |
|---|---|
| DiR-labeled PEGylated Liposomes | Near-infrared fluorescent tracer for blood and organ quantification. |
| PBS (Control) | Vehicle for the first ("priming") injection in control group. |
| ELISA Kit for Anti-PEG IgM/IgG | Quantifies antibody titers in serum post-priming. |
| IVIS Spectrum Imaging System | Enables real-time fluorescence imaging for blood clearance and biodistribution. |
| C57BL/6 Mice | Common inbred mouse strain for immunology and PK studies. |
Procedure:
- Priming Dose: Administer a single intravenous injection (Day 0) of PEGylated liposomes (0.1 μmol phospholipid/mouse) to the test group (n=5). Administer an equal volume of PBS to the control group.
- Serum Collection: On Day 7, collect retro-orbital blood serum. Clarify by centrifugation (5,000 x g, 10 min).
- Antibody Titer Measurement: Analyze serum samples using the anti-PEG IgM/IgG ELISA kit as per manufacturer's protocol.
- Challenging Dose: On Day 7, 4 hours post-serum collection, administer a second, DiR-labeled dose of PEGylated liposomes to all mice.
- Pharmacokinetic Imaging: Anesthetize mice and image using the IVIS system at 1 min, 30 min, 2h, 8h, and 24h post-injection. Quantify fluorescence intensity in the region of interest (ROI) over the heart/blood pool.
- Biodistribution: At 24h, euthanize mice, collect major organs (liver, spleen, kidneys), image ex vivo, and quantify fluorescence.
- Data Analysis: Plot blood fluorescence vs. time. The ABC effect is confirmed in the primed group by a significantly faster decay curve and elevated liver/spleen uptake compared to controls.
Diagrams
Diagram 1: The ABC Phenomenon Pathway
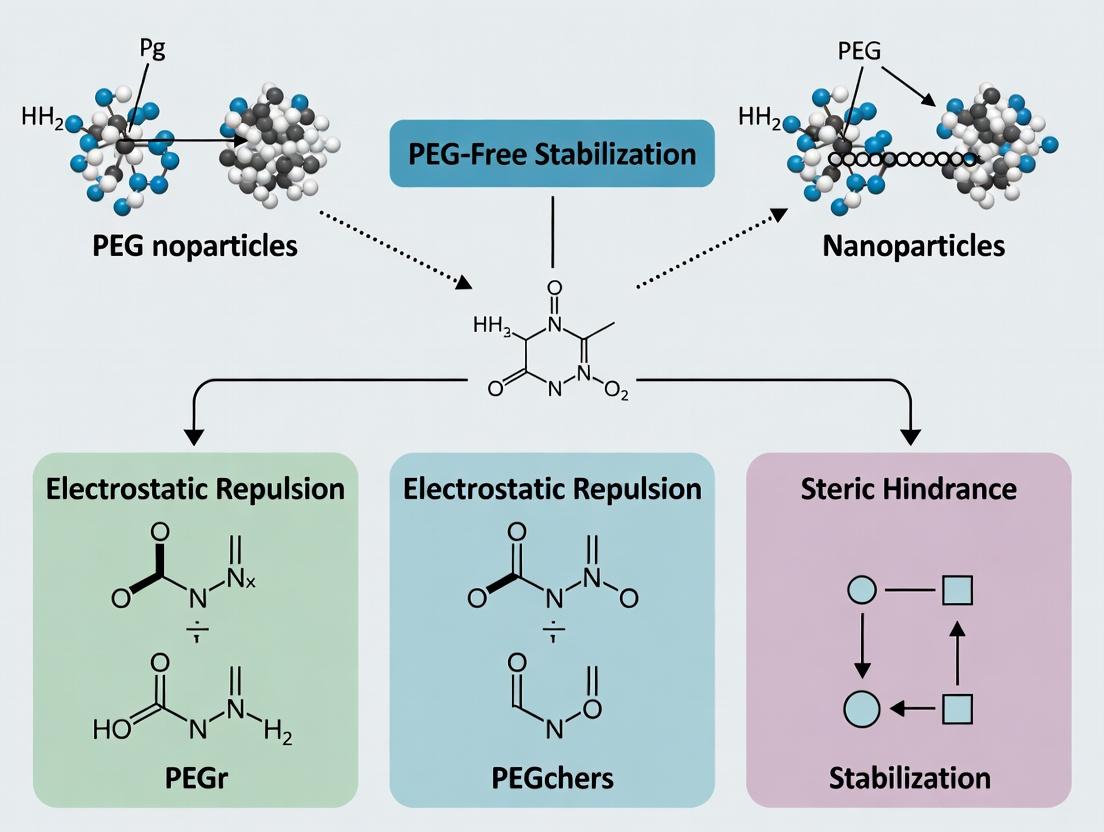
Diagram 2: Stabilization Strategies for Stealth NPs
1. Introduction and Rationale Within the broader pursuit of PEG-free nanoparticle stabilization, understanding the immunogenicity of polyethylene glycol (PEG) is paramount. PEGylation, long considered the gold standard for confercing stealth properties and prolonging circulation, is compromised by pre-existing and induced anti-PEG antibodies. This immunity triggers the Accelerated Blood Clearance (ABC) phenomenon, where subsequent doses of PEGylated nanoparticles are rapidly eliminated by the immune system, undermining therapeutic efficacy and raising safety concerns. These application notes detail protocols for detecting anti-PEG immunity and quantifying the ABC phenomenon, providing essential tools for developing next-generation, non-immunogenic delivery systems.
2. Key Experimental Protocols
2.1. Protocol: Detection and Quantification of Anti-PEG IgM/IgG Antibodies by ELISA
Purpose: To measure pre-existing or induced anti-PEG antibody titers in serum/plasma.
Materials:
- Coating Antigen: Biotin-PEG-Lipid or methoxy-PEG-amine.
- Blocking Buffer: 1% (w/v) bovine serum albumin (BSA) in PBS.
- Serum Samples: Test sera, positive control (from PEG-immunized animals), negative control (naïve animal sera).
- Detection Antibodies: Horseradish peroxidase (HRP)-conjugated goat anti-mouse/anti-human IgM (μ-chain specific) and IgG (Fc-specific).
- Substrate: TMB (3,3’,5,5’-Tetramethylbenzidine) solution.
- Stop Solution: 1M H₂SO₄.
Procedure:
- Coating: Dilute biotin-PEG-lipid in PBS to 1 µg/mL. Add 100 µL/well to a streptavidin-coated plate (or directly coat with mPEG-amine). Incubate overnight at 4°C.
- Washing: Wash plate 3x with PBS containing 0.05% Tween-20 (PBST).
- Blocking: Add 200 µL/well of blocking buffer. Incubate for 1 hour at room temperature (RT). Wash 3x.
- Sample Incubation: Serially dilute serum samples (1:100 starting, then 4-fold dilutions) in blocking buffer. Add 100 µL/well. Incubate for 2 hours at RT. Wash 5x.
- Detection Antibody Incubation: Add 100 µL/well of HRP-conjugated anti-IgM or anti-IgG antibody (diluted per manufacturer’s instructions). Incubate for 1 hour at RT. Wash 5x.
- Signal Development: Add 100 µL/well of TMB substrate. Incubate for 5-15 minutes in the dark.
- Stop & Read: Add 50 µL/well of stop solution. Measure absorbance immediately at 450 nm with a reference at 570 nm.
- Analysis: Determine endpoint titer, defined as the highest serum dilution giving an absorbance value greater than the mean + 3 standard deviations of the negative control.
2.2. Protocol: In Vivo Assessment of the ABC Phenomenon
Purpose: To evaluate the accelerated blood clearance of a second dose of PEGylated nanoparticles.
Materials:
- Animals: BALB/c mice or Sprague-Dawley rats.
- Nanoparticles: PEGylated liposomes or lipid nanoparticles (LNPs), radiolabeled (e.g., with ³H-cholesteryl hexadecyl ether) or fluorescently labeled (e.g., DiR or Cy5.5).
- Instrumentation: Gamma counter, IVIS imaging system, or HPLC for fluorescence quantification.
Procedure:
- Priming Dose Administration: Inject a cohort of animals intravenously with a priming dose of PEGylated nanoparticles (e.g., 1 µmol phospholipid/kg for liposomes). A control cohort receives PBS.
- Waiting Period: Wait 5-7 days to allow for anti-PEG IgM production (critical for the classic ABC effect).
- Challenging Dose Administration: On day 7, administer a second (challenging) dose of radiolabeled/fluorescently labeled PEGylated nanoparticles at the same dose.
- Blood Pharmacokinetics: Collect blood samples from the tail vein or retro-orbital plexus at fixed time points post-injection (e.g., 0.083, 0.25, 0.5, 1, 2, 4, 8, 24 hours).
- Sample Processing: Lyse blood samples and measure radioactivity or fluorescence intensity.
- Data Analysis: Calculate the percentage of injected dose (%ID) remaining in blood over time. Compare pharmacokinetic parameters (AUC, t₁/₂) between primed and non-primed groups. A significantly reduced AUC and t₁/₂ in the primed group confirms the ABC phenomenon.
3. Data Presentation
Table 1: Representative Data on Anti-PEG Antibody Prevalence and Impact
| Parameter | Human Population (Reported Range) | Impact on Pharmacokinetics (Animal Models) |
|---|---|---|
| Pre-existing Anti-PEG IgM | 15% - 40% | >2-fold reduction in AUC of 2nd dose (t₁/₂ < 10% of control) |
| Pre-existing Anti-PEG IgG | 0.2% - 25% | >5-fold reduction in AUC of 1st dose |
| Induced Anti-PEG IgM (post-dose) | Titers >1:1000 common | Triggers strong ABC effect for subsequent doses |
| ABC Phenomenon Magnitude | N/A (in vivo measure) | AUC reduction of 50-90% for 2nd dose (Day 7) vs. 1st dose |
Table 2: Comparison of Key Assay Parameters
| Assay | Target | Key Readout | Typical Turnaround Time | Critical Reagent |
|---|---|---|---|---|
| Direct ELISA | Anti-PEG IgM/IgG | Endpoint Titer | 1 Day | PEG-coating antigen |
| ABC Pharmacokinetics | Accelerated Clearance | Blood AUC, t₁/₂ | 1 Week | Radiolabeled/Fluorophore-labeled PEG-NP |
| Flow Cytometry | Anti-PEG mediated NP binding | % Positive B cells/Phagocytes | 4-6 Hours | Fluorescent PEG-NP |
| Surface Plasmon Resonance | Antibody Affinity (Ka/ Kd) | Binding Kinetics | 2-3 Hours | PEG-chip surface |
4. Visualizations
Title: Mechanism of the IgM-Mediated ABC Phenomenon
Title: ELISA Workflow for Anti-PEG Antibody Detection
5. The Scientist's Toolkit: Research Reagent Solutions
| Item | Function & Application |
|---|---|
| Biotin-PEG-Lipids (DSG-PEG₂₀₀₀-Biotin) | Essential for stable, oriented coating in ELISA to capture anti-PEG antibodies with high sensitivity. |
| HRP-conjugated Anti-IgM (μ-chain specific) | Critical detection antibody for identifying the IgM isotype responsible for the classic ABC phenomenon. |
| ³H-Cholesteryl Hexadecyl Ether or DiR Fluorophore | Robust, non-exchangeable labels for in vivo tracking of nanoparticle pharmacokinetics and biodistribution. |
| PEG-Specific Monoclonal Antibodies (e.g., AGP4) | Positive controls for ELISA and flow cytometry; tools for blocking studies and method validation. |
| PEG-Free Blocking Agents (e.g., Recombinant Albumin) | Crucial for reducing background in immunoassays without introducing PEG contaminants from standard BSA. |
| Size-Exclusion Chromatography Columns | For purifying and characterizing PEGylated nanoparticles pre- and post-serum incubation to assess opsonization. |
Application Notes: Quantifying PEG Drawbacks
Chemical Instability Under Oxidative Stress
Polyethylene glycol (PEG) chains are susceptible to oxidative degradation, particularly at the ether linkages, leading to backbone cleavage. This compromises the steric stabilization of nanoparticles (NPs) and can trigger accelerated blood clearance (ABC). The degradation is catalyzed by transition metals and reactive oxygen species (ROS) present in vivo.
Table 1: Quantifying PEG Degradation Under Physiological Conditions
| Condition / Parameter | Value / Observation | Measurement Method | Reference Year |
|---|---|---|---|
| Degradation in presence of H2O2 | Up to 40% MW reduction in 24h (for PEG-5k) | SEC-MALS | 2023 |
| Critical ROS concentration | > 50 µM H2O2 induces significant chain scission | Fluorescence assay (coumarin derivative) | 2022 |
| pH-dependent hydrolysis | Half-life < 7 days at pH 4.5; > 30 days at pH 7.4 | NMR monitoring of end-group formation | 2024 |
| Impact on NP circulation half-life | Reduction from 18h (fresh) to 6h (pre-oxidized) in murine model | Pharmacokinetic profiling | 2023 |
Non-Biodegradability and Long-Term Accumulation
PEG is not metabolized in the human body. High-MW PEG (>40 kDa) exhibits limited renal clearance, leading to vacuolation in tissues like the liver and spleen, raising safety concerns for chronic therapy.
Table 2: Accumulation Profiles of PEG from Nanoparticles
| Organ / Tissue | Accumulation (%ID/g) after 30 days (PEG-20k coated NPs) | Detection Method | Key Histological Finding |
|---|---|---|---|
| Liver | 3.2 ± 0.7 | LC-MS/MS of homogenates | Cytoplasmic vacuolation |
| Spleen | 5.1 ± 1.2 | LC-MS/MS of homogenates | Macrophage engorgement |
| Kidney | 0.8 ± 0.3 | LC-MS/MS of homogenates | Minimal change |
| Renal Clearance Threshold | < 40 kDa for efficient elimination | Urinary excretion studies | N/A |
Steric Hindrance and Reduced Target Binding
The dense, hydrophilic PEG corona can create a physical barrier that impedes the interaction of surface-coupled targeting ligands (e.g., antibodies, peptides) with their cognate receptors.
Table 3: Impact of PEG Density on Target Association Kinetics
| PEG Density (chains/nm²) | Association Rate (k_on) Relative to Non-PEGylated | Ligand Type | Assay System |
|---|---|---|---|
| 0.5 | 85% | Anti-HER2 Fab | SPR |
| 1.0 | 45% | RGD peptide | Flow cytometry (cell binding) |
| 2.0 | 12% | ApoE-derived peptide | Fluorescence quenching |
| >3.0 | <5% | Multiple | Various |
Experimental Protocols
Protocol: Assessing PEG Oxidative Degradation on NPs
Title: Quantifying ROS-Induced PEG Chain Scission on Nanoparticle Surfaces. Objective: To measure the rate of PEG degradation on coated NPs under simulated oxidative stress.
Materials:
- PEGylated nanoparticles (e.g., PLGA-PEG).
- 10 mM Hydrogen peroxide (H2O2) in PBS.
- 100 µM FeSO₄ catalyst solution.
- Dichloromethane (DCM).
- Size Exclusion Chromatography with Multi-Angle Light Scattering (SEC-MALS) system.
- Dynamic Light Scattering (DLS) / Zeta potential instrument.
Procedure:
- Incubation: Divide NP suspension (1 mg/mL in PBS) into aliquots. Add H2O2 (final conc. 1 mM) and FeSO₄ (final conc. 10 µM) to the test group. Control group receives PBS only.
- Conditions: Incubate at 37°C with gentle shaking for 0, 6, 12, 24, and 48 hours. Protect from light.
- Recovery of Polymer: At each time point, lyophilize a 1 mL aliquot. Dissolve the dry powder in DCM to dissolve the polymer coat and precipitate the core (if insoluble). Centrifuge at 14,000 rpm for 15 min.
- Analysis: Collect supernatant and evaporate DCM. Redissolve polymer residue in THF for SEC-MALS analysis. Compare the PEG molecular weight distribution to time zero.
- NP Characterization: In parallel, analyze another aliquot by DLS and zeta potential to correlate degradation with changes in hydrodynamic diameter and surface charge.
Protocol: Evaluating Ligand Accessibility on Densely PEGylated NPs
Title: Measuring Steric Hindrance via Competitive Cell Binding Assay. Objective: To quantify the masking effect of PEG on a surface-conjugated targeting ligand.
Materials:
- NPs with conjugated fluorescent dye (e.g., Cy5) and targeting ligand (e.g., cRGD).
- NPs with dye and non-targeting control ligand.
- Target-positive cells (e.g., U87-MG glioblastoma cells).
- Free targeting ligand (cRGD peptide) in excess.
- Flow cytometer.
Procedure:
- Cell Preparation: Seed cells in 12-well plates and culture to 80% confluence.
- Competitive Binding: Prepare two sets of samples:
- Test Group: Cells + Targeted NPs (constant concentration).
- Competition Group: Cells + Targeted NPs + 100-fold molar excess of free cRGD peptide.
- Incubation: Incubate all groups at 4°C for 90 minutes to inhibit endocytosis.
- Washing: Wash cells three times with ice-cold PBS to remove unbound NPs.
- Analysis: Detach cells gently and analyze by flow cytometry. Measure the median fluorescence intensity (MFI) of the cell population.
- Calculation:
- Specific Binding = MFI(Test Group) - MFI(Competition Group).
- Compare specific binding across NP formulations with varying PEG density. A significant drop indicates steric hindrance.
Diagrams
Title: PEG Degradation Pathway Leading to Accelerated Clearance
Title: Steric Hindrance Blocks Ligand-Receptor Binding
The Scientist's Toolkit: Research Reagent Solutions
Table 4: Essential Materials for Studying PEG Drawbacks
| Item / Reagent | Function / Relevance | Example Product/Catalog |
|---|---|---|
| PEG-Degrading Reagents | To simulate in vivo oxidative stress for stability studies. | Hydrogen Peroxide (H2O2), 2,2'-Azobis(2-amidinopropane) dihydrochloride (AAPH, ROS inducer). |
| Size Exclusion Chromatography with MALS (SEC-MALS) | Precisely measures PEG molecular weight distribution pre- and post-degradation. | Wyatt miniDAWN TREOS or similar system. |
| Isothermal Titration Calorimetry (ITC) | Quantifies binding thermodynamics between ligand-decorated NPs and target proteins, directly measuring steric hindrance impact. | Malvern MicroCal PEAQ-ITC. |
| PEGylated & Non-PEGylated Control Nanoparticles | Essential benchmarks for comparative studies on stability, clearance, and targeting. | Commercial PLGA-PEG/PLGA NPs (e.g., from Nanosoft Polymers) or synthesized in-house. |
| Reactive Oxygen Species (ROS) Detection Probe | Quantifies local ROS concentration in NP environments. | CellROX Deep Red Reagent (Thermo Fisher, C10422). |
| LC-MS/MS Standards for PEG Quantification | Enables precise tracking of PEG accumulation in tissues. | Isotopically labeled PEG standards (e.g., PEG-6000-d14). |
Within the broader thesis on advanced nanoparticle (NP) formulations, the move towards PEG-free stabilization arises from limitations of poly(ethylene glycol) (PEG), including the generation of anti-PEG antibodies, accelerated blood clearance (ABC) phenomenon, and potential hypersensitivity. PEG-free strategies aim to achieve equivalent or superior in vitro and in vivo performance through alternative surface chemistries and materials.
Core Objectives of PEG-Free Stabilization
The primary objectives guiding research in this field are:
- Achieve Long-Circulating Pharmacokinetics: Mimic or exceed PEG's ability to minimize opsonization and extend systemic half-life.
- Eliminate Immunogenicity: Avoid immune recognition and the ABC effect associated with anti-PEG antibodies.
- Maintain or Enhance Targetability: Enable facile conjugation of targeting ligands without steric hindrance.
- Ensure Biocompatibility and Safety: Utilize materials with favorable toxicity profiles and clear metabolic pathways.
- Provide Functional Versatility: Allow for responsive (e.g., pH-, redox-sensitive) design for controlled release.
- Ensure Scalability and Reproducibility: Utilize chemistries amenable to good manufacturing practice (GMP) production.
Desired Physicochemical and Biological Properties
A successful PEG-free stabilizer must impart a specific set of properties to the nanoparticle core.
Table 1: Desired Properties of PEG-Free Stabilized Nanoparticles
| Property Category | Specific Desired Property | Quantitative Target / Ideal Characteristic |
|---|---|---|
| Physicochemical | Hydrodynamic Diameter | Typically 20-150 nm, with narrow PDI (<0.2) |
| Surface Charge (Zeta Potential) | Near-neutral or slightly negative (-10 to +10 mV) in physiological pH | |
| Colloidal Stability | No aggregation in PBS, serum, or over 1-6 month storage at 4-25°C | |
| Drug Loading Capacity | >5% w/w (for drug-loaded NPs); high encapsulation efficiency (>80%) | |
| Biological | Protein Corona Minimization | Low total serum protein adsorption; specific "stealth" corona profile |
| Cellular Uptake (Non-Targeted) | Reduced uptake by macrophages (e.g., <50% of uncoated NPs in RAW 264.7 cells) | |
| In Vivo Circulation Half-life (t1/2) | >10 hours in murine models (species-dependent) | |
| Immunogenicity | No detectable specific antibody response against the stabilizer | |
| Biodegradability/Toxicity | No significant in vitro cytotoxicity (>80% cell viability at therapeutic conc.); in vivo clearance via renal/hepatic routes |
Featured Strategy: Poly(2-oxazoline) (POx) Stabilization Protocol
Poly(2-methyl-2-oxazoline) (PMeOx) and Poly(2-ethyl-2-oxazoline) (PEtOx) are prominent hydrophilic polymers investigated as PEG alternatives due to their protein-repellent properties and presumed low immunogenicity.
Application Note AN-001: Preparation and Characterization of POx-Stabilized Poly(lactic-co-glycolic acid) (PLGA) Nanoparticles via Nanoprecipitation.
Research Reagent Solutions Toolkit
Table 2: Essential Materials for POx-PLGA NP Formulation
| Item | Function | Example Product/Specification |
|---|---|---|
| PLGA (50:50) | Biodegradable polymer core for drug encapsulation/attachment. | Lactel, MW: 10-30 kDa, ester end-group. |
| Poly(2-methyl-2-oxazoline)-b-Poly(D,L-lactide) (PMOx-PDLLA) Diblock Copolymer | Amphiphilic stabilizer; PDLLA anchors to PLGA core, PMOx provides stealth corona. | Custom synthesis (e.g., ARCO Polymer), MW PMOx: 5 kDa, PDLLA: 5 kDa. |
| Acetone (HPLC Grade) | Water-miscible organic solvent for nanoprecipitation. | Sigma-Aldrich, ≥99.9%. |
| Phosphate Buffered Saline (PBS), pH 7.4 | Aqueous phase for nanoprecipitation; dispersion medium for final NPs. | 1X, without calcium or magnesium. |
| Dialysis Membrane (MWCO: 12-14 kDa) | Removal of organic solvent and unencapsulated material. | Spectra/Por 4. |
| Dynamic Light Scattering (DLS) / Zetasizer | Measurement of hydrodynamic size, PDI, and zeta potential. | Malvern Panalytical Zetasizer Nano ZS. |
| Size Exclusion Chromatography (SEC) Columns | Purification of NPs from free polymer/aggregates. | Sepharose CL-4B columns. |
Detailed Experimental Protocol
Protocol P-01: Preparation of POx-stabilized PLGA NPs.
- Polymer Solution Preparation: Dissolve 50 mg of PLGA and 25 mg of PMOx-PDLLA diblock copolymer in 5 mL of acetone. Stir magnetically at room temperature (RT) until fully dissolved (~1 hour).
- Nanoprecipitation: Using a syringe pump, add the organic polymer solution dropwise (rate: 1 mL/min) into 20 mL of magnetically stirred PBS (pH 7.4) in a glass vial.
- Organic Solvent Removal: Transfer the resulting milky suspension to a dialysis membrane (MWCO 12-14 kDa). Dialyze against 2 L of PBS for 24 hours, changing the buffer three times.
- Purification: Pass the dialyzed suspension through a Sepharose CL-4B size exclusion column equilibrated with PBS to remove any free polymer or small aggregates. Collect the opalescent fraction containing the nanoparticles.
- Concentration (Optional): Use centrifugal filtration devices (e.g., Amicon Ultra, 100 kDa MWCO) to concentrate the NP dispersion to a desired volume (e.g., 2 mL).
- Characterization:
- Size & PDI: Dilute 20 µL of NP dispersion in 1 mL of PBS. Analyze by DLS.
- Zeta Potential: Dilute 50 µL of NPs in 1 mL of 1 mM KCl. Measure using a Zetasizer.
- Concentration: Determine via dry weight measurement or a colorimetric total protein assay (if protein-loaded).
Protocol P-02: In Vitro Serum Stability Assessment.
- Incubate 100 µL of NP dispersion (1 mg/mL polymer) with 400 µL of fetal bovine serum (FBS) or human serum at 37°C.
- At pre-determined time points (0, 1, 4, 8, 24 h), withdraw 50 µL aliquots.
- Immediately dilute the aliquot in 950 µL of PBS and analyze the hydrodynamic diameter by DLS.
- Interpretation: A shift in mean size >20% or a PDI increase >0.1 indicates significant aggregation due to protein adsorption.
Key Signaling Pathways in Nanoparticle Immune Recognition
Understanding the pathways involved in immune recognition is critical for designing effective stealth strategies.
Pathways of Nanoparticle Immune Recognition and Clearance
Experimental Workflow for Evaluating PEG-Free Stabilizers
A systematic workflow is required to benchmark new stabilizers against PEGylated standards.
Workflow for PEG-Free Stabilizer Evaluation
Within the ongoing research paradigm shift towards PEG-free nanoparticle (NP) stabilization strategies, mastering core physicochemical principles is paramount. This guide details the application of steric stabilization via non-PEG polymers, the engineering of robust surface hydration layers, and the deliberate modulation of the protein corona to achieve stealth and targeting. These principles form the foundational thesis that synthetic control over the nano-bio interface, without relying on poly(ethylene glycol) (PEG), is critical for the next generation of therapeutic nanocarriers.
Application Notes
Principle: Steric Stabilization with Non-PEG Polymers
Steric stabilization prevents NP aggregation and opsonization by creating a physical and energetic barrier through grafted polymer chains.
- Key Polymers: Poly(2-oxazoline)s (POx), Poly(glycerol) (PG), Poly(vinyl pyrrolidone) (PVP), Zwitterionic polymers (e.g., poly(carboxybetaine)).
- Mechanism: The conformational entropy of hydrated, flexible polymer brushes generates repulsive forces as NPs approach.
- Application Goal: Achieve long circulation times analogous to, or exceeding, PEGylated NPs.
Principle: Engineering Surface Hydration
Strong surface-bound water layers act as a physical and thermodynamic barrier against protein adsorption.
- Key Strategies: Use zwitterionic materials (e.g., phosphorylcholine, sulfobetaine) or highly hydrophilic hydroxyl-rich polymers (e.g., PG).
- Mechanism: These materials form tightly bound, ordered water layers via electrostatic or hydrogen-bonding interactions. Displacing this water requires significant energy, preventing protein adhesion.
- Application Goal: Create "ultra-low fouling" surfaces to minimize non-specific protein adsorption.
Principle: Protein Corona Modulation
The deliberate pre-formation or functionalization to recruit a specific protein corona can dictate biological fate.
- Key Strategies: "Pre-coating" with dysopsonins (e.g., albumin, clusterin) or engineering surfaces to selectively adsorb targeting apolipoproteins (e.g., for blood-brain barrier crossing).
- Mechanism: Actively shaping the corona composition to display specific biological identities, moving from passive stealth to active targeting via endogenous proteins.
- Application Goal: Transform the corona from a liability into a targeting and stealth mechanism.
Table 1: Comparative Efficacy of PEG-Free Stabilization Strategies
| Stabilization Principle | Exemplary Material | Key Metric (in vivo) | Reported Value Range (vs. PEG Control) | Primary Advantage |
|---|---|---|---|---|
| Steric Stabilization | Poly(2-methyl-2-oxazoline) (PMeOx) | Blood Circulation Half-life (in mice) | 1.2x to 2.0x longer | Reduced anti-polymer immunity |
| Surface Hydration | Poly(carboxybetaine methacrylate) (PCB) | Plasma Protein Adsorption (% reduction) | 70-90% reduction | Exceptional fouling resistance |
| Corona Modulation | Albumin Pre-coating | Macrophage Uptake (% reduction in vitro) | 60-80% reduction | Utilizes endogenous stealth pathways |
Experimental Protocols
Protocol 1: Synthesis and Characterization of POx-Stabilized Gold Nanoparticles (AuNPs)
Objective: To synthesize AuNPs sterically stabilized by a poly(2-ethyl-2-oxazoline) (PEtOx) brush and characterize their stability. Materials:
- Gold(III) chloride trihydrate (HAuCl₄·3H₂O)
- PEtOx-thiol (Mn ≈ 5,000 Da)
- Sodium borohydride (NaBH₄)
- Phosphate Buffered Saline (PBS, 1x, pH 7.4)
- Fetal Bovine Serum (FBS)
Procedure:
- Synthesis: Dissolve HAuCl₄ (0.25 mM) and PEtOx-thiol (0.05 mM) in 10 mL deionized water under stirring. Chill the solution in an ice bath for 30 min.
- Reduction: Rapidly add 1 mL of a fresh, ice-cold NaBH₄ solution (10 mM) under vigorous stirring. The solution color changes to deep red. Continue stirring on ice for 2 hours.
- Purification: Purify the NPs via centrifugal filtration (100 kDa MWCO) at 8,000 x g for 15 min, washing three times with DI water. Resuspend in PBS.
- Characterization:
- Size/PDI: Measure hydrodynamic diameter and polydispersity index (PDI) via Dynamic Light Scattering (DLS) in PBS and 50% (v/v) FBS/PBS.
- Stability Test: Monitor diameter and absorbance at λmax over 7 days in PBS and 50% FBS at 4°C and 37°C.
- Critical Aggregation Concentration (CAC): Perform a turbidimetric assay by diluting NPs in increasing concentrations of NaCl. Measure absorbance at 600 nm. CAC is the inflection point where aggregation begins.
Protocol 2: Assessing Protein Corona Formation and Composition
Objective: To isolate and identify proteins adsorbed onto zwitterionic PCB-coated NPs from human plasma. Materials:
- PCB-coated Polystyrene NPs (100 nm)
- PEG-coated NPs (control)
- Human platelet-poor plasma
- Centrifugal filters (100 kDa MWCO)
- Laemmli buffer, SDS-PAGE gel
- Mass spectrometry (LC-MS/MS) facilities
Procedure:
- Incubation: Incubate 1 mg of each NP type with 1 mL of human plasma (diluted 1:1 with PBS) for 1 hour at 37°C with gentle rotation.
- Corona Isolation: Pellet the NP-protein complexes by centrifugation at 21,000 x g for 30 min at 4°C. Carefully remove the supernatant.
- Washing: Gently wash the pellet three times with 1 mL PBS to remove loosely bound proteins. Resuspend the final pellet in 100 µL PBS.
- Analysis:
- SDS-PAGE: Mix 50 µL of corona-coated NPs with Laemmli buffer, boil, and run on a 4-20% gradient gel. Stain with Coomassie Blue to visualize protein bands.
- LC-MS/MS Preparation: Elute proteins from the remaining 50 µL of NPs using 1% SDS solution. Precipitate proteins using acetone, digest with trypsin, and analyze via LC-MS/MS. Use label-free quantification to compare relative protein abundances.
The Scientist's Toolkit: Key Research Reagent Solutions
| Item | Function in PEG-Free Stabilization Research |
|---|---|
| Poly(2-oxazoline) with thiol/dopamine terminus | Provides "grafting-to" anchor for creating steric polymer brushes on Au, Fe₃O₄, or other surfaces. |
| Zwitterionic monomer (e.g., CBMA, SBMA) | For "grafting-from" polymerization via ATRP/RAFT to create ultra-low fouling hydration layers. |
| Size-exclusion centrifugal filters (e.g., 100 kDa MWCO) | Essential for purifying NPs and isolating hard protein corona complexes from biological fluids. |
| Dynamic/Static Light Scattering (DLS/SLS) Instrument | Measures hydrodynamic diameter, PDI, and aggregation state in real-time under physiological conditions. |
| Surface Plasmon Resonance (SPR) or Quartz Crystal Microbalance (QCM-D) | Quantifies real-time adsorption kinetics of proteins or polymers onto model flat surfaces. |
| Dysopsonin Proteins (Human Albumin, Clusterin) | For pre-coating experiments to investigate active corona modulation strategies. |
Visualizations
Steric stabilization by a polymer brush.
Hydration layer as a thermodynamic barrier.
Protein corona analysis and modulation workflow.
Toolkit for Innovation: A Guide to Leading PEG-Free Stabilization Techniques
Within the drive to develop PEG-free nanoparticle (NP) stabilization strategies, concerns over PEG's immunogenicity and accelerated blood clearance (ABC) phenomenon have necessitated the exploration of robust alternatives. This article provides application notes and detailed protocols for four leading polymer candidates: Poly(2-oxazoline)s (POx), Poly(glycerol) (PG), Poly(amino acids) (PAA), and Poly(N-vinylpyrrolidone) (PVP). Their performance is evaluated in the context of creating stealth, stable, and biocompatible nanocarriers for drug delivery.
Application Notes and Quantitative Comparison
Table 1: Key Physicochemical and Biological Properties of PEG Alternatives
| Polymer | Typical Mn Range (kDa) | Hydrophilicity (log P) | Protein Adsorption Reduction (%) vs. PEG* | Critical Flocculation Temperature (°C) | In Vivo Circulation Half-life (h) |
|---|---|---|---|---|---|
| Poly(2-methyl-2-oxazoline) (PMeOx) | 5 - 50 | -1.2 to -0.8 | 85-95 | >100 | 15-25 |
| Poly(ethylenimine)-co-Poly(glycerol) (PEI-PG) | 10 - 100 | -2.1 to -1.5 | 80-90 | N/A | 10-20 |
| Poly(glutamic acid) (PGA) | 20 - 200 | Variable (pH-dep.) | 70-85 | N/A | 8-15 |
| Poly(N-vinylpyrrolidone) (PVP) | 10 - 50 | -0.7 to -0.3 | 75-88 | 95-150 | 5-12 |
| PEG (Reference) | 2 - 40 | -1.5 to -0.9 | 100 (Ref.) | ~100 | 10-20 (non-pre-exposed) |
Data from in vitro fibrinogen/albumin adsorption assays on coated surfaces. *Half-life data for polymeric NPs in murine models; varies significantly with NP core, coating density, and molecular weight.
Table 2: Application Suitability Matrix for Nanoparticle Functionalization
| Polymer | Ease of Conjugation (Scale: 1-5) | pH Sensitivity | Thermo-responsiveness | Primary Application Strengths |
|---|---|---|---|---|
| POx (PMeOx) | 4 (Living pol.) | No | Yes (lower crit. sol. temp.) | Long-circulating stealth NPs, drug conjugates |
| Hyperbranched PG | 5 (Mult. OH groups) | No | No | Multivalent ligand attachment, dendritic architectures |
| PAA (PGA, PLGA) | 3 (Side-chain mod.) | Yes (carboxyl) | No | Stimuli-responsive release, polyplexes for nucleic acids |
| PVP | 2 (Radical polym.) | No | Yes (UCST) | Stabilizer in precipitation/nanoprecipitation processes |
Detailed Experimental Protocols
Protocol 1: Synthesis of PMeOx-coated Gold Nanoparticles (AuNPs) via "Grafting-to" Approach
Objective: To create PEG-free, stealth AuNPs using PMeOx-thiol for enhanced stability in biological media.
Materials: HAuCl4·3H2, sodium citrate, α-amino-ω-mercapto PMeOx (SH-PMeOx, 10 kDa), Millipore water, PBS (pH 7.4), 10 kDa MWCO dialysis tubing.
Procedure:
- AuNP Synthesis: Prepare citrate-capped AuNPs (15 nm) by standard Turkevich method. Heat 100 mL of 1 mM HAuCl4 to boiling. Rapidly add 3.5 mL of 38.8 mM sodium citrate under stirring. Continue heating until color changes to deep red (~10 min). Cool to room temperature.
- Polymer Ligand Exchange: To 10 mL of as-synthesized AuNPs (≈10 nM), add a 500-fold molar excess of SH-PMeOx (relative to AuNP surface atoms). Stir gently at room temperature for 48 hours protected from light.
- Purification: Transfer the reaction mixture to dialysis tubing. Dialyze against 2 L of deionized water for 24 hours, changing water every 8 hours, to remove free polymer and citrate.
- Characterization: Measure hydrodynamic diameter and zeta potential via DLS. Confirm coating via FTIR (C=O stretch at 1640 cm-1) and a negative shift in zeta potential (citrate: ≈ -35 mV; PMeOx: ≈ -10 mV).
- Stability Test: Incubate coated NPs in PBS with 10% FBS at 37°C. Monitor DLS size over 7 days. Aggregation (>20% size increase) indicates coating failure.
Protocol 2: Formulation of siRNA Polyplexes with Poly(L-lysine)-b-Poly(L-glutamic acid) (PLL-b-PGA)
Objective: To prepare and characterize pH-responsive, PEG-free polyplex nanoparticles for intracellular siRNA delivery.
Materials: PLL50-b-PGA30 block copolymer (subscripts denote D.P.), siRNA (e.g., anti-GFP), Nuclease-free water, HEPES buffer (20 mM, pH 7.4), Sodium acetate buffer (25 mM, pH 5.0), SYBR Gold dye.
Procedure:
- Polymer and siRNA Preparation: Dissolve PLL-b-PGA in nuclease-free water at 1 mg/mL. Dilute siRNA to 0.1 mg/mL in 20 mM HEPES buffer (pH 7.4).
- Polyplex Formation: Prepare polyplexes at an N/P ratio of 8 (amine (N) in PLL to phosphate (P) in siRNA). Rapidly mix the polymer solution into the equal volume of siRNA solution under vigorous vortexing. Incubate for 30 min at room temperature.
- Size and Charge Measurement: Dilute polyplexes 1:10 in HEPES buffer (pH 7.4) and sodium acetate buffer (pH 5.0). Measure hydrodynamic diameter (expected: 80-120 nm) and zeta potential (expected: +10 to +15 mV at pH 7.4, may increase at pH 5.0) by DLS.
- Gel Retardation Assay: Load polyplex samples (containing 0.5 µg siRNA) onto a 1% agarose gel. Run at 100 V for 30 min in TAE buffer. Stain with SYBR Gold and visualize under UV. Complete siRNA retention in the well indicates successful complexation.
- Serum Stability: Incubate polyplexes in 50% FBS at 37°C. Analyze samples by gel electrophoresis at 0, 1, 2, and 4 hours to assess siRNA protection.
Protocol 3: Evaluating the "Stealth" Effect via Protein Corona Analysis
Objective: To quantitatively compare protein adsorption from human plasma onto NPs coated with different polymers.
Materials: NPs (PLGA core) coated with PEG, PMeOx, PG, or PVP (all ~100 nm), Human platelet-poor plasma (PPP), PBS, 2x Laemmli buffer, SDS-PAGE system (4-20% gradient gel), Coomassie Blue stain.
Procedure:
- Incubation with Plasma: Normalize all NP formulations to identical surface area (e.g., 1 m2/mL) in PBS. Mix 100 µL of each NP suspension with 400 µL of human PPP. Incubate at 37°C for 1 hour with gentle rotation.
- Hard Corona Isolation: Centrifuge the NP-protein complexes at 21,000 x g for 30 min at 4°C. Carefully discard supernatant. Wash pellet three times with 500 µL cold PBS, repeating centrifugation.
- Protein Elution: Resuspend the final pellet in 50 µL of 2x Laemmli buffer. Heat at 95°C for 10 min to denature and elute proteins from NPs.
- Analysis: Load 20 µL per sample onto SDS-PAGE. Run gel at constant voltage (120 V). Stain with Coomassie Blue for 1 hour, then destain. Image gel. The intensity and pattern of protein bands inversely correlate with the stealth efficacy of the polymer coating.
Signaling and Workflow Diagrams
Title: Mechanism of PEG ABC vs. Alternative Polymer Strategy
Title: General Workflow for PEG-free NP Stabilization
The Scientist's Toolkit: Research Reagent Solutions
Table 3: Essential Materials for PEG-free Nanoparticle Research
| Reagent/Material | Typical Supplier Examples | Function in Research |
|---|---|---|
| α-Amino-ω-mercapto Poly(2-methyl-2-oxazoline) (SH-PMeOx) | Seriox, PolymersGmbH | Thiol-terminated POx for grafting-to gold, quantum dots, or maleimide-functionalized surfaces. |
| Hyperbranched Polyglycerol (hPG) with succinimidyl carbonate groups | NanoSynthons, GlymoSphere | Multi-arm, hydroxyl-rich scaffold for high-density drug/ligand conjugation via amine coupling. |
| Poly(α,L-glutamic acid) (PGA, sodium salt) | Alamanda, Sigma-Aldrich | pH-responsive anionic polymer for polyelectrolyte complexes or creating charge-conversional NPs. |
| Poly(N-vinylpyrrolidone) (PVP K30, ~40 kDa) | BASF, Sigma-Aldrich | Classical steric stabilizer in nanoprecipitation and emulsion methods; forms hydrogen bonds. |
| Diblock Copolymer (PLL-b-PGA) | Custom synthesis (e.g., Biomatik) | Model pH-responsive, PEG-free polycation for nucleic acid delivery and membrane disruption studies. |
| PLGA (50:50, Acid-terminated) | Lactel (Evonik), Sigma-Aldrich | Standard biodegradable polymer core for testing alternative surface coatings. |
| Maleimide-functionalized PLGA (Mal-PLGA) | Nanosoft Polymers | Enables direct conjugation of thiolated polymers (e.g., SH-POx, SH-PG) to NP surface during formulation. |
| Size-exclusion Chromatography (SEC) Columns, e.g., Superose 6 Increase | Cytiva | Critical for analyzing and purifying polymer-coated NPs and assessing aggregation state. |
Within the broader research thesis exploring PEG-free stabilization strategies for nanoparticles (NPs), biomimetic and bio-inspired coatings offer a promising alternative to traditional polyethylene glycol (PEG). Concerns over PEG immunogenicity and accelerated blood clearance (ABC phenomenon) drive the need for stealth coatings that mimic biological structures. This document details application notes and protocols for three principal classes: zwitterionic polymers, peptides, and proteins, which confer stability through hydration, specific molecular recognition, or self-assembly.
Application Notes & Comparative Data
Zwitterionic Polymers
These polymers, bearing both positive and negative charges on the same monomer unit, create a superhydrophilic surface via electrostatically induced hydration, effectively resisting non-specific protein adsorption.
Table 1: Key Zwitterionic Polymers for NP Coating
| Polymer | Structure | Key Property | Typical NP Core | Reported Hydrodynamic Size (nm) | Reference PDI | In Vivo Circulation Half-life (vs. PEGylated Control) |
|---|---|---|---|---|---|---|
| Poly(carboxybetaine) (PCB) | Quaternary ammonium & carboxylate | pH-insensitive neutrality | PLGA, Gold, Liposomes | 80-120 | <0.1 | Comparable or longer (e.g., ~24h in mice) |
| Poly(sulfobetaine) (PSB) | Quaternary ammonium & sulfonate | Strong hydration, salt sensitivity | Silica, Quantum Dots | 30-100 | 0.05-0.15 | Slightly shorter, but superior anti-fouling |
| Poly(phosphorylcholine) (MPC) | Mimics cell membrane | Biocompatibility, low immunogenicity | Polymeric NPs, Iron Oxide | 70-150 | <0.2 | Significantly longer in some models (e.g., +40%) |
Peptide-Based Coatings
Short peptide sequences provide a modular approach for stabilization, often through helical structures presenting charged or polar residues, or via specific binding domains.
Table 2: Exemplary Stabilizing Peptide Sequences
| Peptide Name/Sequence | Proposed Mechanism | NP Core | Primary Advantage | Critical Findings |
|---|---|---|---|---|
| EKEKEKE (Glu-Lys repeat) | Forms amphiphilic β-sheet, creates hydrophilic surface | Gold, Silver | Prevents aggregation in high salt | Coated AuNPs stable in 1M NaCl for >1 month. |
| AEAEAKAK (Ala-Glu-Ala-Lys repeat) | Forms α-helix, charge distribution mimics zwitterion | Graphene Oxide, Liposomes | Reduces macrophage uptake by >60% vs. bare NP. | |
| Cysteine-terminated peptides | Thiol anchor + functional sequence (e.g., GGG) | Quantum Dots, AuNPs | Provides oriented coating, improves quantum yield. |
Protein-Based Coatings
Natural proteins (e.g., albumin) or engineered variants (e.g., elastin-like polypeptides) offer biocompatibility and potential for active targeting.
Table 3: Protein Coatings for NP Stealth
| Protein | Source/Type | Coating Method | NP Core | Key Functional Outcome |
|---|---|---|---|---|
| Human Serum Albumin (HSA) | Natural | Adsorption, Covalent conjugation, In situ growth | PLGA, Paclitaxel, Gold | Evades RES, leverages endogenous transport pathways (e.g., gp60). |
| Elastin-Like Polypeptides (ELPs) | Recombinant (VPGXG)n | Thermal phase transition-driven assembly | Drug nanocrystals, Liposomes | "Smart" coacervation coating, enhances tumor accumulation. |
| Ferritin | Natural cage protein | Disassembly/reassembly encapsulation | Iron Oxide, Quantum Dots | Provides ultra-uniform size and inherent tumor targeting. |
Detailed Experimental Protocols
Protocol: "Grafting-To" Coating of PLGA Nanoparticles with Poly(carboxybetaine) (PCB)
Objective: Achieve a stable, PEG-free zwitterionic shell on biodegradable polymeric NPs.
Materials:
- PLGA (50:50, 10 kDa)
- Poly(carboxybetaine acrylamide) (PCB-AAm, 20 kDa, -COOH terminated)
- N-(3-Dimethylaminopropyl)-N'-ethylcarbodiimide (EDC), N-Hydroxysuccinimide (NHS)
- Dichloromethane (DCM), Polyvinyl alcohol (PVA)
- Phosphate Buffered Saline (PBS, pH 7.4), Dialysis tubing (MWCO 50kDa)
Procedure:
- NP Fabrication: Prepare PLGA NPs (150-200 nm) via standard single-emulsion solvent evaporation. Dissolve 100 mg PLGA in 3 mL DCM. Emulsify in 20 mL of 2% (w/v) PVA using a probe sonicator (70% amplitude, 60s). Stir overnight to evaporate DCM. Wash 3x by centrifugation (15,000 rpm, 20 min).
- PCB Activation: Dissolve 50 mg PCB-AAm and 10 mg NHS in 5 mL PBS. Add 15 mg EDC. React for 15 min at RT to activate terminal carboxylates.
- Conjugation: Re-disperse the washed PLGA NP pellet (~50 mg solids) into the activated PCB solution. React for 4h at RT with gentle stirring.
- Purification: Dialyze the reaction mixture against 2L of DI water for 24h (change water 3x) to remove unreacted polymer and by-products.
- Characterization: Measure hydrodynamic diameter and ζ-potential via DLS. Confirm coating via XPS (increase in N1s signal) or a quantitative TNBS assay for residual surface amines.
Protocol: Stabilizing Gold Nanoparticles with EKEKEKE Peptide
Objective: Create a stable, peptide-coated AuNP formulation resistant to aggregation.
Materials:
- Chloroauric acid (HAuCl₄·3H₂O)
- Trisodium citrate dihydrate
- Synthetic EKEKEKE peptide (TFA salt, >95% purity)
- Saline solution (1.0 M NaCl)
- Ultrapure water (18.2 MΩ·cm)
Procedure:
- Citrate-AuNP Synthesis: Prepare ~15 nm cores via the Turkevich method. Heat 100 mL of 1 mM HAuCl₄ to boiling. Rapidly add 3.5 mL of 38.8 mM trisodium citrate under vigorous stirring. Continue heating/stirring for 15 min until color stabilizes to deep red. Cool to RT.
- Peptide Ligand Exchange: Add 1 mL of 10 mM EKEKEKE peptide solution (in water) to 9 mL of as-synthesized AuNPs. Sonicate for 10 min, then incubate overnight at 4°C.
- Purification: Centrifuge at 14,000 rpm for 30 min. Discard supernatant and re-disperse the soft pellet in 10 mL water. Repeat 2x to remove citrate and unbound peptide.
- Stability Test: Dilute coated and uncoated (citrate) AuNPs 1:1 with 2.0 M NaCl to achieve a final 1.0 M NaCl concentration. Monitor UV-Vis absorbance at 520 nm and 650 nm for 60 min. A stable coating maintains the SPR peak at ~520 nm without a redshift or broadening.
Visualization Diagrams
Diagram 1: PEG-Free Coating Strategies for NP Stealth (76 chars)
Diagram 2: Generic Workflow for Coating NPs with Biomimetic Layers (74 chars)
The Scientist's Toolkit: Research Reagent Solutions
Table 4: Essential Materials for Biomimetic Coating Research
| Reagent/Material | Supplier Examples | Function in Research |
|---|---|---|
| Poly(carboxybetaine methacrylate) (PCBMA) | Sigma-Aldrich, Polymer Source | Benchmark zwitterionic polymer for "grafting-from" or "grafting-to" coating strategies. |
| DSPE-PCB Lipid | Avanti Polar Lipids, CordenPharma | Enables direct incorporation of zwitterionic coatings into lipid bilayer of liposomes. |
| Custom Stabilizing Peptides | Genscript, CPC Scientific | Provides modular, sequence-defined coatings; often require TFA removal post-synthesis. |
| Recombinant HSA (rHSA) | Sigma-Aldrich, Novozymes | Ensures consistent, pathogen-free protein corona studies and coating formulations. |
| EDC / NHS Crosslinker Kit | Thermo Fisher, ProteoChem | Standard chemistry for covalent conjugation of polymers/peptides to NP surface functional groups. |
| ζ-Potential & DLS Reference Standards | Malvern Panalytical | Essential for calibrating and validating dynamic light scattering and electrophoretic mobility measurements. |
| Pre-formed PLGA NPs | Phosphorex, nanoComposix | Useful as a standardized core for screening different coating efficiencies and methodologies. |
Small Molecule Surfactants and Lipid-Based Stabilization Strategies
Within the broader thesis on PEG-free stabilization strategies for nanoparticles, this application note details the use of small molecule surfactants and alternative lipid architectures. As concerns over PEG immunogenicity and accelerated blood clearance (ABC) grow, these strategies offer viable, non-polymeric alternatives for stabilizing liposomal, solid lipid, and nanoemulsion formulations for drug delivery.
Quantitative Comparison of PEG-Free Surfactants
The efficacy of stabilization is quantified by measuring particle size (via DLS), polydispersity index (PDI), zeta potential, and stability under stress conditions (e.g., serum incubation, freeze-thaw cycles).
Table 1: Performance Metrics of Common PEG-Free Surfactants in Lipid Nanoparticle Formulations
| Surfactant / Lipid Class | Typical Conc. Range (mol%) | Mean Hydrodynamic Diameter (nm) ± SD | PDI (after 30 days, 4°C) | Zeta Potential (mV) ± SD | Serum Stability (\% Size Increase, 24h, 37°C) |
|---|---|---|---|---|---|
| Polysorbate 80 | 0.5-2.0% (w/v) | 112.4 ± 3.2 | 0.12 ± 0.02 | -2.1 ± 0.5 | 18.5 |
| DMPC/Cholesterol (Base) | 55/45 mol% | 150.8 ± 5.6 | 0.18 ± 0.03 | -0.5 ± 0.8 | 85.7 |
| DMPC/Chol/Polyglycerol | 50/40/10 mol% | 145.2 ± 4.1 | 0.15 ± 0.02 | -3.5 ± 1.2 | 22.3 |
| DSPE-PEG2k (Control) | 5 mol% | 119.6 ± 2.8 | 0.10 ± 0.01 | -5.8 ± 0.7 | 8.4 |
| Sucrose Laurate (L-595) | 1.5% (w/v) | 105.3 ± 2.1 | 0.09 ± 0.01 | -10.4 ± 1.0 | 15.2 |
| Phosphatidylinositol | 10 mol% | 155.7 ± 4.5 | 0.14 ± 0.02 | -32.6 ± 2.4 | 12.8 |
| GM1 Ganglioside | 5 mol% | 162.3 ± 6.7 | 0.16 ± 0.03 | -28.1 ± 1.8 | 10.5 |
Key Experimental Protocols
Protocol 2.1: Preparation of Sucrose Ester-Stabilized Solid Lipid Nanoparticles (SLNs)
Objective: To formulate and characterize PEG-free SLNs using sucrose laurate (L-595) as a stabilizer. Materials: Compritol 888 ATO (lipid matrix), Sucrose Laurate (L-595), Tween 80 (for comparison), deionized water, hot plate with magnetic stirrer, probe sonicator, Zetasizer Nano. Procedure:
- Melt Dispersion: Melt 200 mg Compritol at 75°C (10°C above its melting point).
- Aqueous Phase Preparation: Dissolve 60 mg of surfactant (L-595 or Tween 80) in 20 mL of pre-heated (75°C) deionized water.
- Hot Emulsification: Slowly add the molten lipid to the aqueous surfactant solution under high-speed homogenization (10,000 rpm, 2 minutes).
- Probe Sonication: Immediately transfer the coarse emulsion to an ice bath. Sonicate using a probe sonicator (70% amplitude, 5 minutes total, pulsed 5s on/2s off) while maintaining temperature below 10°C.
- Characterization: Dilute the resultant nanoemulsion 1:100 in filtered DI water. Measure particle size, PDI, and zeta potential using dynamic light scattering (DLS) immediately after preparation (t=0) and after storage at 4°C and 25°C for defined intervals.
Protocol 2.2: Assessing Serum Stability via Turbidity Kinetics
Objective: To quantitatively compare the aggregation kinetics of differently stabilized liposomes in biological media. Materials: Formulated liposomes (e.g., with PI, GM1, or sucrose esters), fetal bovine serum (FBS), phosphate-buffered saline (PBS), 96-well plate, plate reader capable of measuring absorbance at 650 nm. Procedure:
- Sample Preparation: Dilute each liposome formulation in PBS to an absorbance of ~0.8 at 650 nm (A_initial).
- Serum Incubation: In a 96-well plate, mix 100 µL of diluted liposomes with 100 µL of 50% FBS (in PBS) to create a final serum concentration of 25%. Include controls of liposomes in PBS only.
- Kinetic Measurement: Immediately place the plate in a pre-heated (37°C) plate reader. Shake briefly and measure absorbance at 650 nm every 2 minutes for 2 hours.
- Data Analysis: Calculate the aggregation ratio (At / Ainitial) over time. The time to reach a 20% increase in absorbance (T_20%) is a key metric for stability comparison.
Visualizations
Diagram 1: PEG-Free Stabilization Mechanisms
Diagram 2: Serum Stability Experiment Workflow
The Scientist's Toolkit: Essential Research Reagents & Materials
Table 2: Key Reagents for PEG-Free Nanoparticle Stabilization Research
| Item | Function / Rationale | Example Product / Note |
|---|---|---|
| Sucrose Fatty Acid Esters | Non-ionic, biodegradable surfactants providing steric stabilization without PEG. Grade (mono- vs. di-ester) affects HLB. | Sucrose laurate (L-595, HLB~16), Sucrose palmitate (P-1670). |
| Phosphatidylinositol (PI) | Anionic phospholipid providing electrostatic and slight steric stabilization; mimics mammalian cell surface components. | Soy PI or synthetic (e.g., 18:0 PI). |
| Gangliosides (GM1) | Complex glycosphingolipids conferring strong steric stabilization and low immunogenicity. Expensive. | GM1 from bovine brain. |
| Polyglycerol-based Lipids | Offers a polyol-based hydrophilic head as a PEG alternative. | Polyglycerol (PG) of varying chain lengths esterified with fatty acids. |
| High-Tg Lipids | Increase bilayer rigidity, reducing permeability and fusion. Critical for solid lipid nanoparticles. | Compritol 888 ATO (mp ~70°C), Tristearin. |
| Microfluidics System | Enables reproducible, scalable production of nanoparticles with precise control over size and PDI. | NanoAssemblr, Microfluidic chip. |
| Dynamic Light Scattering (DLS) | Instrument for primary characterization of hydrodynamic diameter, PDI, and zeta potential. | Malvern Zetasizer Nano series. |
| Asymmetric Flow FFF | Advanced separation and characterization technique for analyzing complex nanoparticle mixtures and quantifying free surfactant. | Wyatt Technology Eclipse AF4 system coupled with MALS. |
Application Notes within PEG-Free Nanoparticle Stabilization Strategies
The pursuit of biocompatible, non-immunogenic alternatives to poly(ethylene glycol) (PEG) for nanoparticle (NP) stabilization has intensified due to the prevalence of anti-PEG antibodies. Natural polysaccharides offer a versatile toolkit, providing steric stabilization, stealth properties, and active targeting through their inherent bio-recognition and modifiable functional groups. This document details the application and protocols for four key polysaccharides in PEG-free NP formulations, framed within a thesis on next-generation nanocarrier stabilization.
Hyaluronic Acid (HA)
Application Notes: HA, a glycosaminoglycan, is a ligand for CD44 and RHAMM receptors overexpressed on many cancer cells. As a stabilizer, its highly hydrophilic, polyanionic nature provides a hydrated shell that reduces protein opsonization and improves colloidal stability. Recent studies focus on cross-linked HA shells or HA conjugated to NP cores (e.g., PLGA, lipid) for targeted drug delivery.
Protocol 1.1: Synthesis of HA-Coated PLGA Nanoparticles (Emulsion-Solvent Evaporation)
Objective: To prepare docetaxel-loaded, HA-stabilized PLGA NPs for CD44-targeted delivery.
Materials (Research Reagent Solutions):
- PLGA (50:50, 24 kDa): Biodegradable polymer core matrix.
- Hyaluronic Acid (Sodium salt, 10 kDa): Stabilizing, targeting coating agent.
- Docetaxel: Model hydrophobic chemotherapeutic agent.
- Polyvinyl Alcohol (PVA, 30-70 kDa): Primary emulsifier (to be displaced/replaced by HA).
- Dichloromethane (DCM): Organic solvent for PLGA and drug.
- Acetone: Used to modify organic phase viscosity.
- Ultrapure Water: Aqueous phase component.
Method:
- Dissolve 50 mg PLGA and 5 mg docetaxel in a 3:1 (v/v) mixture of DCM and acetone (total 4 mL).
- Prepare the primary aqueous phase: 100 mL of 1% (w/v) PVA solution.
- Emulsify the organic phase in the aqueous phase using a probe sonicator (70% amplitude, 2 min, on ice) to form a primary W/O emulsion.
- Prepare the HA coating solution: Dissolve 150 mg of HA in 50 mL of ultrapure water.
- Add the primary emulsion dropwise into the HA solution under magnetic stirring (600 rpm).
- Stir the mixture for 6 hours at room temperature to allow for complete solvent evaporation and HA adsorption/displacement.
- Centrifuge the NPs at 18,000 x g for 30 min, wash twice with water, and resuspend in PBS or lyophilize with a cryoprotectant (e.g., 2% trehalose).
Chitosan (CS)
Application Notes: Chitosan, a cationic polysaccharide derived from chitin, offers mucoadhesive properties and can transiently open tight junctions. As a stabilizer, its positive charge enables electrostatic interactions with anionic mucin or cell membranes. It is often used in polyelectrolyte complexation or as a coating on pre-formed NPs to confer positive zeta potential and enhanced cellular uptake.
Protocol 2.1: Formation of Chitosan/Heparin Polyelectrolyte Complex Nanoparticles
Objective: To prepare self-assembled, PEG-free NPs for siRNA delivery via electrostatic complexation.
Materials (Research Reagent Solutions):
- Chitosan HCl (20 kDa, >90% deacetylation): Cationic complexing and condensing agent.
- Heparin Sodium (12 kDa): Anionic complexing agent and stabilizer.
- siRNA (e.g., anti-GFP): Model nucleic acid payload.
- Sodium Tripolyphosphate (TPP, 1% w/v): Ionic cross-linker for chitosan.
- HEPES Buffer (20 mM, pH 6.5): Complexation buffer.
Method:
- Dissolve chitosan at 1 mg/mL in filtered 20 mM HEPES buffer (pH 6.5). Stir overnight.
- Prepare separate solutions of heparin (1 mg/mL) and siRNA (0.1 mg/mL) in the same HEPES buffer.
- For complex formation, add the heparin solution dropwise to an equal volume of chitosan solution under vortexing. Incubate for 15 min at room temperature to form chitosan/heparin cores.
- Add the siRNA solution dropwise to the core suspension under gentle vortexing. Incubate for 30 min.
- Optionally, add TPP solution (10% v/v of total) to further ionically cross-link the chitosan. Incubate 15 min.
- Purify complexes via ultrafiltration (100 kDa MWCO) or centrifugation (14,000 x g, 20 min).
Dextran
Application Notes: Dextran, a bacterial-derived neutral polysaccharide, is a classical stealth-coating material. Its hydroxyl groups can be easily derivatized. Oxidized dextran (polyaldehyde) is used for Schiff base formation with amine-containing drugs or surfaces, providing a biodegradable, stabilizing linkage. It is excellent for forming stable iron oxide NPs.
Protocol 3.1: One-Pot Synthesis of Dextran-Stabilized Iron Oxide Nanoparticles (Co-Precipitation)
Objective: To synthesize superparamagnetic iron oxide NPs (SPIONs) stabilized by a covalently bound dextran shell.
Materials (Research Reagent Solutions):
- Dextran T-10 (10 kDa): Steric stabilizer and surface ligand.
- Ferric Chloride Hexahydrate (FeCl3·6H2O): Iron precursor.
- Ferrous Chloride Tetrahydrate (FeCl2·4H2O): Iron precursor.
- Ammonium Hydroxide (28% NH3): Precipitation agent.
- Nitric Acid (0.1 M): For washing.
- Sodium Hydroxide (1 M): For pH adjustment.
Method:
- Dissolve 1.0 g of dextran T-10 in 40 mL of degassed ultrapure water under nitrogen purge.
- Add 0.86 g (4.4 mmol) of FeCl3·6H2O and 0.32 g (1.6 mmol) of FeCl2·4H2O to the dextran solution. Stir under nitrogen at 60°C until salts are fully dissolved.
- Rapidly add 5 mL of 28% ammonium hydroxide to the vigorously stirred mixture. A black precipitate will form immediately.
- Maintain the reaction at 60°C for 1 hour under continuous stirring.
- Cool to room temperature. Dialyze the resulting suspension against 0.1 M HNO3 for 24h (MWCO 14 kDa), then against ultrapure water for another 48h to remove unreacted species and salts.
- Pass the dialyzed suspension through a 0.22 µm filter. Concentrate using an ultrafiltration unit (100 kDa MWCO) if necessary.
Heparin
Application Notes: Beyond its anticoagulant function, heparin is a highly sulfated glycosaminoglycan with strong binding affinity for various growth factors and proteins. As a NP stabilizer, it provides a dense negative charge and can inhibit complement activation. It is used to create biomimetic coatings or as a targeting ligand for receptors like VEGF.
Protocol 4.1: Heparin-Coated Lipid Nanoparticles (LNPs) via Post-Insertion
Objective: To confer a heparin corona to pre-formed cationic LNPs for improved biocompatibility and growth factor sequestration.
Materials (Research Reagent Solutions):
- Heparin-Thiocitic Acid Conjugate: Synthesized via EDC/NHS chemistry; provides thiol for anchoring.
- Cationic LNP Formulation: Composed of DOTAP/DOPE/Cholesterol (e.g., 40/30/30 mol%).
- Dithiothreitol (DTT, 0.5 M): Reducing agent for disulfide bond in thiocitic acid.
- Phosphate Buffered Saline (PBS, pH 7.4): Reaction and purification buffer.
- Sephadex G-25 Size Exclusion Column: For purification.
Method:
- Reduce the heparin-thiocitic acid conjugate (5 mg) with a 50-fold molar excess of DTT in PBS for 2 hours at room temperature. Purify via PD-10 desalting column into PBS to remove excess DTT.
- Prepare cationic LNPs using standard ethanol injection or microfluidic mixing techniques. Characterize size and zeta potential.
- Incubate the thiolated heparin (at a 1:10 w/w ratio of heparin:lipid) with the cationic LNPs under gentle shaking at 37°C for 12 hours. The thiol groups will insert into the lipid membrane and potentially form disulfide bridges.
- Remove unbound heparin by passing the mixture through a Sephadex G-25 column equilibrated with PBS.
- Analyze the heparin coating success by measuring the reversal of zeta potential from positive to negative and via a toluidine blue assay for heparin quantification.
Table 1: Physicochemical Properties of Polysaccharide-Stabilized Nanoparticles
| Polysaccharide | NP Core Model | Avg. Size (nm) | PDI | Zeta Potential (mV) | Key Functional Outcome |
|---|---|---|---|---|---|
| Hyaluronic Acid | PLGA-Docetaxel | 165 ± 12 | 0.09 | -32 ± 4 | 3.5x higher uptake in CD44+ cells vs. bare NPs |
| Chitosan | Chitosan/Heparin/siRNA | 110 ± 20 | 0.15 | +24 ± 3 | >80% siRNA complexation; 60% gene silencing in vitro |
| Dextran | Iron Oxide (SPIONs) | 12 (core) / 35 (hydrodynamic) | 0.08 | -15 ± 2 | R2 relaxivity of 120 mM⁻¹s⁻¹; stable in serum >24h |
| Heparin | Cationic Liposome | 95 ± 5 → 105 ± 8 | 0.10 → 0.12 | +45 → -25 | 90% reduction in complement (C3) activation |
Table 2: Key Comparison of Polysaccharide Functions in PEG-Free Stabilization
| Polysaccharide | Charge | Primary Stabilization Mechanism | Key Receptor Targeting | Main Advantage for PEG-Free Strategy |
|---|---|---|---|---|
| Hyaluronic Acid | Negative | Steric, Hydration | CD44, RHAMM | Intrinsic active targeting; excellent biocompatibility |
| Chitosan | Positive | Electrostatic, Mucoadhesion | --- (non-specific) | Enhances permeation; readily modifiable |
| Dextran | Neutral | Steric, Brush-like layer | Scavenger Receptors | Proven historical use; easily oxidized for conjugation |
| Heparin | Strongly Negative | Electrosteric | Growth Factors (e.g., VEGF) | Anti-complement properties; bio-functional activity |
Visualizations
Title: Polysaccharide Selection Pathway for PEG-Free NP Stabilization
Title: HA-Coated PLGA Nanoparticle Synthesis Workflow
The Scientist's Toolkit: Essential Research Reagent Solutions
| Item | Function in PEG-Free NP Research | Example/Note |
|---|---|---|
| PLGA (50:50, acid-terminated) | Core biodegradable polymer for encapsulating hydrophobic drugs. Degradation rate tuned by MW and LA:GA ratio. | 24-38 kDa common for sustained release. |
| Low MW Chitosan (≥90% DA) | Cationic stabilizer for polyplexes. High DA enhances positive charge density for nucleic acid binding. | Purify by filtration before use. Soluble in acidic buffers (pH <6.5). |
| Oxidized Dextran (Polyaldehyde) | Provides reactive aldehyde groups for Schiff base formation with amine-containing surfaces, enabling biodegradable cross-linking. | Degree of oxidation (DO) critical; target DO 10-25%. |
| Heparin-Thiol Conjugate | Enables post-fabrication anchoring to lipid membranes or metal surfaces via thiol/disulfide exchange or gold-sulfur bonds. | Must be purified and reduced immediately before use. |
| Size Exclusion Chromatography (SEC) Columns (e.g., Sephadex G-25, PD-10) | Critical for removing unreacted small molecules (e.g., DTT, EDC, NHS) and exchanging buffers post-conjugation. | Fast, non-denaturing purification method. |
| Lyophilization Protectant (Trehalose) | Preserves NP integrity and prevents aggregation during freeze-drying for long-term storage of polysaccharide-coated NPs. | Typically used at 2-5% (w/v) in pre-lyophilization suspension. |
| Toluidine Blue O Dye | Metachromatic dye for colorimetric or spectrophotometric quantification of anionic polysaccharides (e.g., HA, Heparin) on NP surfaces. | Forms blue complex with sulfated/carboxylated glycosaminoglycans. |
Within the broader thesis on PEG-free stabilization strategies for nanoparticles, this application note details the rationale and methods for developing alternative surface coatings. The objective is to circumvent limitations associated with polyethylene glycol (PEG), such as accelerated blood clearance (ABC) phenomenon and anti-PEG immune responses, while enabling targeted delivery of diverse therapeutic cargos.
Key PEG-Free Coating Platforms
Zwitterionic Polymers
Zwitterionic polymers, such as poly(carboxybetaine) (PCB) and poly(sulfobetaine) (PSB), create a dense hydration layer via electrostatic interactions, providing superior stealth properties.
- Key Advantage: Extremely low protein fouling and reduced macrophage uptake.
- Common Monomers: Carboxybetaine methacrylate (CBMA), Sulfobetaine methacrylate (SBMA).
Poly(amino acid)-Based Polymers
Polymers like poly(glutamic acid) (PGA), poly(aspartic acid) (PAA), and poly(2-oxazoline)s (POx) offer biodegradability and versatile side-chain functionalization.
- Key Advantage: Tunable chemistry for ligand conjugation and pH-responsive behavior.
- Common Types: Poly(2-methyl-2-oxazoline) (PMeOx), Poly(2-ethyl-2-oxazoline) (PEtOx).
Polysaccharides
Natural polysaccharides, including hyaluronic acid (HA), dextran, and chitosan, are biocompatible and often have innate targeting capabilities (e.g., HA targets CD44 receptors).
- Key Advantage: Biodegradable, naturally derived, and often receptor-specific.
Lipid-Based Coatings
Strategies include the use of gangliosides (e.g., GM3) or saturated phospholipids that form a rigid, protective corona on nanoparticle surfaces.
- Key Advantage: Simple integration into liposomal or lipid nanoparticle (LNP) formulations.
Table 1: Quantitative Comparison of PEG-Free Coating Platforms
| Coating Platform | Example Polymer | Hydrodynamic Layer Thickness (nm)* | Reported % Reduction in Macrophage Uptake (vs. PEG)* | Key Functionalization Handle |
|---|---|---|---|---|
| Zwitterionic | Poly(SBMA) | 8 - 15 | 60 - 85% | Azide, Alkyne, NHS-ester |
| Poly(amino acid) | Poly(glutamic acid) | 5 - 12 | 50 - 75% | Carboxyl, Amine |
| Poly(2-oxazoline) | Poly(PEtOx) | 7 - 20 | 70 - 90% | Hydroxyl, Amine, Carboxyl |
| Polysaccharide | Hyaluronic Acid | 10 - 30 | 40 - 70% | Carboxyl, Hydroxyl |
| Lipid-based | Ganglioside GM1 | 3 - 8 | 55 - 80% | Lipid tail insertion |
*Representative ranges compiled from recent literature. Actual values depend on MW, density, and nanoparticle core.
Experimental Protocols
Protocol 2.1: Grafting-to Functionalization of LNPs with Zwitterionic Polymers
Objective: To conjugate a poly(carboxybetaine)-azide (PCB-N₃) polymer onto DBCO-functionalized lipid nanoparticles via strain-promoted azide-alkyne cycloaddition (SPAAC).
Materials:
- DBCO-PEG-DSPE lipid (or DBCO-headgroup lipid)
- PCB-N₃ (Mn ~10 kDa)
- Pre-formed LNPs (containing 0.5 mol% DBCO-lipid)
- HEPES Buffered Saline (HBS), pH 7.4
- Size-exclusion chromatography (SEC) columns (e.g., PD-10 desalting columns)
Procedure:
- LNP Preparation: Formulate LNPs via microfluidic mixing, incorporating 0.5 mol% of the DBCO-functionalized lipid into the lipid mixture.
- Polymer Conjugation: Dilute the LNPs in HBS to a final lipid concentration of 1 mM. Add an aqueous solution of PCB-N₃ at a 1.5:1 molar ratio of PCB-N₃ to DBCO-lipid.
- Incubation: React for 4 hours at room temperature with gentle stirring.
- Purification: Purify the PCB-coated LNPs using size-exclusion chromatography (SEC) with HBS as the eluent to remove unreacted polymer.
- Characterization: Analyze particle size and zeta potential via dynamic light scattering (DLS). Confirm conjugation via change in zeta potential (towards neutral) and/or a shift in hydrodynamic diameter.
Protocol 2.2: Synthesis of POx-Based Terpolymer for pH-Responsive Gene Delivery
Objective: To synthesize a poly(2-ethyl-2-oxazoline)-stat-methylacrylate-graft-diethylaminoethyl methacrylate (PEtOx-stat-MA-g-DEAEMA) terpolymer for pH-sensitive, PEG-free nucleic acid delivery.
Materials:
- 2-Ethyl-2-oxazoline (EtOx)
- Methyl acrylate (MA)
- Diethylaminoethyl methacrylate (DEAEMA)
- Methyl tosylate (MeOTs) initiator
- Acetonitrile (dry)
- Diethyl ether
Procedure:
- Copolymerization: In a dry Schlenk flask, dissolve EtOx (80 mol%) and MA (20 mol%) in dry acetonitrile under nitrogen. Add MeOTs (1 eq relative to monomers). Heat at 90°C for 24 hours.
- Termination & Isolation: Cool the reaction to room temperature. Terminate by adding a concentrated aqueous KOH solution. Precipitate the PEtOx-stat-MA copolymer into cold diethyl ether and collect by filtration.
- Grafting: Dissolve the purified copolymer and DEAEMA (30 mol% relative to MA units) in DMF. Add a catalytic amount of DCC/DMAP. React for 48 hours at room temperature.
- Purification: Dialyze the reaction mixture against methanol and then water (MWCO 3.5 kDa). Lyophilize to obtain the final terpolymer.
- Validation: Characterize by ¹H-NMR and GPC. Confirm buffering capacity via acid-base titration.
Visualization: Pathways and Workflows
PEG-Free Nanoparticle Design Rationale
Workflow for LNP Surface Functionalization
The Scientist's Toolkit: Research Reagent Solutions
Table 2: Essential Materials for PEG-Free Nanoparticle Research
| Item | Function & Relevance | Example Supplier/Cat. No. (Illustrative) |
|---|---|---|
| DBCO-PEG-DSPE | Anchor lipid for "click" chemistry functionalization of liposomes/LNPs. | Nanocs, Avanti Polar Lipids |
| Poly(SBMA) NHS Ester | Ready-to-conjugate zwitterionic polymer for grafting-to approaches. | Sigma-Aldrich, Specific Polymers |
| 2-Ethyl-2-Oxazoline | Monomer for synthesizing poly(2-oxazoline) stealth coatings. | Sigma-Aldrich, TCI Chemicals |
| Hyaluronic Acid (Low MW) | Natural polysaccharide for CD44-targeted, biodegradable coatings. | Lifecore Biomedical, Bloomage |
| Ganglioside GM1 | Natural glycolipid for conferring stealth properties to lipid nanoparticles. | Avanti Polar Lipids, Matreya |
| Microfluidic Mixer Chip | For reproducible, scalable production of coated nanoparticles (LNPs, polymersomes). | Dolomite Microfluidics, Precision NanoSystems (NanoAssemblr) |
| Size-Exclusion Chromatography Columns | For purifying coated nanoparticles from excess reagents and unreacted polymers. | Cytiva (PD-10), Bio-Rad |
| ζ-Potential & DLS Analyzer | Critical for characterizing coating success (size increase, surface charge shift). | Malvern Panalytical (Zetasizer), Horiba (SZ-100) |
Navigating Challenges: Formulation Optimization and Scale-Up for PEG-Free Nanoparticles
Within the broader thesis on PEG-free stabilization strategies for nanoparticle research, this document addresses the fundamental challenge of maintaining colloidal stability in aqueous and biological media without relying on poly(ethylene glycol) (PEG). The drive towards PEG alternatives is motivated by issues such as the induction of anti-PEG antibodies, accelerated blood clearance (ABC phenomenon), and hypersensitivity reactions. This note details common pitfalls and provides protocols for evaluating and achieving stable, non-aggregating nanoparticle dispersions using next-generation hydrophilic polymers and biomimetic coatings.
Common Pitfalls and Quantitative Analysis
Aggregation is governed by the balance between attractive van der Waals forces and repulsive forces, classically described by DLVO theory. Key pitfalls include insufficient surface charge (zeta potential), inadequate steric layer thickness/density, and poor compatibility with the dispersion medium (e.g., ionic strength, pH, serum proteins).
Table 1: Quantitative Stability Metrics for PEG-Free Coatings
| Stabilizing Polymer/Coating | Typical Hydrodynamic Diameter (nm) | Zeta Potential in PBS (mV) | Critical Salt Concentration (M NaCl) | Serum Stability (Half-life, h) |
|---|---|---|---|---|
| Poly(2-oxazoline) (PMOx) | 25 ± 3 | -2 ± 1 | 0.15 | 8 |
| Poly(sarcosine) (PSar) | 30 ± 5 | -5 ± 2 | 0.18 | 12 |
| Poly(glycerol) (PG) | 28 ± 4 | -1 ± 1 | 0.25 | 24 |
| Poly(vinylpyrrolidone) (PVP) | 35 ± 8 | -3 ± 2 | 0.10 | 4 |
| Zwitterionic Polymer (PCB) | 22 ± 2 | 0 ± 1 | >0.5 | >48 |
Table 2: Common Pitfalls and Diagnostic Signatures
| Pitfall | Diagnostic Signature (DLS) | Corrective Action |
|---|---|---|
| Inadequate coating density | Size increase over time, multimodal distribution | Optimize grafting ratio; use denser initiator layer |
| Low surface charge in ionic media | Low zeta potential (│ζ│< 10 mV), rapid aggregation | Incorporate anionic/cationic monomers; use zwitterions |
| Non-specific protein adsorption (fouling) | Size & PDI increase in serum, change in ζ | Switch to ultralow-fouling coatings (e.g., PCB, PG) |
| Hydrophobic core exposure | Instant aggregation upon dilution | Ensure complete surface coverage; use block copolymers |
| pH-sensitive aggregation | Size change at specific pH | Use pH-insensitive polymers or add stabilizing agents |
Experimental Protocols
Protocol 1: Synthesis of Poly(2-oxazoline)-coated PLGA Nanoparticles
Objective: Prepare sterically stabilized, PEG-free nanoparticles via nanoprecipitation. Materials: PLGA (50:50, 24 kDa), Poly(2-methyl-2-oxazoline)-b-PLGA (PMOx-PLGA) block copolymer, acetone (HPLC grade), deionized water, dialysis tubing (MWCO 12-14 kDa). Procedure:
- Dissolve 50 mg PLGA and 10 mg PMOx-PLGA block copolymer in 5 mL acetone.
- Using a syringe pump, add the organic solution dropwise (1 mL/min) into 20 mL of rapidly stirring deionized water.
- Stir for 3 hours at room temperature to evaporate acetone.
- Transfer the suspension to dialysis tubing and dialyze against 2 L of deionized water for 24 hours, changing water every 8 hours.
- Concentrate using ultrafiltration (100 kDa MWCO) if necessary. Measure size, PDI, and zeta potential via DLS.
Protocol 2: Critical Salt Concentration (CSC) Assay
Objective: Determine the ionic strength at which aggregation begins, a key stability metric. Materials: Nanoparticle suspension (1 mg/mL), 5 M NaCl stock solution, PBS (10x), DLS instrument. Procedure:
- Prepare a dilution series of NaCl in deionized water (0.05, 0.1, 0.15, 0.2, 0.25, 0.3, 0.4, 0.5 M) in 1 mL volumes.
- Mix 50 µL of nanoparticle suspension with 950 µL of each NaCl solution. Vortex gently.
- Incubate at 25°C for 10 minutes.
- Measure the hydrodynamic diameter (Z-average) of each sample via DLS in triplicate.
- Plot Z-average vs. [NaCl]. The CSC is defined as the concentration where a >10% increase from baseline diameter is observed.
Protocol 3: Serum Stability and Protein Corona Analysis
Objective: Assess colloidal stability and fouling resistance in biologically relevant media. Materials: Nanoparticle suspension (5 mg/mL), Fetal Bovine Serum (FBS), PBS, ultracentrifuge, SDS-PAGE kit. Procedure:
- Dilute nanoparticles in 50% FBS/PBS to a final concentration of 0.5 mg/mL. Incubate at 37°C with gentle shaking.
- At t = 0, 1, 2, 4, 8, 24 hours, withdraw 100 µL aliquots.
- Analyze aliquots by DLS for size and PDI. For protein corona analysis: a. At t = 1 hour, isolate nanoparticles by ultracentrifugation (100,000 g, 45 min, 4°C). b. Wash pellet gently with cold PBS twice. c. Resuspend in SDS-PAGE loading buffer, heat denature, and run gel.
- Compare corona profiles to assess fouling propensity.
The Scientist's Toolkit: Research Reagent Solutions
Table 3: Essential Materials for PEG-Free Stability Research
| Item / Reagent | Function / Application |
|---|---|
| Block Copolymers (e.g., PMOx-PLGA, PSar-PLGA) | Provide steric stabilization via hydrophilic, non-fouling polymer brushes. |
| Zwitterionic Monomers (e.g., Carboxybetaine methacrylate, PCBMA) | For surface grafting to achieve ultralow fouling and high salt stability via a hydration layer. |
| Dynamic Light Scattering (DLS) Instrument with Zeta Potential Capability | Primary tool for measuring hydrodynamic diameter, PDI, and surface charge. |
| Asymmetric Flow Field-Flow Fractionation (AF4) with MALS/DLS | High-resolution size separation and characterization of polydisperse or aggregated samples. |
| Isothermal Titration Calorimetry (ITC) | Quantifies binding thermodynamics between nanoparticles and serum proteins or other molecules. |
| Quartz Crystal Microbalance with Dissipation (QCM-D) | Measures real-time adsorption of proteins/biomolecules onto coated surfaces to assess fouling resistance. |
| Stable, High-Concentration Salt Solutions (e.g., NaCl, (NH4)2SO4) | For performing CSC assays and stress testing. |
| Pre-cleaned, Sizing-Approved Disposable Cuvettes & Capillary Cells | For accurate and reproducible DLS and zeta potential measurements, minimizing dust artifacts. |
Diagrams
Title: From DLVO to Modern PEG-Free Stabilization Strategies
Title: PEG-Free Nanoparticle Stability Assessment Workflow
Optimization of Coating Density, Conjugation Chemistry, and Surface Charge
Application Notes
Within the pursuit of PEG-free nanoparticle stabilization, the optimization of the non-PEG coating layer is critical to in vivo performance. This trifecta—density, conjugation chemistry, and resulting surface charge—directly dictates colloidal stability, protein corona composition, cellular interactions, and biodistribution. A holistic optimization strategy is required to balance stealth properties with functionality, such as active targeting.
Key Findings and Quantitative Data Summary
| Parameter | Optimization Goal | Typical Measurement Method | Impact on Performance (PEG-free context) |
|---|---|---|---|
| Coating Density | Maximal surface coverage without inducing aggregation. | TGA, NMR, fluorescence assay, DLS/ζ-potential shift. | High density minimizes opsonin adsorption, enhances steric stabilization. Insufficient density leads to rapid clearance. Excessive density can hinder drug release or targeting ligand accessibility. |
| Conjugation Chemistry | High-efficiency, controlled, and stable linkage. | HPLC, UV-Vis, Ellman's assay, MALDI-TOF. | Defines coating stability (hydrolytic, enzymatic). Click chemistry (e.g., SPAAC) offers high yield/specificity. Thiol-maleimide remains common but prone to serum exchange. Newer methods: tyrosine ligation, oxime chemistry. |
| Surface Charge (ζ-Potential) | Near-neutral, slightly negative (-10 to +5 mV) in physiological buffer. | Dynamic Light Scattering (DLS). | Strongly positive charge (> +10 mV) increases nonspecific cellular uptake and toxicity. Strongly negative charge (< -20 mV) may activate complement. Near-neutral charge reduces electrostatic protein adsorption. |
| Hydrodynamic Diameter | Minimal increase post-coating (< 10 nm increase). | DLS, NTA. | A sharp, low-polydispersity (PDI < 0.1) peak indicates uniform coating. Large increases suggest aggregation or multilayer formation. |
| Serum Stability | < 20% size increase over 24h in 50% FBS at 37°C. | DLS time-course. | Primary indicator of successful steric stabilization. Failure leads to aggregation and clearance. Correlates directly with optimized density and chemistry. |
Experimental Protocols
Protocol 1: Quantification of Coating Density via Fluorescent Labeling Objective: To determine the number of coating molecules (e.g., polysarcosine, hydroxyethyl starch) per nanoparticle. Materials: Fluorescent dye-NHS ester (e.g., FITC, Cy5), coated nanoparticles, Zeba Spin Desalting Columns, fluorescence plate reader, standard curve of free dye. Procedure:
- React a known quantity of coated nanoparticles (containing surface amines) with a 5-fold molar excess of dye-NHS ester in borate buffer (pH 8.5) for 2h, protected from light.
- Purify the labeled nanoparticles using three successive desalting column spins to remove unreacted dye.
- Measure fluorescence intensity (λex/λem). Use a standard curve of free dye to determine the moles of dye bound.
- Calculate coating density: Molecules per particle = (Moles of dye bound / Moles of nanoparticles). Nanoparticle moles are calculated from total particle mass, core density, and mean core diameter (from TEM).
Protocol 2: Systematic ζ-Potential Optimization via Coating Ratio Titration Objective: To identify the optimal molar ratio of coating ligand to nanoparticle surface groups for achieving near-neutral charge. Materials: Uncoated nanoparticles (e.g., PLGA, lipid, metal), coating ligand (e.g., peptide, zwitterionic polymer), conjugation buffer, DLS/Zetasizer. Procedure:
- Prepare a stock solution of nanoparticles (1 mg/mL) in appropriate conjugation buffer (e.g., MES, pH 6.0 for EDC/NHS).
- Prepare a dilution series of the coating ligand to achieve final molar ratios (ligand:surface group) of 0.5:1, 1:1, 2:1, 5:1, and 10:1 in separate reaction tubes.
- Add a fixed volume of nanoparticle stock to each ligand aliquot. React under optimal conditions for chosen chemistry (e.g., 2h for EDC/NHS).
- Purify each batch via centrifugal filtration (100kDa MWCO).
- Resuspend in 1xPBS, pH 7.4. Measure the ζ-potential of each sample in triplicate using a Zetasizer. The optimal ratio is the lowest yielding a ζ-potential between -10 and +5 mV.
Protocol 3: In Vitro Serum Stability Assay Objective: To evaluate the colloidal stability of optimized, PEG-free coated nanoparticles in biologically relevant media. Materials: Coated nanoparticles (1 mg/mL in PBS), fetal bovine serum (FBS), PBS, DLS instrument, 37°C incubator. Procedure:
- Mix nanoparticles 1:1 with 100% FBS to create a 50% FBS suspension (final nanoparticle concentration ~0.5 mg/mL).
- Incubate at 37°C.
- Subsample at t = 0, 1, 2, 4, 8, and 24 hours. Dilute subsamples 1:10 in PBS immediately before measurement to avoid scattering artifacts.
- Measure hydrodynamic diameter and PDI by DLS.
- Plot size vs. time. Successful stabilization is indicated by <20% increase in mean diameter and PDI remaining <0.2 over 24h.
The Scientist's Toolkit: Research Reagent Solutions
| Item | Function in Optimization |
|---|---|
| Zwitterionic Polymer (e.g., PCB, PMPC) | Provides steric stabilization via a hydration layer; mimics PEG's stealth properties without immunogenicity concerns. |
| Polysarcosine (pSar) | Non-immunogenic, hydrophilic polypeptoid offering high conformational flexibility and protease resistance for stealth coatings. |
| Hyaluronic Acid (Low MW) | Natural polysaccharide coating providing CD44-targeting potential and hydrophilic stabilization. |
| DBCO-PEG4-NHS Ester | Heterobifunctional linker for strain-promoted alkyne-azide cycloaddition (SPAAC); enables efficient, copper-free click conjugation to amine-bearing nanoparticles. |
| Traut's Reagent (2-Iminothiolane) | Thiolates primary amines on nanoparticle surfaces for subsequent conjugation to maleimide-functionalized coatings. |
| 4-(4,6-Dimethoxy-1,3,5-triazin-2-yl)-4-methylmorpholinium Chloride (DMTMM) | Coupling reagent for carboxyl-amine conjugation; often more efficient and less pH-sensitive than EDC/NHS in aqueous media. |
| Size Exclusion Spin Columns (e.g., Zeba, Micro Bio-Spin) | Critical for rapid purification of coated nanoparticles from excess reagents, dyes, or ligands post-conjugation. |
| ζ-Potential Reference Material (e.g., DTAP-005) | Standardized latex particles (-50 ± 5 mV) for verifying instrument performance before critical measurements. |
Visualization
Title: Optimization Parameters Influence Physiological Fate
Title: Thiol-Maleimide Coating and Charge Workflow
Ensuring Batch-to-Batch Reproducibility and Long-Term Storage Stability
Application Notes: PEG-Free Stabilization of Nanoparticles
The drive toward PEG-free nanocarriers necessitates robust, chemically defined stabilization strategies. This document outlines critical protocols and analytical frameworks for achieving reproducible manufacturing and long-term stability of lipid nanoparticles (LNPs) and polymeric nanoparticles without polyethylene glycol (PEG) components, a core requirement for advancing clinically viable formulations.
Core Stability Challenges in PEG-Free Systems
Removing PEG, a common steric stabilizer, exacerbates challenges like particle aggregation, Ostwald ripening, chemical degradation of cargo (e.g., siRNA, mRNA), and lipid oxidation. Reproducibility hinges on precise control over formulation parameters and process-induced variability.
Key Characterization Data for Reproducibility & Stability
Table 1: Critical Quality Attributes (CQAs) for Assessment
| CQA | Target Range (Example LNP) | Analytical Method | Frequency of Testing |
|---|---|---|---|
| Particle Size (Z-avg) | 75.0 ± 5.0 nm | Dynamic Light Scattering (DLS) | Each batch, stability timepoints |
| Polydispersity Index (PDI) | < 0.15 | DLS | Each batch, stability timepoints |
| Zeta Potential | -10 to -30 mV | Electrophoretic Light Scattering | Each batch, stability timepoints |
| Entrapment Efficiency | > 95% | Ribogreen/UV-Vis Assay | Each batch |
| pH | 6.5 - 7.5 | Potentiometry | Each batch, stability timepoints |
| Residual Solvent | < 5000 ppm | Gas Chromatography | Each batch |
| Active Concentration | 95-105% of target | HPLC or Bioassay | Stability timepoints |
Table 2: Stability Profile of PEG-free vs. PEGylated LNPs (Accelerated Conditions, 40°C)
| Formulation Type | Size Increase (%) | PDI Change | EE Loss (%) | Visual Assessment (7 days) |
|---|---|---|---|---|
| PEGylated LNP (Control) | +8.5 | +0.04 | -2.1 | No aggregation |
| PEG-free LNP (Ionizable Lipid) | +25.3 | +0.18 | -12.7 | Slight haze |
| PEG-free LNP (Lipid + Polymer) | +10.2 | +0.06 | -4.5 | No aggregation |
Detailed Experimental Protocols
Protocol 1: Microfluidics-Based Formulation for High Reproducibility Objective: Reproducibly prepare PEG-free LNPs with low PDI. Materials: Microfluidic mixer (e.g., NanoAssemblr), syringes, lipids (ionizable, phospholipid, cholesterol, stabilizer lipid like DMG-PEG2000 alternative), aqueous phase (mRNA in citrate buffer, pH 4.0). Procedure:
- Prepare lipid solution in ethanol at 10 mg/mL total lipid concentration. The stabilizer lipid is a PEG-free alternative (e.g., GM-020, polysarcosine-based lipid).
- Prepare aqueous mRNA solution at 0.1 mg/mL in 10 mM citrate buffer (pH 4.0).
- Set total flow rate (TFR) to 12 mL/min and flow rate ratio (FRR, aqueous:organic) to 3:1.
- Load solutions into syringes and initiate mixing. Collect nanoparticles in a vial.
- Immediately dialyze (or use TFF) against 1X PBS (pH 7.4) for 2 hours to remove ethanol and buffer exchange. Critical Parameters: TFR, FRR, temperature (controlled at 22°C), lipid and mRNA concentrations. Document all parameters in a batch record.
Protocol 2: Forced Degradation & Real-Time Stability Studies Objective: Assess chemical and physical stability under stress. Materials: Formulated nanoparticles, vials, stability chambers, HPLC system. Procedure:
- Aliquot: Fill 1 mL of nanoparticle suspension into 2R glass vials under inert atmosphere (N2 purge).
- Storage Conditions:
- Real-time: 2-8°C, -20°C, -80°C.
- Accelerated: 25°C ± 2°C / 60% RH, 40°C ± 2°C / 75% RH.
- Time Points: 0, 1, 3, 6, 12, 24 months (real-time); 0, 1, 2, 4, 8, 12 weeks (accelerated).
- Analysis: At each time point, analyze CQAs from Table 1. For mRNA integrity, use capillary gel electrophoresis (Fragment Analyzer).
Visualizations
Batch Manufacturing & Stability Workflow
PEG-Free NP Instability Pathways
The Scientist's Toolkit: Research Reagent Solutions
Table 3: Essential Materials for PEG-Free Nanoparticle Research
| Item | Function & Rationale | Example/Supplier |
|---|---|---|
| Ionizable PEG-free Lipids | Core structural/cationic lipid for nucleic acid complexation. Enables endosomal escape. | SM-102, ALC-0315, proprietary novel lipids. |
| Steric Stabilizer Lipids (PEG-free) | Provides a hydration layer to prevent aggregation and opsonization. | GM-020, polysarcosine (PSar)-lipid conjugates, poly(2-oxazoline) lipids. |
| Microfluidic Mixer | Ensures rapid, reproducible mixing for uniform nanoparticle formation. | NanoAssemblr (Precision NanoSystems), staggered herringbone mixer chips. |
| Tangential Flow Filtration (TFF) System | Gentle concentration and buffer exchange to remove organic solvents and achieve final buffer. | Pellicon cassettes (MilliporeSigma), KrosFlo systems (Repligen). |
| Dynamic Light Scattering (DLS) Instrument | Measures hydrodynamic diameter, PDI, and size distribution. | Zetasizer Ultra (Malvern Panalytical). |
| Ribogreen Assay Kit | Quantifies free vs. encapsulated nucleic acids to determine entrapment efficiency. | Quant-iT RiboGreen (Thermo Fisher). |
| Oxygen Scavengers | Added to vial headspace to limit lipid oxidation during long-term storage. | Ageless ZPT (Mitsubishi Gas Chemical). |
| Cryoprotectants | Prevents particle fusion and degradation during freeze-thaw cycles. | Trehalose, sucrose at optimal w/v%. |
Addressing Manufacturing and Scale-Up Hurdles for Clinical Translation
The clinical translation of nanoparticle-based therapeutics is intrinsically linked to overcoming manufacturing and scale-up hurdles. A predominant challenge is the reliance on poly(ethylene glycol) (PEG) for steric stabilization, which is increasingly associated with anti-PEG immune responses, accelerated blood clearance (ABC), and hypersensitivity reactions. This application note, framed within a thesis on PEG-free stabilization strategies, details protocols for developing and scaling alternative stabilization methods. We focus on biomimetic and polymer-based alternatives, emphasizing reproducible synthesis, purification, and analytical characterization critical for Good Manufacturing Practice (GMP) compliance.
Table 1: Comparative Analysis of PEG-Free Stabilization Strategies for Scale-Up
| Stabilization Strategy | Key Material/Mechanism | Avg. Hydrodynamic Size (nm) ± SD (n=3) | PDI (Batch <10L) | PDI (Batch >100L) | Zeta Potential (mV) ± SD | Shelf-Life Stability (4°C) | Primary Scale-Up Challenge |
|---|---|---|---|---|---|---|---|
| Polysarcosine (pSar) | Polypeptoid, steric stabilization | 105.2 ± 3.5 | 0.08 ± 0.02 | 0.12 ± 0.05 | -1.5 ± 0.8 | >12 months | Controlling N-substitution during polymerization. |
| Poly(2-oxazoline) (PMeOx) | Synthetic polymer, stealth properties | 98.7 ± 2.1 | 0.07 ± 0.01 | 0.15 ± 0.08 | -2.1 ± 1.2 | >9 months | Residual monomer removal at large scale. |
| Zwitterionic Polymers | e.g., PCB, PMPC; hydration layer | 112.5 ± 4.8 | 0.10 ± 0.03 | 0.18 ± 0.10 | +0.5 ± 2.0 | >18 months | Cost and consistency of functional monomers. |
| Membrane Protein Coating | e.g., CD47, "self" marker | 125.8 ± 10.5* | 0.15 ± 0.05* | 0.25 ± 0.15* | -25.3 ± 5.0 | 6-8 months | Reproducible protein extraction and orientation. |
| Cell Membrane Coating | Full membrane extract (e.g., RBC) | 135.0 ± 15.0* | 0.18 ± 0.08* | 0.30 ± 0.20* | -28.5 ± 7.5 | 3-6 months | Batch-to-batch variability in membrane sourcing. |
*Size and PDI variability is inherently higher for biomimetic coatings and reflects a key characterization challenge.
Detailed Experimental Protocols
Protocol 3.1: Scale-Up Synthesis of Polysarcosine-b-Poly(D,L-lactide) (pSar-PLA) Nanoparticles via Micromixer-Assisted Nanoprecipitation
Objective: Reproducible, scalable production of PEG-free polymeric nanoparticles with controlled size and low PDI.
Materials: See "The Scientist's Toolkit" (Section 6).
Method:
- Polymer Solution Preparation: Dissolve pSar-PLA copolymer (50:50 kDa) in acetone (HPLC grade) at a concentration of 10 mg/mL. Filter through a 0.22 µm PTFE membrane.
- Aqueous Phase Preparation: Prepare 1x PBS (pH 7.4) containing 0.01% (w/v) polysorbate 20 (as a process stabilizer). Filter through a 0.22 µm PES membrane.
- Micromixer Setup: Connect a staggered herringbone micromixer (SHM) chip to two syringe pumps. Use gas-tight glass syringes for the organic and aqueous phases.
- Nanoprecipitation: Set the flow rate ratio (aqueous:organic) to 3:1. For initial lab scale (10 mL batch), use total flow rate (TFR) of 12 mL/min (Aqueous: 9 mL/min, Organic: 3 mL/min). For pilot scale (>100 mL batch), scale TFR proportionally while maintaining the same ratio and Reynolds number (Re) to ensure consistent mixing efficiency. This may require using a larger diameter mixer.
- Solvent Removal & Concentration: Collect the turbid suspension in a round-bottom flask under gentle magnetic stirring. Remove acetone by rotary evaporation at 30°C under reduced pressure (200 mbar initially, gradually reduced to 50 mbar). Concentrate the nanoparticle suspension to the desired volume (typically 10-20 mg polymer/mL).
- Purification: Transfer the concentrate to centrifugal filter units (100 kDa MWCO). Centrifuge at 4000 x g for 15 minutes. Retain the retentate (nanoparticles) and resuspend in fresh PBS. Repeat twice.
- Sterile Filtration: Pass the final suspension through a sterile 0.22 µm PVDF syringe filter into an apyrogenetic vial.
- Quality Control: Immediately characterize size, PDI, and zeta potential by DLS (see Protocol 3.3).
Protocol 3.2: Tangential Flow Filtration (TFF) for Large-Scale Purification & Buffer Exchange
Objective: Efficient, scalable purification and concentration of nanoparticle batches >100 mL.
Method:
- System Setup: Assemble a TFF system with a 100 kDa MWCO polyethersulfone (PES) hollow fiber cartridge. Sanitize the system by circulating 0.5 M NaOH for 30 min, followed by thorough rinsing with WFI (Water for Injection) until the permeate pH is neutral.
- Diafiltration: Load the crude nanoparticle suspension into the feed reservoir. Start the peristaltic pump, maintaining a cross-flow rate to achieve a shear rate of ~4000 s^-1 to prevent membrane fouling. Apply gentle pressure to maintain a permeate flux of ~20 LMH (L/m²/h).
- Buffer Exchange: Once the initial volume is reduced by 50%, begin diafiltration by continuously adding diafiltration buffer (e.g., PBS) to the feed reservoir at the same rate as the permeate flux. Perform a total of 10 volume exchanges to ensure complete removal of solvents, surfactants, and unencapsulated materials.
- Concentration: After diafiltration, continue filtration without buffer addition to concentrate the nanoparticle suspension to the target final volume (e.g., 50 mg/mL).
- Flush & Recovery: Use a small volume of final formulation buffer (e.g., sucrose buffer) to flush the retentate from the cartridge and tubing. Pool with the concentrated product.
- System Clean-in-Place (CIP): Immediately after recovery, circulate 0.1 M NaOH followed by WFI to clean the system.
Protocol 3.3: Critical Quality Attribute (CQA) Assessment: Dynamic Light Scattering (DLS) & Asymmetric Flow Field-Flow Fractionation (AF4) with Multi-Angle Light Scattering (MALS)
Objective: Accurately measure particle size distribution and detect aggregates.
A. Standard DLS Protocol:
- Dilute nanoparticle sample in the same buffer used for formulation to achieve an optimal scattering intensity (typically 100-500 kcps).
- Equilibrate sample in a disposable cuvette at 25°C for 180 seconds.
- Perform measurement with at least 12 sub-runs. Calculate the intensity-weighted size distribution (Z-average) and PDI via cumulants analysis.
- Note: DLS is sensitive to aggregates and dust. Always filter buffers (0.1 µm) and centrifuge samples if necessary (2,000 x g, 1 min).
B. Advanced AF4-MALS Protocol for Aggregation Analysis:
- System Calibration: Calibrate the AF4 channel height and MALS/RI detectors using a 100 kDa pullulan standard.
- Separation Conditions: Use a 350 µm spacer and a regenerated cellulose membrane (10 kDa MWCO). Mobile phase: PBS with 0.02% NaN₂. Focus/injection flow: 0.2 mL/min for 5 min. Elution: Use a cross-flow gradient from 2.0 mL/min to 0.0 mL/min over 30 minutes.
- Sample Injection: Inject 50 µL of sample at a concentration of 2-5 mg/mL.
- Data Analysis: Use the MALS signal (90° angle) and the RI signal to calculate the absolute root-mean-square (rms) radius and molar mass for each eluting fraction. This allows the differentiation of monodisperse nanoparticles from aggregates and free polymer.
Visualization of Key Concepts
Title: Scale-Up Workflow for PEG-Free Nanoparticles
Title: Rationale for PEG-Free Stabilization Strategies
The Scientist's Toolkit: Essential Research Reagent Solutions
Table 2: Key Materials for PEG-Free Nanoparticle Development & Scale-Up
| Item | Function/Benefit | Example Product/Catalog |
|---|---|---|
| pSar-PLA Copolymer | PEG-alternative block copolymer providing steric stabilization and biodegradability. | Custom synthesis from firms like Alamanda Polymers; or in-house synthesis via NCA ROP. |
| PMeOx Macroinitiator | Poly(2-methyl-2-oxazoline) for "stealth" surface grafting. | Available from specific biopolymer suppliers (e.g., Iris Biotech) or synthesized via CROP. |
| Zwitterionic Monomer | e.g., Carboxybetaine acrylamide; for constructing non-fouling polymer shells. | Sigma-Aldrich (e.g., 900368) or TCI Chemicals. |
| Staggered Herringbone Micromixer (SHM) | Provides rapid, reproducible mixing for size-controlled nanoprecipitation at small to pilot scale. | Dolomite Microfluidics (Part 3200284) or ChipShop. |
| Tangential Flow Filtration (TFF) System | Scalable purification, concentration, and buffer exchange for liters of nanoparticle suspension. | Repligen (KrosFlo systems) or Merck Millipore (Pellicon). |
| AF4-MALS System | Gold-standard for separating and characterizing nanoparticles, aggregates, and free polymer. | Wyatt Technology (Eclipse AF4 + DAWN MALS) or Postnova Analytics. |
| Lyoprotectant Screening Kit | Pre-formulated mixes of sugars, polymers, and buffers to optimize freeze-drying of sensitive NPs. | Formulated Solutions Ltd. (Lyoprotectant Screen) or in-house preparation. |
| Endotoxin-Free Reagents | Critical for in vivo studies and pre-clinical lot production to avoid immune confounding. | Thermo Fisher (UltraPure reagents) or HyClone WFI & buffers. |
Transitioning PEG-free nanoparticles from bench to bedside requires a holistic approach that marries innovative material science with robust process engineering. The protocols outlined here for synthesis (micromixer), purification (TFF), and characterization (AF4-MALS) provide a foundational framework for developing scalable and reproducible processes. The ultimate success of any PEG-free strategy hinges on its ability to be manufactured consistently at scale while meeting stringent regulatory requirements for safety, efficacy, and quality.
Analytical Techniques for Characterizing Coating Integrity and Surface Properties
Within the research framework of developing PEG-free stabilization strategies for nanoparticles (NPs) for drug delivery, rigorous characterization of the nanoparticle surface is paramount. The integrity, density, and chemical properties of the alternative stabilizing coating directly influence critical performance parameters such as colloidal stability, protein corona formation, cellular uptake, and in vivo fate. This application note details contemporary analytical techniques and protocols for evaluating these essential surface characteristics.
Key Analytical Techniques: Protocols and Data
X-ray Photoelectron Spectroscopy (XPS) for Surface Chemical Composition
Protocol:
- Sample Preparation: Deposit a concentrated nanoparticle suspension onto a clean silicon wafer or gold-coated substrate. Allow to air-dry in a laminar flow hood to form a thin film.
- Instrument Setup: Load sample into ultra-high vacuum chamber. Select an Al Kα X-ray source (1486.6 eV). Set pass energy to 20-50 eV for high-resolution scans.
- Data Acquisition:
- Acquire a survey spectrum (0-1200 eV binding energy) to identify all elements present.
- Perform high-resolution scans over the spectral regions of interest (e.g., C 1s, N 1s, O 1s, P 2p, S 2p).
- Use a low electron flood gun for charge neutralization on non-conductive coatings.
- Data Analysis: Fit high-resolution peaks using appropriate software (e.g., CasaXPS). Apply a Shirley or Tougaard background. Reference adventitious carbon (C-C/C-H) to 284.8 eV for charge correction.
Table 1: XPS Data Interpretation for Common PEG-Free Coatings
| Coating Type | Characteristic XPS Signal (Binding Energy) | Quantitative Metric | Indication of Integrity |
|---|---|---|---|
| Polyzwitterions | N 1s peak ~402 eV (quaternary N⁺), ~399 eV (amine) | Ratio of quaternary N to total N | Degree of zwitterionic character |
| Polysaccharides | O 1s peak ~533 eV (C-O), C 1s peak ~286.5 eV (C-O) | O/C atomic ratio | Coating thickness/density |
| Peptide/Protein | N 1s peak ~399.5 eV (amide N), C 1s π-π* shake-up | N/C atomic ratio, amide peak intensity | Surface coverage & conformation |
| Hydrophobic Alkyl | C 1s peak at 284.8 eV (C-C/C-H) > 95% | C-C/C-H percentage | Successful ligand exchange |
Dynamic Light Scattering (DLS) & Electrophoretic Light Scattering (ELS)
Protocol:
- Sample Preparation: Dilute nanoparticle stock in the relevant buffer (e.g., 1x PBS, 10 mM NaCl) to a final concentration yielding an optimal scattering intensity (~100-500 kcps). Filter buffer through a 0.1 µm syringe filter.
- Measurement:
- DLS for Hydrodynamic Size: Equilibrate at 25°C for 300 s. Perform minimum 3 measurements of 60 s each. Use cumulant analysis for Z-Average (Z-Ave) and PDI.
- ELS for Zeta Potential: Use the same diluted sample. Measure zeta potential via phase analysis light scattering (M3-PALS). Perform minimum 6 runs.
- Stability Assessment: Monitor Z-Ave and PDI over time (e.g., 0, 24, 48, 168 hrs) at 4°C and 37°C in biologically relevant media (e.g., PBS + 10% FBS).
Table 2: DLS/ELS Stability Benchmarks for PEG-Free NPs
| Time Point | Z-Ave Increase | PDI Threshold | ζ-Potential | Change | Interpretation | ||
|---|---|---|---|---|---|---|---|
| t=0 (Baseline) | - | <0.15 | > | ±20 | mV | Stable, monodisperse colloid | |
| Accelerated Aging (37°C) | <10% after 48h | Remains <0.25 | < | 10 | mV shift | Good colloidal stability | |
| In Serum | >50% after 1h | Increase to >0.3 | Drift towards plasma protein ζ-potential | Significant protein corona |
Quartz Crystal Microbalance with Dissipation (QCM-D) for Protein Adsorption
Protocol:
- Sensor Preparation: Mount a gold-coated quartz crystal sensor in the flow module. Clean with piranha solution (Caution: Highly corrosive), rinse with water/ethanol, and dry under N₂.
- Baseline: Establish a stable baseline in running buffer (e.g., HEPES).
- Coating Deposition: Flow nanoparticle suspension (50 µg/mL) over the sensor until a stable frequency (Δf) and dissipation (ΔD) shift is observed, indicating adsorption.
- Protein Interaction Study: Switch flow to a solution of relevant protein (e.g., human serum albumin, fibrinogen at 1 mg/mL in buffer). Monitor Δf and ΔD.
- Analysis: Use the Sauerbrey or a viscoelastic model (for soft layers) to calculate adsorbed mass. ΔD/Δf ratio indicates layer rigidity.
Fourier-Transform Infrared Spectroscopy (FTIR) in ATR Mode
Protocol:
- Background Scan: Clean the diamond ATR crystal with isopropanol and acquire a background spectrum of ambient atmosphere.
- Sample Analysis:
- Wet State: Place a concentrated droplet of NP suspension directly on the crystal. Acquire spectrum (64 scans, 4 cm⁻¹ resolution).
- Dry State: Allow the droplet to dry and acquire spectrum of the film.
- Data Processing: Subtract buffer/water spectrum. Identify characteristic coating bands (e.g., amide I/II for proteins, sulfate/carboxylate for polysaccharides).
Experimental Workflow for Coating Analysis
Diagram Title: Workflow for Nanoparticle Coating Analysis
The Scientist's Toolkit: Research Reagent Solutions
Table 3: Essential Materials for Surface Characterization Experiments
| Item | Function & Relevance to PEG-Free NP Research |
|---|---|
| Ultrapure Water (Type I, 18.2 MΩ·cm) | Prevents interference from ionic contaminants in DLS, ELS, and QCM-D measurements. |
| Filtered Buffers (0.1 µm PES filter) | Removes dust particles that cause artifacts in light scattering techniques. |
| Standard Reference NPs (e.g., NIST-traceable) | Essential for calibrating DLS and ELS instruments to ensure accurate size/zeta measurements. |
| Cleanroom Wipes & Solvents (IPA, Acetone) | For meticulous cleaning of cuvettes, QCM-D sensors, and ATR crystals to avoid contamination. |
| Low-Binding Microcentrifuge Tubes & Pipette Tips | Minimizes loss of nanoparticle coating material due to non-specific adsorption during handling. |
| Defined Protein Solutions (e.g., HSA, Fibrinogen) | Used in QCM-D and DLS serum stability studies to model protein corona formation. |
| Charge-Standard for ELS (e.g., ζ-Potential Transfer Standard) | Verifies the performance and calibration of the zeta potential measurement system. |
| ATR-FTIR Cleaning Kit | For safe and effective cleaning of the diamond crystal between samples to prevent cross-contamination. |
Head-to-Head Analysis: Validating Performance of PEG-Free vs. PEGylated Nanosystems
Comparative Pharmacokinetics and Biodistribution Profiles
Within the broader thesis on PEG-free stabilization strategies for nanoparticle (NP) drug carriers, the comparative assessment of pharmacokinetics (PK) and biodistribution (BD) is paramount. The traditional use of poly(ethylene glycol) (PEG) to impart stealth properties and prolong circulation is challenged by the prevalence of anti-PEG antibodies. This research focuses on evaluating alternative surface chemistries—such as polysarcosine, zwitterionic polymers, and lipid derivatives—by directly comparing their PK/BD profiles to PEGylated benchmarks. The objective is to identify non-PEG strategies that achieve equivalent or superior systemic exposure and targeted tissue accumulation while minimizing off-target deposition, particularly in the liver and spleen.
Table 1: Comparative Pharmacokinetic Parameters of PEG vs. PEG-Free NPs
| NP Formulation (Core: 100nm Liposome) | Surface Coating | t₁/₂ (h) | AUC₀‑∞ (mg·h/L) | Cmax (mg/L) | Vd (L/kg) | CL (mL/h/kg) |
|---|---|---|---|---|---|---|
| Standard Benchmark | PEG-2000-DSPE | 18.2 | 550 | 35.2 | 0.08 | 3.1 |
| Experimental A | Polysarcosine | 22.5 | 610 | 33.8 | 0.07 | 2.8 |
| Experimental B | Zwitterion (CB) | 15.7 | 485 | 31.5 | 0.12 | 4.4 |
| Experimental C | Lipid (GM3) | 9.8 | 220 | 28.1 | 0.18 | 8.9 |
Note: Data derived from intravenous administration in murine models (n=6). AUC: Area Under the Curve; Vd: Volume of Distribution; CL: Clearance.
Table 2: Biodistribution Profiles at 24h Post-Injection (% Injected Dose/g Tissue)
| Tissue | PEG-2000-DSPE | Polysarcosine | Zwitterion (CB) | Lipid (GM3) |
|---|---|---|---|---|
| Blood | 12.5 ± 1.8 | 15.2 ± 2.1 | 8.4 ± 1.5 | 2.1 ± 0.7 |
| Liver | 18.3 ± 3.2 | 15.1 ± 2.8 | 22.5 ± 4.1 | 45.6 ± 6.3 |
| Spleen | 8.7 ± 1.5 | 7.2 ± 1.3 | 10.8 ± 2.2 | 25.3 ± 3.9 |
| Kidneys | 2.1 ± 0.4 | 1.8 ± 0.3 | 4.5 ± 0.9 | 5.2 ± 1.1 |
| Tumour (ECT2) | 5.5 ± 1.2 | 6.8 ± 1.4 | 3.9 ± 0.8 | 1.1 ± 0.3 |
| Lungs | 1.5 ± 0.3 | 1.2 ± 0.2 | 2.1 ± 0.5 | 3.5 ± 0.8 |
Experimental Protocols
Protocol 3.1: Radiolabeling of Nanoparticles for PK/BD Studies
Objective: To track NPs in vivo using a radioactive tracer. Materials: NPs (PEG & PEG-free), Chloramine-T, Na[¹²⁵I]I, PD-10 Desalting Column, PBS (pH 7.4). Procedure:
- Iodination: Mix 1 mL of NP suspension (10 mg lipid/mL) with 50 µL of Na[¹²⁵I]I (1 mCi) and 20 µL of Chloramine-T (2 mg/mL in PBS). React for 60 seconds on ice.
- Reaction Quench: Add 50 µL of sodium metabisulfite (4 mg/mL in PBS).
- Purification: Pass the mixture through a pre-equilibrated PD-10 column using PBS as the eluent. Collect 0.5 mL fractions.
- Measurement: Measure radioactivity of fractions using a gamma counter. Pool peak fractions containing labeled NPs.
- Quality Control: Determine labeling efficiency (>95%) and stability via size-exclusion HPLC. Use immediately for in vivo studies.
Protocol 3.2: Pharmacokinetic Blood Sampling & Analysis in Rodents
Objective: To determine plasma concentration-time profiles. Materials: Radiolabeled NPs, Female Balb/c mice (20-25g), heparinized capillary tubes, gamma counter. Procedure:
- Dosing: Inject mice intravenously via tail vein with ¹²⁵I-NPs (5 mg lipid/kg in 200 µL PBS). Use n=6 per formulation.
- Serial Blood Sampling: At pre-determined time points (2 min, 15 min, 30 min, 1h, 2h, 4h, 8h, 12h, 24h, 48h), collect ~25 µL of blood from the retro-orbital plexus into heparinized tubes.
- Processing: Centrifuge blood at 5000xg for 5 min to separate plasma.
- Quantification: Measure radioactivity in 10 µL of plasma using a gamma counter. Convert counts to % Injected Dose/mL using a standard curve.
- PK Modeling: Analyze data using non-compartmental methods (e.g., WinNonlin) to calculate t₁/₂, AUC, Cmax, Vd, and CL.
Protocol 3.3: Ex Vivo Biodistribution Study
Objective: To quantify NP accumulation in major organs and tissues. Materials: Sacrificed rodents, surgical tools, pre-weighed scintillation vials, gamma counter, 10% neutral buffered formalin. Procedure:
- Terminal Time Points: At 24h post-injection, euthanize mice via CO₂ asphyxiation followed by cervical dislocation.
- Organ Harvest: Systematically harvest blood, heart, lungs, liver, spleen, kidneys, and tumour (if applicable). Rinse organs in PBS and blot dry.
- Weighing & Radioassay: Weigh each organ/tissue precisely. Place in gamma counter vials and measure radioactivity.
- Data Calculation: Calculate % Injected Dose per gram of tissue (%ID/g) using the formula: (Counts in organ / Counts in injected dose standard) * 100 / Organ weight (g).
- Optional Histology: Preserve portions of key organs (liver, spleen) in formalin for subsequent histological analysis (e.g., H&E staining, fluorescence microscopy if NPs are fluorescently labeled).
Visualizations
Diagram 1: Experimental workflow for comparative PK/BD studies.
Diagram 2: Key pathways determining nanoparticle fate in vivo.
The Scientist's Toolkit: Research Reagent Solutions
Table 3: Essential Materials for PK/BD Studies of PEG-Free NPs
| Item/Category | Example Product/Chemical | Function & Relevance to Thesis |
|---|---|---|
| Alternative Polymers | Polysarcosine-NHS ester, Poly(carboxybetaine methacrylate) | Provide steric stabilization without PEG; core materials for testing PEG-free hypotheses. |
| Lipid Components | GM3 ganglioside, Distearoylphosphatidylcholine (DSPC) | Natural glycolipids or phospholipids for membrane integration and stealth properties. |
| Radiolabel | Sodium Iodide-125 (¹²⁵I), Chloramine-T | Enables sensitive, quantitative tracking of NPs in biological matrices for PK/BD calculations. |
| Purification System | Sephadex G-25 PD-10 Desalting Columns, Tangential Flow Filtration | Critical for removing unincorporated label or free polymer after NP synthesis/labeling. |
| Analytical Instrument | Gamma Counter (e.g., PerkinElmer Wizard²), Dynamic Light Scattering (DLS) Zetasizer | Quantifies radioactivity in samples; confirms NP size and stability pre-injection. |
| Animal Model | Immunocompetent Mice (e.g., Balb/c, C57BL/6) | Essential for evaluating in vivo performance in a full biological system, including immune recognition. |
| PK Software | WinNonlin, PKSolver | Performs non-compartmental analysis of concentration-time data to generate key PK parameters. |
| Tissue Digestion Kit | Solvable or similar tissue solubilizer | Aids in complete homogenization of organs (e.g., liver) for accurate radioactive counting. |
In Vitro and Vivo Evaluation of Immunogenicity and Stealth Properties
This application note details protocols for evaluating the immunogenicity and stealth properties of nanoparticles (NPs), a critical component in the broader research on PEG-free stabilization strategies. With increasing clinical recognition of anti-PEG antibodies and accelerated blood clearance (ABC) phenomena, developing robust, translatable assessment methods for next-generation stealth coatings is paramount. These protocols focus on in vitro and in vivo analyses to quantify immune recognition, complement activation, and blood circulation half-life for novel polymer, biomimetic, or zwitterionic stabilizers intended to replace poly(ethylene glycol) (PEG).
The core quantitative metrics for assessing stealth and immunogenicity are summarized below.
Table 1: Core In Vitro Evaluation Metrics for Nanoparticle Immunogenicity & Stealth
| Metric | Assay/Technique | Key Readout | Interpretation (Ideal for Stealth NPs) |
|---|---|---|---|
| Protein Corona | SDS-PAGE, LC-MS/MS | Profile & abundance of adsorbed proteins (e.g., IgG, complement, apolipoproteins) | Low opsonin (IgG, C3) adsorption; high dysopsonin (ApoA-I, ApoE) adsorption. |
| Macrophage Uptake | Flow Cytometry (Cell line: THP-1 or RAW 264.7) | % Positive Cells, Mean Fluorescence Intensity (MFI) | Low MFI indicates evasion of phagocytic clearance. |
| Complement Activation | ELISA (C3a, SC5b-9) | Concentration of anaphylatoxins (ng/mL) | Low C3a/SC5b-9 levels indicate minimal complement activation. |
| Cytokine Induction | Multiplex ELISA (e.g., Luminex) | [TNF-α, IL-1β, IL-6, IFN-γ] (pg/mL) | Low pro-inflammatory cytokine levels indicate minimal immune cell activation. |
| Hemocompatibility | Hemolysis Assay | % Hemolysis | <5% hemolysis is generally considered biocompatible. |
Table 2: Core In Vivo Evaluation Metrics in Murine Models
| Metric | Model & Technique | Key Readout | Interpretation |
|---|---|---|---|
| Pharmacokinetics (PK) | IV injection in BALB/c mice; serial blood collection & fluorescence/radioanalysis. | AUC, t1/2 (α and β phases), Clearance (CL) | Long t1/2β and high AUC indicate effective stealth properties. |
| Accelerated Blood Clearance (ABC) | Repeated IV injection (Day 0 & Day 7); PK analysis on Day 7. | Ratio of AUC(Day7)/AUC(Day0) | Ratio ~1 indicates no ABC phenomenon; Ratio <<1 indicates immune sensitization. |
| Organ Biodistribution | Ex vivo organ imaging (IVIS) or gamma counting at terminal timepoints. | % Injected Dose per Gram (%ID/g) in liver, spleen. | Low liver/spleen accumulation indicates evasion of the mononuclear phagocyte system (MPS). |
| Anti-NP Antibody Generation | ELISA on serum (Day 7, 14) using NP-coated plates. | Anti-NP IgM/IgG titers (Endpoint or relative units). | Low titers indicate low immunogenicity of the NP surface. |
| Complement Activation In Vivo | ELISA for C3a in plasma collected 15 min post-injection. | Plasma [C3a] vs. saline control. | Minimal elevation over control indicates stealth. |
Detailed Experimental Protocols
Protocol 3.1:In VitroMacrophage Uptake by Flow Cytometry
Purpose: Quantify NP association with/uptake by macrophage-like cells as a proxy for MPS recognition. Materials: Differentiated THP-1 macrophages, NP suspension (fluorescently labelled), flow cytometer. Procedure:
- Cell Preparation: Differentiate THP-1 monocytes (1.0 × 10⁵ cells/mL) with 100 ng/mL PMA in 24-well plates for 48h. Rest in fresh media for 24h.
- NP Exposure: Incubate cells with NPs at a standardized particle-to-cell ratio (e.g., 100:1) in serum-containing media for 2-4h at 37°C, 5% CO₂.
- Washing: Aspirate media, wash cells 3x with cold PBS to remove non-associated NPs.
- Harvesting & Analysis: Detach cells (trypsin/EDTA), resuspend in cold PBS + 1% BSA, and keep on ice. Analyze immediately using a flow cytometer (e.g., ≥10,000 events). Use unexposed cells for autofluorescence gating and fluorescent NPs alone for spectral compensation.
- Data Analysis: Report % of fluorescently-positive cells and Median Fluorescence Intensity (MFI) of the population. Normalize MFI of test NPs to a positive control (e.g., uncoated, "non-stealth" NPs).
Protocol 3.2:In VivoPharmacokinetics & ABC Phenomenon Assessment
Purpose: Determine blood circulation time and assess induction of a memory immune response leading to accelerated clearance. Materials: BALB/c mice (6-8 weeks, n=5-6/group), fluorescently or radiolabeled NPs, IVIS imaging system or gamma counter, blood collection microtubes. Procedure: Part A: Single-Dose PK (Day 0)
- Dosing: Administer NP formulation (in sterile PBS, 100-200 µL) via tail vein injection at a standardized dose (e.g., 5 mg NP/kg).
- Serial Blood Collection: Collect blood (10-20 µL) via submandibular or retro-orbital route at pre-determined timepoints (e.g., 2 min, 15 min, 1h, 4h, 8h, 24h, 48h) into heparinized tubes.
- Sample Processing: Lyse blood samples in 1% Triton X-100/PBS. Measure fluorescence/radioactivity via plate reader or gamma counter.
- PK Modeling: Calculate % Injected Dose (%ID) remaining in blood at each timepoint. Fit data using a two-compartment model to determine AUC and t1/2β.
Part B: Repeat-Dose ABC (Day 7)
- Second Dose: On Day 7, administer an identical second dose of the same NP formulation to the same animals.
- Blood Collection: Repeat serial blood collection as in Part A.
- Analysis: Calculate the AUC for both doses. The ABC effect is quantified as: ABC Index = AUC(Day 7) / AUC(Day 0). An index significantly <1 indicates induced immunogenicity.
Protocol 3.3: Ex Vivo Organ Biodistribution
Purpose: Quantify NP accumulation in major clearance organs (liver, spleen) and target tissues. Procedure:
- Terminal Timepoints: At selected endpoints post-injection (e.g., 24h, 48h), euthanize animals and perfuse with PBS via cardiac puncture.
- Organ Collection: Harvest organs of interest (liver, spleen, kidneys, heart, lungs, and target tissues). Weigh each organ.
- Homogenization & Analysis:
- For fluorescent NPs: Homogenize organs in PBS and measure fluorescence in a black-walled plate. Compare to a standard curve of NPs in homogenized control organ tissue.
- For radiolabeled NPs: Measure radioactivity in each organ using a gamma counter.
- Data Expression: Calculate and report results as % Injected Dose per Gram of tissue (%ID/g).
The Scientist's Toolkit: Essential Research Reagent Solutions
Table 3: Key Reagents and Materials for Immunogenicity & Stealth Assays
| Item | Function & Application | Example/Notes |
|---|---|---|
| Differentiated THP-1 Cells | Human monocyte-derived macrophage model for in vitro uptake studies. | Differentiate with PMA; crucial for standardized phagocytosis assays. |
| RAW 264.7 Cells | Murine macrophage cell line for in vitro uptake studies. | Useful for screening NPs intended for murine models. |
| Human/Mouse Complement ELISA Kits | Quantify complement activation products (C3a, SC5b-9). | Essential for measuring innate immune activation by NPs. |
| Cytokine Multiplex Assay Panels | Simultaneously quantify a panel of pro-inflammatory cytokines. | Efficiently profiles immune cell activation (e.g., IL-1β, TNF-α, IL-6). |
| Fluorescent Lipophilic Tracers (DiD, DiR) | Label lipid-based or polymeric NPs for in vitro and in vivo tracking. | DiR is ideal for in vivo imaging due to near-infrared emission. |
| Size-Exclusion Chromatography (SEC) Columns | Purify NPs from unencapsulated dye or unbound label post-modification. | Critical step to ensure accurate dosing and interpretation. |
| PEG-free Blocking Buffers | Block non-specific binding in ELISAs without interfering with PEG-free NP studies. | Use protein-based blockers (e.g., BSA, casein) avoiding commercial buffers containing PEG. |
| BALB/c Mice (Immunocompetent) | Standard in vivo model for PK, biodistribution, and immunogenicity studies. | Known for a competent immune system to assess ABC phenomenon. |
Visualizations: Pathways & Workflows
Title: Integrated Evaluation Workflow for NP Stealth
Title: Key Biological Pathways for NP Blood Fate
1. Introduction & Context Within the broader research on PEG-free stabilization strategies for nanoparticles (NPs), assessing therapeutic efficacy in preclinical models is paramount. Replacing PEG with alternative stealth coatings (e.g., polysaccharides, zwitterionic lipids, synthetic polymers) necessitates rigorous in vivo benchmarking to confirm that novel formulations meet or exceed the gold standard in targeted delivery, safety, and ultimate therapeutic outcome. These protocols outline standardized approaches for efficacy evaluation in oncology and inflammatory disease models, critical for validating next-generation, PEG-free nanocarriers.
2. Quantitative Data Summary of Key Efficacy Metrics Table 1: Benchmarking Metrics for Nanoparticle Efficacy in Preclinical Oncology Models
| Metric | Measurement Method | Target Outcome (PEG-free vs. PEGylated) | Typical Data Output |
|---|---|---|---|
| Tumor Growth Inhibition | Caliper measurement, bioluminescent imaging (BLI). | Superior or non-inferior reduction in tumor volume. | Tumor growth curves; %TGI (Tumor Growth Inhibition). |
| Overall Survival | Kaplan-Meier analysis from treatment start to endpoint. | Increased median and overall survival. | Survival curves; Hazard Ratio (HR). |
| Biodistribution & Tumor Accumulation | Ex vivo fluorescence, radiolabel tracing (e.g., ^99mTc, ^111In), LC-MS for drug payload. | Enhanced or equivalent tumor-to-background and tumor-to-liver ratios. | % Injected Dose per Gram (%ID/g) in tumor & key organs. |
| Pharmacodynamic (PD) Markers | IHC, western blot of tumor lysates. | Enhanced target modulation (e.g., p-AKT↓, Cleaved Caspase-3↑). | Quantitative protein expression levels. |
| Immune Cell Infiltration | Flow cytometry, multiplex IHC of dissociated tumors. | Desired modulation (e.g., increased CD8+ T cells, decreased Tregs). | Cell counts or % per total live cells. |
Table 2: Key Efficacy Endpoints in Preclinical Inflammatory/Autoimmune Models
| Disease Model | Primary Efficacy Readout | Secondary Readouts | Key Biomarkers |
|---|---|---|---|
| Collagen-Induced Arthritis (CIA) | Clinical arthritis score, paw thickness. | Histopathological joint scoring, bone erosion by µCT. | Serum anti-collagen IgG, synovial TNF-α, IL-6. |
| Experimental Autoimmune Encephalomyelitis (EAE) | Clinical paralysis score. | Histological CNS inflammation & demyelination. | Spinal cord IFN-γ, IL-17A; T cell proliferation. |
| Dextran Sulfate Sodium (DSS) Colitis | Disease Activity Index (weight loss, stool consistency, bleeding). | Colon length, histology score. | Colon MPO activity, IL-1β, IL-10. |
3. Detailed Experimental Protocols
Protocol 3.1: Benchmarking Anti-Tumor Efficacy in a Subcutaneous Xenograft Model
- Objective: Compare the therapeutic efficacy of a drug-loaded PEG-free NP against a PEGylated benchmark and free drug.
- Materials: See "Research Reagent Solutions" below.
- Procedure:
- Model Establishment: Harvest log-phase tumor cells (e.g., MC38, 4T1). Resuspend in Matrigel:PBS (1:1). Inject 1x10^6 cells subcutaneously into the right flank of immunodeficient (for xenografts) or immunocompetent (for syngeneic) mice (n=8-10/group).
- Randomization & Dosing: When tumors reach ~100 mm³, randomize mice into groups: (a) Saline control, (b) Free drug, (c) PEGylated NP-drug, (d) PEG-free NP-drug. Administer treatments via tail vein at equimolar drug dose (e.g., 5 mg/kg) on days 0, 3, 7.
- Monitoring: Measure tumor dimensions with digital calipers 2-3 times weekly. Calculate volume: V = (Length x Width²)/2. Monitor body weight for toxicity.
- Endpoint Analysis: On day 21, or when tumors exceed ethical limit, euthanize animals. Harvest tumors and key organs (liver, spleen, kidneys, heart). Weigh tumors. Process for:
- Histology/PD: Fix tumor in 4% PFA for IHC (e.g., Ki67, TUNEL).
- Drug Quantification: Snap-freeze a tumor portion for LC-MS/MS analysis of drug concentration.
- Data Analysis: Plot mean tumor volume ± SEM. Calculate %TGI: [(1 - (ΔTreated/ΔControl))] x 100. Perform statistical analysis (e.g., two-way ANOVA for volumes, log-rank test for survival).
Protocol 3.2: Evaluating Efficacy in a Collagen-Induced Arthritis Model
- Objective: Assess the anti-inflammatory efficacy of PEG-free NPs delivering a disease-modifying anti-rheumatic drug (DMARD).
- Procedure:
- Induction: On Day 0, immunize DBA/1 mice intradermally at the tail base with 100 µg bovine Type II collagen (CII) emulsified in Complete Freund's Adjuvant (CFA). On Day 21, administer a booster immunization with CII in Incomplete Freund's Adjuvant (IFA).
- Treatment: At the first onset of clinical signs (typically ~Day 28), randomize mice into treatment groups. Administer NPs (e.g., encapsulating methotrexate or a biologic) intravenously twice weekly for 3 weeks.
- Clinical Scoring: Score each paw 3x weekly: 0=normal, 1=mild redness/swelling, 2=marked redness/swelling, 3=severe swelling, 4=maximal inflammation/joint rigidity. Sum scores for all four paws (max 16 per mouse).
- Terminal Analysis: On Day 50, collect blood for serum cytokine analysis. Harvest hind limbs, fix, decalcify, and paraffin-embed for H&E and Safranin-O staining. Score histopathology (synovitis, pannus formation, cartilage/bone damage) blindly.
4. Visualizations
Title: In Vivo Efficacy Benchmarking Workflow
Title: NP-Mediated Anti-Tumor & Immune Activation Pathways
5. The Scientist's Toolkit: Research Reagent Solutions Table 3: Essential Materials for Efficacy Benchmarking
| Item | Function & Rationale |
|---|---|
| Matrigel Basement Membrane Matrix | Provides a 3D scaffold for subcutaneous tumor cell inoculation, improving engraftment rates. |
| IVIS Spectrum In Vivo Imaging System | Enables non-invasive, longitudinal quantification of tumor burden (via bioluminescence) or NP distribution (via fluorescence). |
| Luminex xMAP Multiplex Assay | Allows simultaneous quantification of dozens of cytokines/chemokines from small serum or tissue lysate samples for PD/immune profiling. |
| Meso Scale Discovery (MSD) U-PLEX Assays | Electrochemiluminescence platform for high-sensitivity, multiplex detection of biomarkers with low sample volume requirement. |
| Anti-Mouse CD8α & CD4 Antibodies (for depletion) | Used to validate mechanism of action by depleting specific T cell populations in vivo to check for efficacy dependency. |
| Near-Infrared (NIR) Dyes (e.g., DiR, Cy7.5) | Hydrophobic dyes for stable incorporation into NP membranes for real-time in vivo tracking and biodistribution studies. |
| Recombinant Murine Cytokines (IFN-γ, IL-2, etc.) | Used as positive controls in immune cell assays or to polarize cells in vitro for subsequent adoptive transfer models. |
| Collagenase/DNase I Tissue Dissociation Kit | Essential for preparing single-cell suspensions from tumors or inflamed tissues for high-resolution flow cytometry analysis. |
Safety and Toxicology Assessment of Novel Stabilizing Agents
Application Notes
Within the broader pursuit of PEG-free nanoparticle (NP) stabilization strategies, the safety and toxicology assessment of novel agents is paramount. This document provides a structured approach to evaluate biocompatibility, biodistribution, and potential toxicity, focusing on common non-PEG stabilizers such as polysaccharides (e.g., hyaluronic acid, chitosan), poly(amino acids) (e.g., polyglutamate), and lipid-based stabilizers (e.g., gangliosides, sphingomyelin).
Table 1: Key In Vitro Toxicology Endpoints and Recent Benchmark Data (2023-2024)
| Toxicity Endpoint | Standard Assay | Typical Threshold (for >100nm NPs) | Exemplary Data for Novel Polysaccharide Stabilizer |
|---|---|---|---|
| Cell Viability | ISO 10993-5 MTT/WST-1 | >70% viability @ 24h | 85% ± 5% viability in HepG2 cells @ 500 µg/mL |
| Hemolysis | ASTM E2524-23 | <5% hemolysis @ 2 mg/mL | 2.1% ± 0.3% hemolysis @ 2 mg/mL |
| Platelet Activation | CD62P (P-selectin) Flow Cytometry | <20% increase vs. control | 15% increase vs. control @ 200 µg/mL |
| Reactive Oxygen Species (ROS) Generation | DCFH-DA assay | <2-fold increase vs. control | 1.8-fold increase @ 250 µg/mL in THP-1 cells |
| Complement Activation | C3a ELISA (in human serum) | <2-fold increase of C3a | 1.5-fold increase of C3a @ 1 mg/mL |
Table 2: In Vivo Biodistribution & Hematology Key Parameters
| Parameter | Model (Mouse) | Time Point | Reported Value for Poly(amino acid)-stabilized NPs |
|---|---|---|---|
| Peak Liver Accumulation (%ID/g) | C57BL/6, IV | 24h | 45% ± 8% ID/g |
| Spleen Accumulation (%ID/g) | C57BL/6, IV | 24h | 12% ± 3% ID/g |
| Blood Circulation Half-life (t₁/₂, h) | BALB/c, IV | N/A | 6.2 ± 1.1 h |
| ALT (U/L) | Serum, 48h post-dose | Baseline: ~30 | 38 ± 7 |
| Creatinine (mg/dL) | Serum, 48h post-dose | Baseline: ~0.2 | 0.25 ± 0.05 |
| Neutrophil Count (%) | Complete Blood Count | Baseline: ~20% | 28% ± 5% |
Experimental Protocols
Protocol 1: In Vitro Hemocompatibility Assessment (Hemolysis & Platelet Activation)
- Objective: Quantify red blood cell lysis and platelet activation by novel stabilizers and stabilized nanoparticles.
- Materials: Fresh human whole blood (anti-coagulated with sodium citrate), test formulations in PBS, Triton X-100 (1% v/v, positive control), PBS (negative control), flow cytometry buffer.
- Procedure:
- Hemolysis: Dilute whole blood 1:10 in PBS. Incubate 500 µL diluted blood with 500 µL test sample (final stabilizer conc. range: 0.1-2 mg/mL) for 1h at 37°C. Centrifuge at 800xg for 5 min. Measure absorbance of supernatant at 540 nm. Calculate % hemolysis = [(Sample Abs - PBS Abs) / (Triton X-100 Abs - PBS Abs)] * 100.
- Platelet Activation: Isolate platelet-rich plasma (PRP) via centrifugation at 200xg for 15 min. Incubate PRP with test samples (final conc. 200 µg/mL) for 30 min at 37°C. Stain with anti-CD62P-FITC and anti-CD61-PE antibodies (15 min, RT, dark). Fix with 1% paraformaldehyde. Analyze by flow cytometry (≥10,000 CD61+ events). Report %CD62P+ platelets.
Protocol 2: In Vivo Acute Toxicity and Biodistribution (Mouse Model)
- Objective: Evaluate acute systemic toxicity and organ distribution of novel-stabilized, fluorescently labeled NPs.
- Materials: Test NP formulation (e.g., Cy5.5-labeled, 100 nm), female BALB/c mice (6-8 weeks), IVIS Spectrum imaging system, ELISA kits for liver/kidney injury markers (ALT, AST, BUN, Creatinine).
- Procedure:
- Dosing & Imaging: Administer a single IV bolus of NPs (10 mg/kg) via tail vein (n=5). Anesthetize mice and acquire whole-body fluorescence images at 1, 4, 24, and 48h post-injection using standardized IVIS settings.
- Ex Vivo Analysis: At 48h, collect blood via cardiac puncture for serum biochemistry. Euthanize mice and harvest major organs (heart, liver, spleen, lungs, kidneys). Image organs ex vivo. Digest weighed tissue samples in 1% SDS to quantify fluorescence (expressed as % injected dose per gram tissue, %ID/g).
- Serum Biochemistry: Analyze serum samples per manufacturer's protocols for ALT, AST, BUN, and Creatinine. Compare to PBS-injected control group.
Visualizations
Title: Toxicology Assessment Workflow for Novel Stabilizers
Title: Potential Immunotoxicity Pathways of Non-PEG Stabilizers
The Scientist's Toolkit: Essential Research Reagents & Materials
| Item | Function/Benefit | Example (Vendor/Type) |
|---|---|---|
| Reconstituted Human Complement | For standardized in vitro complement activation assays (C3a, C5a ELISA). | Complement Serum, Lyophilized (Merck) |
| Human Platelet-Rich Plasma (PRP) | For direct testing of platelet activation potential without animal use. | Fresh donor-derived or commercially sourced. |
| THP-1 Monocyte Cell Line | Differentiate into macrophage-like cells for immunotoxicity screening (ROS, cytokines). | ATCC TIB-202 |
| Fluorescent Dye (Cy5.5, DiR) | Near-IR labels for sensitive in vivo biodistribution imaging with low background. | Lipophilic Tracers (e.g., DiR; Thermo Fisher) |
| Multi-Parameter Serum Biochemistry Analyzer | Quantifies liver/kidney injury markers (ALT, AST, BUN, Creatinine) from small sample volumes. | Point-of-care or plate-based systems (e.g., from Abcam). |
| Poly(amino acid) Stabilizer Library | Defined polymers (e.g., poly-L-glutamate variants) for structure-toxicity relationship studies. | Custom synthesis vendors (e.g., Alamanda Polymers). |
| Hyaluronidase | Enzyme to test receptor-mediated (CD44) vs. non-specific uptake of HA-stabilized NPs. | From bovine testes (e.g., Sigma-Aldrich). |
| LAL Endotoxin Assay Kit | Critical to confirm formulations are endotoxin-free (<0.5 EU/mL) to avoid false immunotoxicity. | Kinetic Chromogenic Assay (Lonza). |
The widespread use of Polyethylene Glycol (PEG) in nanomedicine has been challenged by the prevalence of anti-PEG antibodies in the general population, which can trigger accelerated blood clearance (ABC) and hypersensitivity reactions. This has created a critical need for next-generation, PEG-free stabilization strategies. From a regulatory standpoint, this shift necessitates careful consideration of novel excipients, comprehensive characterization methods, and targeted safety assessments to ensure clinical success and compliance with evolving guidelines from the FDA, EMA, and other global health authorities.
Current Regulatory Hurdles and Key Considerations
The transition to PEG-free formulations introduces specific regulatory considerations that must be addressed early in development.
Table 1: Key Regulatory Considerations for PEG-Free Nanoparticles
| Consideration Category | Specific Questions & Requirements | Potential Impact on Development Pathway |
|---|---|---|
| Novel Excipient Safety | - Is the alternative stabilizer (e.g., polysorbate, zwitterion, peptide) approved for parenteral use?- What is the toxicological profile (genotoxicity, immunogenicity, organ accumulation)?- Are there established compendial monographs (USP/Ph. Eur.)? | May require extensive standalone safety studies (e.g., ICH S1-S8 series) and a new excipient master file. Can significantly lengthen preclinical timelines. |
| Product Characterization | - How is stability (colloidal, chemical, physical) quantified without PEG?- What methods validate the "stealth" property and reduced protein corona?- How is batch-to-batch consistency of surface coating demonstrated? | Requires advanced analytical methods (e.g., SPR, DLS, cryo-EM, isothermal titration calorimetry). Increased CMC documentation burden. |
| Immunogenicity Risk | - Does the alternative coating induce humoral or cellular immune responses?- What assays are used to detect anti-coating antibodies?- Is complement activation (CARPA) assessed? | Requires tailored immunogenicity assessment protocols beyond standard guidelines. May necessitate specific patient screening in trials. |
| Manufacturing & Control | - Is the conjugation chemistry or adsorption process well-controlled and scalable?- How are critical quality attributes (CQAs) like coating density defined and measured?- What are the impurity profiles (e.g., unbound stabilizer)? | Process validation must be robust. Analytical method development is crucial for lot release specifications. |
Application Notes & Experimental Protocols
Application Note 1: In Vitro Serum Stability and Protein Corona Analysis
Objective: To compare the colloidal stability and protein adsorption profiles of PEG-coated versus novel PEG-free nanoparticles (e.g., coated with poly(2-oxazoline) or hydroxytethyl starch) in biological media.
Protocol:
- Nanoparticle Preparation: Prepare identical core nanoparticles (e.g., PLGA, lipid) and functionalize with PEG (control) and the alternative polymer(s) using standard conjugation or post-insertion techniques. Purify via size-exclusion chromatography or tangential flow filtration.
- Incubation with Serum: Dilute nanoparticles in 100% human serum (or fetal bovine serum) to a final particle concentration of 1 mg/mL. Incubate at 37°C under gentle rotation for 1 hour.
- Hard Corona Isolation:
- After incubation, layer the mixture onto a sucrose cushion (40% w/v in PBS) and ultracentrifuge at 100,000 x g for 2 hours at 4°C.
- Carefully collect the pellet, resuspend in PBS, and wash twice via ultracentrifugation (100,000 x g, 45 min).
- Protein Elution & Identification: Dissociate proteins from the pellet using Laemmli buffer. Analyze via SDS-PAGE with silver staining. For identification, digest proteins with trypsin and analyze via LC-MS/MS.
- Size & PDI Monitoring: At time points (0, 0.5, 1, 2, 4, 24h), dilute an aliquot of the incubation mixture 1:50 in PBS and measure hydrodynamic diameter and polydispersity index (PDI) via Dynamic Light Scattering (DLS).
Table 2: Representative Data from Serum Stability Assay
| Nanoparticle Formulation | Initial Size (nm) | Size after 24h in Serum (nm) | PDI after 24h | Dominant Proteins in Corona (by MS) |
|---|---|---|---|---|
| PEG-coated (Control) | 105.3 ± 2.1 | 118.7 ± 5.4 | 0.12 | Apolipoproteins, Albumin |
| Poly(2-methyl-2-oxazoline) | 110.5 ± 3.4 | 125.9 ± 8.1 | 0.15 | Albumin, Fibrinogen |
| Zwitterionic Lipid | 95.8 ± 1.9 | 102.4 ± 3.2 | 0.09 | Transthyretin, Apolipoprotein A-I |
| Uncoated (Negative Ctrl) | 99.7 ± 2.5 | Aggregated/Precipitated | N/A | Immunoglobulins, Complement Factors |
Application Note 2: In Vivo Pharmacokinetics and ABC Phenomenon Assessment
Objective: To evaluate the blood circulation time and potential for Accelerated Blood Clearance upon repeated injection of PEG-free formulations.
Protocol:
- Animal Model: Use female BALB/c mice (n=5-6 per group).
- First (Priming) Dose: Administer a dose of 5 mg/kg nanoparticle (fluorescently or radio-labeled) via tail vein injection.
- Blood Sampling: Collect blood retro-orbitally at 2 min, 30 min, 2h, 8h, 24h, and 48h post-injection. Centrifuge to obtain plasma.
- Second (Challenging) Dose: On day 7, administer an identical second dose to the same animals.
- Repeat Blood Sampling: Follow the same schedule as step 3.
- Quantification: Measure fluorescence/radioactivity in plasma samples. Calculate pharmacokinetic parameters (AUC, t1/2β, Clearance) using non-compartmental analysis.
- Anti-Polymer Antibody ELISA (Terminal): At sacrifice (e.g., day 14), collect serum. Use a direct ELISA with the coating polymer (PEG or alternative) adsorbed on plates to detect anti-polymer IgM/IgG antibodies.
Table 3: Representative Pharmacokinetic Parameters (Single vs. Repeated Dose)
| Formulation | First Dose AUC(0-48h) (μg/mL*h) | First Dose t1/2β (h) | Second Dose AUC(0-48h) (μg/mL*h) | ABC Ratio (AUC2nd/AUC1st) | Anti-Polymer IgM (OD450) |
|---|---|---|---|---|---|
| PEG-Liposome | 850 ± 120 | 18.5 ± 3.2 | 95 ± 25 | 0.11 | 1.25 ± 0.30 |
| Polyglycerol-Liposome | 920 ± 105 | 20.1 ± 2.8 | 780 ± 110 | 0.85 | 0.15 ± 0.05 |
| Peptide-Coated NP | 550 ± 75 | 12.4 ± 1.9 | 530 ± 80 | 0.96 | 0.10 ± 0.03 |
Visualizations
Title: PEG vs. Alternative Coating Pathways
Title: Key Development Milestones for PEG-Free NPs
The Scientist's Toolkit: Key Research Reagent Solutions
Table 4: Essential Materials for PEG-Free Nanoparticle Research
| Item/Category | Example Product/Class | Function in Research |
|---|---|---|
| Alternative Hydrophilic Polymers | Poly(2-oxazoline)s (PMOZ, PEtOx), Polyglycerols, Hydroxyethyl Starch (HES) | Provide steric stabilization without PEG; core material for "stealth" coatings. |
| Zwitterionic Lipids | DSPE-based lipids with betaine, phosphocholine, or carboxybetaine headgroups. | Form stabilized liposomal membranes or conjugate to surfaces to resist protein adsorption. |
| Functionalized Lipids/Polymers | Maleimide-, DBCO-, or NHS-terminated lipids (e.g., DOPE-Mal, DSPE-PEG2000-DBCO). | Enable chemoselective conjugation of targeting ligands or alternative polymers to nanoparticle surfaces. |
| Fluorescent Probes for Tracking | Dir, DiD, DiR dyes; Coumarin-labeled lipids/polymers; quantum dots. | Allow in vitro and in vivo tracking of nanoparticle fate via fluorescence imaging or flow cytometry. |
| Protein Corona Isolation Kits | Sucrose gradient kits; magnetic bead-based isolation kits. | Simplify and standardize the isolation of hard protein corona for proteomic analysis. |
| Anti-Mouse IgM/IgG ELISA Kits | Species-specific isotyping ELISA kits. | Quantify immune response (antibody levels) against nanoparticle coatings in murine models. |
| Complement Activation Assays | C3a, C5a, SC5b-9 ELISA kits (human or murine). | Assess potential for complement activation-related pseudoallergy (CARPA). |
| Size & Zeta Potential Standards | NIST-traceable polystyrene/nanosphere standards. | Calibrate and validate DLS and zeta potential instruments for accurate CQA measurement. |
Conclusion
The pursuit of PEG-free stabilization strategies marks a pivotal evolution in nanomedicine, driven by the need to overcome the immunological and pharmacological limitations of PEG. As explored, a diverse toolkit—spanning advanced polymers, biomimetic coatings, and natural polysaccharides—offers viable and often superior alternatives, providing tunable stealth, stability, and functionality. Successful implementation requires careful optimization of formulation parameters and rigorous validation against established PEG benchmarks. Looking forward, the integration of these novel stabilizers with active targeting ligands and stimuli-responsive elements will enable the next generation of 'smart' nanocarriers. Their clinical translation holds significant promise for enhancing the safety, efficacy, and patient acceptability of nanoparticle-based therapeutics, ultimately leading to more reliable and effective treatments across a spectrum of diseases.