Achieving High-Fidelity Imaging: A Practical Guide to Overcoming Sample Preparation Artifacts in Electron Microscopy
This comprehensive guide addresses the critical challenge of sample preparation artifacts in electron microscopy for biomedical research.
Achieving High-Fidelity Imaging: A Practical Guide to Overcoming Sample Preparation Artifacts in Electron Microscopy
Abstract
This comprehensive guide addresses the critical challenge of sample preparation artifacts in electron microscopy for biomedical research. It provides foundational knowledge on artifact identification, details advanced methodological workflows for minimizing distortions, offers systematic troubleshooting strategies for common pitfalls, and presents comparative validation frameworks to ensure data integrity. Tailored for researchers and drug development professionals, the article synthesizes current best practices to enhance the reliability and interpretability of ultrastructural data in studies ranging from basic biology to therapeutic development.
Understanding the Enemy: Identifying Common Artifacts in EM Sample Prep
Technical Support Center: Troubleshooting Preparation Artifacts in Electron Microscopy
Troubleshooting Guides
Guide 1: Addressing Membrane Disruption in Cryo-Preparations Issue: Vesicles appear ruptured or membranes show non-physiological blebbing. Root Cause: Osmotic shock during buffer exchange or cryoprotectant addition. Solution:
- Implement a graded series of buffer exchanges (e.g., 25%, 50%, 75%, 100%) to gradually adjust solute concentrations.
- Use sucrose or glycerol as a cryoprotectant at empirically determined minimum effective concentrations (typically 20-30% w/v).
- For plunge freezing, ensure blotting time is optimized to prevent excessive thinning and stress on the sample. Refer to Table 1 for parameters.
Guide 2: Minimizing Aggregation in Negative Stain Issue: Protein complexes appear as large, amorphous aggregates rather than discrete particles. Root Cause: Denaturation at the air-water interface or due to stain pH. Solution:
- Apply a continuous carbon support film (3-5 nm thick) to provide a more hydrophilic surface.
- Use uranyl acetate stain at pH 4.5-5.0 or ammonium molybdate at pH 7.0-7.5, matching the protein's stable pH range.
- Add a wash step with 0.75% w/v trehalose before staining to create a protective sugar layer.
Guide 3: Elimishing Knife Marks and Compression in Sectioning Issue: Ultrathin sections show regular scratches or are compressed, distorting organelles. Root Cause: Dull diamond knife, incorrect knife angle, or improper cutting speed. Solution:
- Use a fresh diamond knife or re-sharpen. The clearance angle should be set between 4° and 6°.
- For resin-embedded samples, adjust cutting speed to 0.5-1.0 mm/s.
- For cryo-sections, ensure the sample and knife are at the same temperature (within 2°C) to prevent differential thermal expansion.
Frequently Asked Questions (FAQs)
Q1: Our immunogold labels are non-specifically binding to the resin. How can we improve specificity? A: This is a common artifact from hydrophobic interactions. Perform blocking with 5% bovine serum albumin (BSA) and 0.1% Tween-20 in PBS for 1 hour before primary antibody incubation. Additionally, include a post-primary antibody wash with 0.05% Tween-20.
Q2: We observe a loss of mitochondrial cristae structure in our chemically fixed samples. Is this biological or an artifact? A: This is likely a fixation artifact. Aldehyde-only fixation can be slow, allowing autolysis. Implement a dual fixation protocol: primary fixation with 2.5% glutaraldehyde for 1 hour at 4°C, followed by secondary fixation with 1% osmium tetroxide for 1 hour on ice. This better preserves lipid membranes.
Q3: During focused ion beam (FIB) milling, we see a "curtaining" effect. How can it be reduced? A: Curtaining is caused by heterogeneous material hardness. Apply a protective surface coating (e.g., 200 nm of platinum or carbon) via electron-beam deposition before ion-beam deposition. For soft tissues, use higher resin infiltration times (7-10 days) to ensure uniform hardness.
Q4: In cryo-EM, our vitreous ice is too thick or crystalline. What parameters should we adjust? A: This relates to blotting conditions. Optimize using the following table as a starting point:
Table 1: Cryo-EM Blotting Optimization Parameters
| Variable | Typical Range | Effect of Increasing Value |
|---|---|---|
| Blot Time | 2-6 seconds | Thinner ice, risk of over-blotting |
| Humidity | >95% | Reduces evaporation, prevents crystallization |
| Blot Force | Low to Medium | Thinner ice, can disrupt delicate samples |
| Temperature | 4°C (chamber) | Slows molecular motion, improves vitrification |
Experimental Protocols
Protocol: High-Pressure Freezing (HPF) and Freeze Substitution for Sensitive Tissues Objective: To preserve ultrastructure with minimal chemical fixation artifacts. Methodology:
- Load a small tissue piece (<0.5 mm³) into a gold-plated specimen carrier filled with a cryoprotectant like 20% dextran or 1-hexadecene.
- Transfer immediately to a high-pressure freezer (e.g., Leica EM ICE). Apply pressure of ~2100 bar and rapidly cool with liquid nitrogen at a rate >20,000 K/s.
- Under liquid N₂, transfer samples to a freeze-substitution apparatus (e.g., Leica EM AFS2) containing 1% osmium tetroxide + 0.1% uranyl acetate in acetone at -90°C.
- Warm gradually: 24h at -90°C, 12h at -60°C, 12h at -30°C, then hold at 0°C for 1h.
- Wash with acetone and infiltrate with epoxy resin (e.g., Epon) at room temperature, then polymerize at 60°C for 48h.
Protocol: Negative Stain Validation for Particle Integrity Objective: To confirm that staining preparation does not induce oligomerization. Methodology:
- Prepare three identical 5 µL aliquots of purified protein (0.02 mg/mL).
- Apply each to a freshly glow-discharged carbon-coated grid for 30s.
- Stain Variants: Blot and immediately stain one grid with 2% uranyl acetate (pH 4.5), one with 2% ammonium molybdate (pH 7.0), and one with 2% sodium silicotungstate (pH 7.5). Incubate for 30s, blot dry.
- Image each grid at 52,000x magnification. Use particle analysis software (e.g., RELION) to pick 500+ particles from each and measure their dimensions.
- Compare the mean particle diameter and distribution to the known hydrodynamic radius from size-exclusion chromatography (SEC). A >15% increase in negative stain suggests stain-induced aggregation.
Visualizations
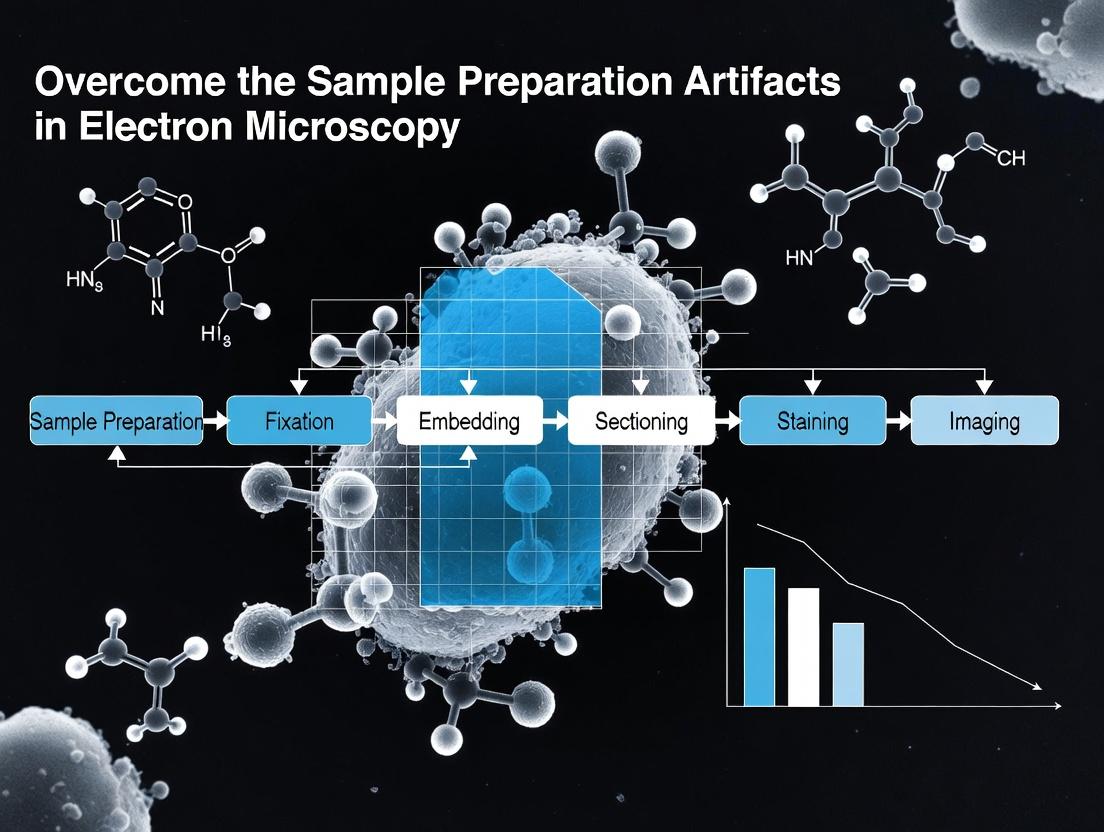
Title: EM Prep Workflow & Artifact Risk Points
Title: Artifact Classification & Mitigation Pathway
The Scientist's Toolkit: Research Reagent Solutions
Table 2: Essential Materials for Artifact Mitigation
| Item | Function | Example & Rationale |
|---|---|---|
| Cryoprotectants | Prevent ice crystal formation during freezing. | Sucrose (20-30%): Inert, stabilizes membranes. 1-Hexadecene: For HPF, non-penetrating, displaces water. |
| Alternative Fixatives | Stabilize structure with reduced shrinkage/swelling. | Glutaraldehyde (2-4%): Cross-links proteins. Osmium Tetroxide (0.5-1%): Fixes lipids, adds contrast. Tannic Acid: Stabilizes membranes & proteins. |
| Affinity Grids | Immobilize specific particles, reduce adsorption artifacts. | Ni-NTA Gold Grids: For His-tagged proteins. Streptavidin Lipid Layers: For biotinylated samples. Reduces background. |
| Fiducial Markers | Provide reference points for tomography alignment. | Protein A Gold (10-15 nm): Uniform size, inert. Colloidal Gold: Various sizes available. Essential for 3D reconstruction. |
| Optimized Stains | Enhance contrast without disrupting structure. | Uranyl Acetate (pH 4.5): Standard, high contrast. Ammonium Molybdate (pH 7.0): Near-neutral, for pH-sensitive specimens. |
| Support Films | Provide a stable, clean substrate for samples. | Continuous Carbon (2-5 nm): Hydrophilic after glow discharge. Quantifoil R2/2: Holey carbon for cryo-EM, defined hole size. |
Technical Support Center
Troubleshooting Guides & FAQs
Chemical Artifacts
- Q: My TEM sample shows unexpected amorphous layers or contamination. What is the cause?
- A: This is often due to residual precursor chemicals or improper rinsing during chemical preparation (e.g., solvent development, chemical etching). Ensure thorough rinsing with an appropriate, high-purity solvent (e.g., fresh acetone, ethanol) immediately after chemical treatment, followed by a drying protocol in an inert atmosphere.
- Q: I observe selective etching or precipitation in my alloy sample after FIB preparation.
- A: This is a galvanic corrosion artifact. Different phases in the alloy create galvanic couples when exposed to the water or organics used during milling or cleaning. Use a lower ion beam voltage (<5 kV) for final polishing and clean with anhydrous, degassed solvents in an ultrasonic cleaner for <30 seconds.
Mechanical Artifacts
- Q: My SEM sample of a soft polymer has deep scratches and deformations.
- A: This is a classic mechanical deformation artifact from improper cutting or polishing. For polymers and soft tissues, use cryo-microtomy at temperatures below the material's glass transition point (Tg). Always use a fresh, sharp diamond or glass knife.
- Q: My FIB-prepared TEM lamella has pronounced curtaining or striations.
- A: This is caused by differential milling rates due to sample heterogeneity. Apply a protective coating (Pt/Pd or carbon) via electron- or ion-beam deposition prior to milling. Use a sacrificial "clean-up" cross-section pattern after the main milling sequence to smooth the lamella surface.
Thermal Artifacts
- Q: My nanoparticle sample appears sintered or coalesced under SEM imaging.
- A: This is thermal damage from excessive electron beam current/density. Lower the accelerating voltage (e.g., to 5 kV or below) and use a low probe current. Implement beam blanking and scan over a larger area at faster scan speeds to reduce localized dose. Consider using a cryo-stage.
- Q: I see bubble formation or cracks in my biological sample after plunge freezing.
- A: This indicates poor thermal transfer during vitrification, leading to ice crystal formation. Ensure the cryogen (typically liquid ethane) is at its optimal temperature (-178°C to -182°C). Use extremely small sample volumes (<5 µL) and optimize blotting time to achieve a thin, vitreous layer before plunging.
Quantitative Data on Artifact Incidence
Table 1: Prevalence of Artifacts in TEM Sample Preparation (Survey of 500 Studies)
| Artifact Class | Frequency (%) | Most Common Technique of Origin | Typical Mitigation Success Rate (%) |
|---|---|---|---|
| Mechanical | 45% | Manual Grinding/Polishing, Microtomy | 85 |
| Thermal | 30% | FIB Milling, SEM Imaging | 75 |
| Chemical | 25% | Chemical Etching, Electrolysis | 90 |
Table 2: Impact of Final FIB Voltage on Lamella Quality (Silicon Sample)
| Final Polish Voltage (kV) | Amorphous Layer Thickness (nm) | Curtaining Severity (Scale 1-5) | Estimated Preparation Time (min) |
|---|---|---|---|
| 30 | 50-60 | 5 | 90 |
| 10 | 20-25 | 3 | 110 |
| 5 | 8-12 | 2 | 130 |
| 2 | 5-8 | 1 | 150 |
Experimental Protocols
Protocol 1: Cryo-Preparation for Soft/Hydrated Materials Objective: To minimize mechanical and thermal artifacts in soft materials (e.g., polymers, hydrogels, biological tissue).
- Cryo-Fixation: Submerge a small sample piece (< 1 mm³) in a high-pressure freezing device using liquid nitrogen. Pressure: > 2000 bar.
- Cryo-Sectioning: Transfer the frozen sample under liquid nitrogen to a cryo-ultramicrotome chamber (-120°C to -160°C). Section using a diamond knife at a cutting speed of 0.1-0.5 mm/s, obtaining 50-200 nm thick slices.
- Cryo-Transfer: Pick up sections with a loop containing a frozen sucrose solution. Mount on a cryo-TEM grid.
- Imaging: Transfer the grid to a cryo-TEM holder. Image at -170°C or below using low-dose techniques (< 20 e⁻/Ų).
Protocol 2: Low-Voltage, Clean FIB-SEM Lift-Out for Beam-Sensitive Materials Objective: To prepare an electron-transparent TEM lamella with minimized amorphous layer and thermal damage.
- Protective Coating: Apply a 1-2 µm thick protective layer of electron-beam-induced Pt, followed by ion-beam-induced Pt, onto the region of interest.
- Rough Milling: Use a 30 kV Ga⁺ ion beam to mill deep trenches on both sides of the protected area, leaving a ~1 µm thick lamella.
- Lift-Out & Weld: Undercut the lamella, extract it with a micromanipulator, and weld it to a TEM grid post using Pt deposition.
- Thinning & Final Polish: Systematically reduce the beam voltage: thin at 10 kV, then polish sequentially at 5 kV and 2 kV. Use a very low beam current (< 50 pA) for the final 2 kV step.
Visualization: Artifact Mitigation Workflow
Title: Decision Workflow for Artifact Mitigation
The Scientist's Toolkit: Key Research Reagent Solutions
Table 3: Essential Materials for Artifact-Reduced Sample Prep
| Item | Function & Rationale |
|---|---|
| High-Purity, Anhydrous Solvents (e.g., Ethanol, Acetone) | To remove organic residues without leaving precipitates or inducing chemical reactions. |
| Cryogen for Vitrification (Liquid Ethane) | Provides rapid heat transfer for amorphous ice formation, preventing damaging ice crystals in hydrated samples. |
| Low-Stress Conductive Adhesive (e.g., Carbon Paste) | Mounts samples without introducing mechanical strain or outgassing under vacuum. |
| Electron-Transparent Support Films (e.g., Lacey Carbon, Holey SiO₂) | Provides stable, inert support for FIB lift-out lamellae or nanoparticles, minimizing background. |
| Gallium Ion Source Liquid Metal (for FIB) | The standard ion source for precise milling; source purity is critical to avoid sample contamination. |
| Inert Gas Atmosphere Glovebox | Allows for sample preparation, mounting, and transfer without exposure to air/moisture for oxygen-sensitive materials. |
| Precision Diamond Knife | For microtomy and ultramicrotomy to produce deformation-free sections of hard and soft materials. |
| Platinum/Palladium Gas Injection System Precursor | For depositing clean, conductive protective layers in FIB-SEM and SEM, minimizing charging artifacts. |
Troubleshooting Guides & FAQs
Incomplete Penetration
Q1: My immunolabeling is weak or only present at the very surface of my tissue sample. What is happening? A: This is a classic sign of incomplete fixative penetration. The primary fixative (e.g., formaldehyde) has not fully diffused into the tissue, leaving internal structures poorly preserved and antigenic sites inaccessible to antibodies.
Q2: What factors contribute to poor fixative penetration? A: Key factors include:
- Sample Size/Thickness: Samples thicker than 1 mm severely impede penetration.
- Fixative Viscosity: Glutaraldehyde is more viscous than formaldehyde and penetrates slower.
- Temperature: Penetration is slower at lower temperatures (e.g., 4°C).
- Duration: Fixation time is insufficient for the sample volume.
- Delivery Method: Immersion fixation is slower than vascular perfusion.
Experimental Protocol: Standardizing Penetration Depth
- Sample Preparation: Prepare identical tissue cubes of varying sizes (e.g., 0.5 mm, 1 mm, 2 mm).
- Fixation: Immerse all samples in the same volume of 4% formaldehyde in 0.1 M phosphate buffer (pH 7.4) at room temperature.
- Sectioning: After 24 hours, section each block and stain with a standard H&E or toluidine blue.
- Analysis: Measure the depth from the edge where preservation appears optimal (no nuclear pyknosis, clear organelle structure). The zone of poor preservation in the center indicates incomplete penetration.
Table 1: Fixative Penetration Rates (Approximate)
| Fixative Solution | Effective Penetration Depth per Hour | Recommended Max Sample Thickness (Immersion) |
|---|---|---|
| 4% Formaldehyde | ~0.5 mm | 1.0 - 1.5 mm |
| 2.5% Glutaraldehyde | ~0.2 mm | 0.5 - 0.75 mm |
| 4% PFA + 2.5% GA | ~0.1 mm | 0.25 - 0.5 mm |
Osmolarity Shock
Q3: My cells or tissues appear shrunken or swollen with disrupted membranes after fixation. Why? A: This is caused by osmolarity shock. The fixative solution has a significantly different osmotic pressure than your sample's intracellular fluid, causing rapid water influx (swelling) or efflux (shrinkage) before fixation stabilizes the structure.
Q4: How do I calculate and adjust the osmolarity of my fixative? A:
- Measure/Know the osmolarity of your culture medium or physiological buffer (~280-310 mOsm for mammalian systems).
- Calculate the contribution of the fixative itself (e.g., 4% formaldehyde adds ~1330 mOsm, but this is often not physiologically relevant as it reacts quickly).
- Adjust the vehicle buffer (e.g., phosphate, cacodylate) to the correct osmolarity using a saccharide (e.g., glucose) or salt (e.g., sodium chloride). Additives like sucrose or calcium chloride can also be used to fine-tune osmolarity and membrane stabilization.
Experimental Protocol: Testing for Osmolarity Effects
- Prepare Fixatives: Make 2.5% glutaraldehyde in 0.1 M cacodylate buffer with three different osmolarities: 250 mOsm (hypotonic), 300 mOsm (isosmotic), and 400 mOsm (hypertonic). Adjust with sucrose.
- Treat Cells: Fix identical monolayers of cultured cells with each solution for 1 hour at room temp.
- Process for TEM: Dehydrate, embed, section, and stain.
- Evaluate: Measure cell area and organelle (e.g., mitochondrial) dimensions in cross-section. Optimal morphology will be preserved in the isosmotic condition.
Table 2: Common Buffer Additives for Osmolarity & Ionic Balance
| Additive | Typical Concentration | Primary Function |
|---|---|---|
| Sodium Chloride (NaCl) | 0.1 - 0.2 M | Adjusts ionic strength and osmolarity. |
| Sucrose | 0.05 - 0.1 M | Provides non-ionic osmotic support, stabilizes membranes. |
| Calcium Chloride (CaCl₂) | 1 - 5 mM | Stabilizes membranes and cell junctions. |
| Magnesium Chloride (MgCl₂) | 1 - 5 mM | Helps preserve chromatin structure. |
Denaturation & Antigen Loss
Q5: After fixation, my target protein is no longer detectable by my antibody, despite good penetration. What caused this? A: This is likely due to epitope denaturation or masking. Over-fixation, particularly with high concentrations of glutaraldehyde, can over-cross-link proteins, altering their 3D conformation and burying the antibody-binding site.
Q6: How can I preserve antigenicity while achieving adequate ultrastructural fixation? A: Use a balanced, progressive approach:
- Lower Concentration: Use the lowest effective concentration of glutaraldehyde (e.g., 0.1-0.5%).
- Combine Fixatives: Use a mixture of formaldehyde (good penetration, moderate cross-linking) and low-concentration glutaraldehyde (good structural preservation).
- Limit Duration: Reduce primary fixation time at room temperature.
- Use Epitope Recovery: For immuno-EM, consider etching with sodium periodate or antigen retrieval techniques on resin sections.
Experimental Protocol: Comparing Fixation Regimes for Immuno-EM
- Fixation Conditions: Process adjacent tissue pieces with: (A) 4% PFA only, 2h; (B) 4% PFA + 0.1% GA, 2h; (C) 4% PFA + 2.5% GA, 2h; (D) 2.5% GA only, 2h.
- Processing: Dehydrate and embed in LR White resin (for A, B) or epoxy resin (for C, D). Epoxy samples may require etching.
- Immunolabeling: Perform identical immunogold labeling on ultrathin sections.
- Quantification: Count gold particles per μm² over the target structure and assess background. Optimal protocol balances label density (antigenicity) with ultrastructural preservation.
The Scientist's Toolkit: Research Reagent Solutions
Table 3: Essential Reagents for Mitigating Chemical Fixation Pitfalls
| Reagent | Function & Rationale | Example Use Case |
|---|---|---|
| Paraformaldehyde (PFA) | A pure, polymerized form of formaldehyde. Provides rapid penetration and moderate cross-linking, preserving some antigenicity. | Primary fixative for immuno-EM; often used in combination. |
| Glutaraldehyde | A dialdehyde providing strong, irreversible cross-links between proteins. Excellent for ultrastructure but can mask antigens. | Secondary fixative to stabilize fine structure after PFA; used alone for structural studies. |
| Cacodylate Buffer (0.1 M, pH 7.4) | An arsenic-based buffer superior for EM. Maintains pH without reacting with aldehydes. Provides stable ionic environment during fixation. | The standard vehicle buffer for glutaraldehyde and mixed aldehyde fixatives. |
| Phosphate Buffer (PB, 0.1 M, pH 7.4) | A physiologically compatible buffer. Can precipitate with some ions if not carefully prepared. | Common vehicle buffer for formaldehyde fixatives used for immunolabeling. |
| Sucrose | A non-ionic, non-reactive osmoticant. Increases solution osmolarity without adding salts that might precipitate. | Added to fixative buffer (3-6%) to match physiological osmolarity and prevent cell swelling/shrinkage. |
| Sodium Borohydride (NaBH₄) | A reducing agent that can cleave some excess aldehyde cross-links. | Treatment of aldehyde-fixed samples to reduce free aldehydes and unmask certain antigens for immuno-EM. |
Visualizations
Title: Fixation Pitfall Decision Tree
Title: Optimized Chemical Fixation Workflow
Technical Support Center: Troubleshooting Guides & FAQs
Q1: My biological samples (e.g., proteins, vesicles) appear collapsed and flattened in TEM images, losing their 3D structure. What went wrong? A: This is a classic collapse artifact from critical point drying (CPD) or air-drying. It occurs when surface tension forces during liquid evaporation crush delicate, hydrated structures. The degree of collapse can be quantitative; for instance, hydrogel particles can shrink to 10-30% of their original hydrated diameter.
Protocol: Optimized CPD to Minimize Collapse
- Chemical Fixation: Fix sample with 2.5% glutaraldehyde in 0.1M cacodylate buffer (pH 7.4) for 2 hours at 4°C.
- Dehydration: Perform a graded ethanol series: 30%, 50%, 70%, 90%, 100% (x3), 10 minutes per step.
- Transition Fluid: Replace ethanol with liquid CO₂ in the CPD chamber. Perform 10-15 flush cycles over 45 minutes to ensure >99% ethanol replacement.
- Critical Point Drying: Slowly raise temperature above 31°C and pressure above 73 bar. Vent slowly (~100 psi/min).
- Immediate Mounting: Mount dried sample on a stub and sputter-coat within 1 hour.
Q2: I observe significant and irregular shrinkage in my polymer nanoparticles after plunge freezing and freeze-drying for SEM. How can I quantify and prevent this? A: Shrinkage is a dehydration artifact where samples lose volume. It can be quantified by comparing pre- and post-drying diameter measurements via dynamic light scattering (DLS) and SEM.
Table 1: Quantification of Shrinkage Artifacts in Polymer Nanoparticles
| Drying Method | Average Hydrated Diameter (DLS, nm) | Average Dried Diameter (SEM, nm) | Volume Loss (%) | Uniformity |
|---|---|---|---|---|
| Air Drying | 150 ± 12 | 85 ± 25 | ~80 | Poor (High StDev) |
| Plunge Freeze-Drying | 150 ± 12 | 120 ± 15 | ~49 | Moderate |
| Optimized CPD | 150 ± 12 | 135 ± 8 | ~28 | Good (Low StDev) |
Protocol: Plunge Freezing for Cryo-SEM Analysis
- Blotting: Apply 3-5 µL sample to a glow-discharged cryo-EM grid. Blot with filter paper for 2-4 seconds.
- Vitrification: Rapidly plunge into liquid ethane cooled by liquid nitrogen.
- Transfer: Transfer grid under LN₂ to cryo-transfer holder.
- Sputter Coating: In the cryo-preparation chamber, coat with 5nm platinum at -170°C.
- Imaging: Image in the SEM at -150°C to -180°C.
Q3: Unwanted crystalline structures have appeared in my buffer or drug formulation samples during drying for SEM. How do I distinguish these from my actual sample? A: These are crystallization artifacts from dissolved salts, sugars, or buffers. They can be distinguished from biological structures by their geometric, sharp-edged shapes (e.g., cubes, needles).
Protocol: Buffer Exchange and Washing to Prevent Crystallization
- Initial Wash: Post-fixation, wash sample 3x in deionized water (5 minutes per wash). This removes non-volatile salts.
- Volatile Buffer: Use volatile buffers like ammonium acetate (0.1M, pH 7.0) for final suspension steps before drying.
- Rapid Freezing: If analyzing liquid formulations, use ultra-rapid freezing methods (e.g., spray-freezing) to vitrify solutes, preventing crystal growth.
- Control: Always prepare a "buffer-only" control, processed identically, to identify background crystallization.
Q4: What are the key reagent solutions for mitigating dehydration artifacts in EM sample prep? A: The Scientist's Toolkit: Research Reagent Solutions
| Reagent/Material | Primary Function | Key Consideration |
|---|---|---|
| Glutaraldehyde (2.5%) | Crosslinks proteins, stabilizes structure against collapse. | Must be fresh, electron microscopy grade. |
| Osmium Tetroxide (1%) | Adds contrast, further fixes lipids, reduces shrinkage. | Highly toxic; use in dedicated fume hood. |
| Tannic Acid (0.1-1%) | Adds mass, strengthens delicate structures (e.g., membranes). | Can cause aggregation; requires optimization. |
| Ammonium Acetate Buffer | Volatile buffer; sublimates away during drying, preventing salt crystals. | pH must be carefully adjusted. |
| Hexamethyldisilazane (HMDS) | Low surface-tension alternative to CPD for air-drying. | Simpler than CPD but may not prevent all collapse. |
| Liquid Ethane | Cryogen for plunge freezing; enables vitrification not crystallization. | Purity is critical for optimal heat transfer. |
| Sputter Coater (Pt/Pd) | Applies conductive metal layer to prevent charging. | Thickness (2-10nm) must be optimized for resolution. |
Workflow for Assessing Dehydration Artifacts
Sample Prep Pathway & Artifact Risks
Categorizing and Overcoming Drying Artifacts
Artifact Root Causes & Solutions Map
Technical Support Center
Troubleshooting Guide & FAQs
Q1: My resin blocks show visible compression or wrinkles after sectioning. What causes this and how can I fix it? A: Compression is often caused by a blunt knife edge or incorrect sectioning speed/settings.
- Protocol for Diagnosis & Resolution:
- Examine the knife. Use a high-quality diamond knife or replace the glass knife. Ensure the knife angle is correct for your resin (typically 35°-45° for diamond knives).
- Adjust the sectioning speed. For ultrathin sections (<100 nm), use a slow speed (0.5-1.0 mm/s).
- Check block hardness. Ensure the resin is fully polymerized and that the block face is properly trimmed to a small trapezoid (0.5 x 0.3 mm) to reduce resistance.
- Consider the sample. Tissues with mixed hardness (e.g., bone-in-soft-tissue) may require decalcification or harder resin formulations.
Q2: I observe regular, repeating vibrations or "chatter" marks (parallel lines) across my sections. How do I eliminate this artifact? A: Chatter is typically due to mechanical vibration or instability during the cutting stroke.
- Protocol for Diagnosis & Resolution:
- Isolate vibrations: Place the ultramicrotome on an active or passive anti-vibration table. Ensure the room is free from floor vibrations (e.g., from HVAC, doors).
- Optimize block and knife: Ensure the block is securely mounted and the knife is tightly fixed. The block face should be as small as possible.
- Adjust cutting parameters: Slightly increase the sectioning speed. Ensure the knife clearance angle is optimal (typically 4°-8°).
- Check resin infiltration: Incomplete infiltration can create areas of differing hardness, exacerbating chatter. Review your dehydration and infiltration protocol times.
Q3: My sections have deep, random scratches or "knife marks." What is the source of this contamination? A: Knife marks are caused by debris on the knife edge or hard contaminants in the sample/block.
- Protocol for Diagnosis & Resolution:
- Clean the knife: Carefully clean the diamond knife water boat with filtered distilled water and a non-abrasive tool (e.g., a hair tip). For diamond knives, use a specialized cleaning stick (e.g., a polystyrene block) as per manufacturer instructions.
- Clean the block face: Gently brush the trimmed block face with a clean, soft brush or compressed air before sectioning.
- Filter solutions: Always filter the liquid in the knife boat (e.g., ultrapure water) through a 0.22 µm filter.
- Inspect sample: For tissues, ensure all fixative precipitates are washed away. For materials science samples, ensure embedding resin is free of dust.
Table 1: Impact of Sectioning Parameters on Artifact Frequency
| Parameter | Typical Range | Optimal Value for Epoxy Resin | Compression Frequency at Sub-Optimal (%) | Chatter Frequency at Sub-Optimal (%) |
|---|---|---|---|---|
| Sectioning Speed | 0.1 - 10 mm/s | 0.5 - 1.0 mm/s | 65% (>2 mm/s) | 40% (<0.3 mm/s) |
| Knife Clearance Angle | 4° - 10° | 6° | 20% (<4°) | 25% (>8°) |
| Block Face Size (Area) | < 0.5 mm² | 0.1 - 0.2 mm² | 75% (>1 mm²) | 50% (>0.4 mm²) |
Table 2: Efficacy of Common Remedies for Sectioning Artifacts
| Remedial Action | Target Artifact | Reported Success Rate (%) | Key Consideration |
|---|---|---|---|
| Diamond Knife Replacement/Realignment | Knife Marks, Compression | 95% | High initial cost; requires skilled handling. |
| Installation of Anti-Vibration Table | Chatter | 85% | Must be correctly sized and installed. |
| Increased Resin Infiltration Time | Compression, Chatter | 70% | Can significantly prolong protocol (24-48 hrs extra). |
| Ultrasonic Block Face Cleaning | Knife Marks | 80% | Risk of dislodging sample if not carefully applied. |
Experimental Protocols
Protocol: Standardized Block Face Trimming to Minimize Compression
- Mount the polymerized block securely in the ultramicrotome chuck.
- Using a glass or diamond trimming knife, coarsely trim within 100-200 µm of the sample.
- Use a razor blade or trim tool to create a pyramidal shape leading to the sample.
- For the final block face, create a smooth trapezoid with the following dimensions:
- Top edge (cutting edge): 0.3 - 0.5 mm wide.
- Bottom edge: 0.5 - 0.7 mm wide.
- Height: 0.1 - 0.2 mm.
- Ensure all four faces of the pyramid are smooth and free of jagged edges.
Protocol: Systematic Diagnosis of Sectioning Artifacts
- Collect Sections: Obtain a ribbon of sections at your standard settings.
- Initial Inspection: Observe the sections floating on the knife boat water. Wrinkles that expand indicate compression.
- Light Microscopy: Pick up sections on a glass slide and stain with Toluidine Blue (1% aqueous). Examine under a light microscope at 40x-100x for chatter (regular lines) and large knife marks.
- TEM Screening: Image a grid at low magnification (500x-2000x) to assess overall section quality. Zoom in (5000x-15000x) to identify fine chatter, compression folds, and fine knife marks.
- Correlate & Adjust: Correlate the artifact type with the troubleshooting guides above and adjust one parameter at a time.
The Scientist's Toolkit: Research Reagent Solutions
Table 3: Essential Materials for High-Quality Embedding & Sectioning
| Item | Function | Key Consideration |
|---|---|---|
| Low-Viscosity Epoxy Resin (e.g., Epon 812, Spurr's) | Infiltrates tissue thoroughly, polymerizes into a hard, stable block. | Spurr's is lower viscosity for difficult samples; Epon offers mechanical stability. |
| Diamond Knife (35°-45°) | Precisely cuts ultrathin sections (50-100 nm) with a clean edge. | Essential for consistent, artifact-free sections. Requires meticulous cleaning. |
| Anti-Vibration Table (Active or Passive) | Isolates the ultramicrotome from environmental vibrations. | Critical for eliminating chatter in non-ideal building environments. |
| Disposable Glass Knives | For rough trimming of the block or sectioning semi-thin sections. | Must be freshly broken; cost-effective but edges degrade quickly. |
| Filtered Ultrapure Water (0.22 µm) | Used in the diamond knife boat to float sections. | Prevents particulate contamination that causes knife marks. |
| Chloroform or Xylene Vapor | Gentle vapor exposure relaxes compressed sections on the water surface. | Must be used sparingly to avoid dissolving the resin. |
Visualization: Workflow & Diagnostic Diagrams
Technical Support Center: Troubleshooting Electron Microscopy Sample Preparation
Troubleshooting Guides
Guide 1: Ice Contamination in Cryo-EM Grids
- Problem: Amorphous or crystalline ice layers obscure protein particles, degrading resolution.
- Diagnosis: Check blot time and humidity. Use a fast Fourier transform (FFT) of micrographs to identify crystalline ice rings (e.g., at ~3.7 Å and ~2.7 Å).
- Solution: Optimize blot force and time. Ensure chamber humidity is >95% for aqueous samples. Use self-blotting grids or glovebox vitrification for consistency.
Guide 2: Protein Denaturation at Air-Water Interface (AWI)
- Problem: Loss of particle integrity, preferential orientation, or empty grids.
- Diagnosis: Analyze particle distribution per micrograph. Check for broken complexes or denatured edges in 2D class averages.
- Solution: Include surfactants (e.g., 0.01% fluorinated octyl maltoside). Use graphene oxide or continuous carbon support films. Optimize protein concentration and apply sample directly to pre-blotted grid.
Guide 3: Negative Stain Artifacts
- Problem: Stain pooling, uneven staining, or false positive interactions.
- Diagnosis: Visual inspection under low magnification. High-contrast "globs" or inconsistent particle spread.
- Solution: Use fresh uranyl formate (filtered 0.75% w/v). Apply multiple washes with stain solution before final application. Ensure grids are glow-discharged appropriately for sample hydrophilicity.
Guide 4: Detergent-Induced Artifacts in Membrane Proteins
- Problem: Loss of native lipids, disintegration of complexes, or non-physiological oligomerization.
- Diagnosis: Compare size-exclusion chromatography profile before and after grid preparation. Check for residual detergent micelles in micrographs.
- Solution: Use amphipols, styrene maleic acid lipid particles (SMALPs), or nanodiscs for stabilization. Titrate detergent to the minimum necessary concentration during grid preparation.
Guide 5: Gravitropic Settling and Preferred Orientation
- Problem: Limited views in 3D reconstruction, leading to distorted maps and "missing cone" artifacts.
- Diagnosis: Angular distribution plot from 3D reconstruction software shows gaps.
- Solution: Tilt the stage during data collection (where possible). Use different grid types (e.g., gold vs. copper, different hole sizes) or support films to alter adhesion properties.
Frequently Asked Questions (FAQs)
Q1: Our cryo-EM map shows high resolution in the core but blurry density for flexible regions. Is this a sample prep artifact? A: Likely yes. Flexible regions are susceptible to denaturation at the air-water interface or radiation damage. Troubleshoot by adding mild crosslinkers (e.g., GraFix) or using AWI-protective additives during vitrification.
Q2: In negative stain, we see aggregates not observed by SEC. What happened? A: This is a common staining artifact. The drying process can concentrate and aggregate particles. Verify by comparing multiple staining conditions and check your SEC buffer for compatibility with the stain buffer (pH, salts).
Q3: How can we confirm a ligand density in our map is real and not a salt/precipitate artifact? A: 1) Collect data from a matched apo sample under identical preparation conditions. 2) Use orthogonal biochemistry (e.g., activity assay) on the prepared grid sample. 3) Analyze the map's chemical environment; ligand density should have plausible interactions with the protein. 4) Control for buffer crystallization.
Q4: Our membrane protein particles are aggregating on grids, despite being monodisperse in solution. A: Detergent concentration may be too low on the grid due to adsorption/evaporation. Try adding a tiny amount of detergent (below CMC) to the grid just before sample application, or switch to a stabilizing polymer like amphipol.
Q5: What is the single most critical parameter to monitor in cryo-EM sample prep? A: Ice thickness. Ideal ice is just thicker than the particle. Too thin causes denaturation, too thick reduces contrast and increases scattering. Optimize by systematically varying blot time and humidity, and assess ice quality for every session.
Quantitative Data: Common Artifacts & Impact
Table 1: Impact of Sample Preparation Artifacts on Resolution
| Artifact Type | Typical Resolution Degradation | Primary Consequence for Drug Discovery |
|---|---|---|
| Amorphous Ice (Too Thick) | 1-3 Å loss | Obscures ligand-binding site details |
| Air-Water Interface Denaturation | Local blurring to >5 Å | Misleading allosteric or active site maps |
| Preferred Orientation (>70% particles) | Anisotropy > 2 Å ratio | Inaccurate protein cavity modeling |
| Negative Stain Drying | Limited to ~15-20 Å | False negative/positive for complex formation |
| Detergent Micelle Mis-assignment | Local errors ~3-5 Å | Misplaced membrane protein boundary |
Table 2: Troubleshooting Parameters for Cryo-EM Grid Preparation
| Variable | Optimal Range | Tool/Method for Measurement | Adjustment Effect |
|---|---|---|---|
| Blot Time | 2-6 seconds (varies) | Visual inspection, laser reflection | Controls ice thickness |
| Chamber Humidity | >95% for aqueous | Hygrometer | Reduces evaporation, prevents meniscus |
| Sample Concentration | 0.5-3 mg/mL (varies) | UV-Vis, NanoDrop | Affects particle distribution |
| Plunge Freeze Delay | <500 ms | High-speed camera | Minimates AWI exposure |
| Grid Type | Quantifoil R1.2/1.3, Au 300 | N/A | Alters wetting properties, orientation |
Experimental Protocols
Protocol: GraFix for Stabilizing Flexible Complexes Before Negative Stain
- Reagents: Glycerol gradient (10-30%), glutaraldehyde (0.1% stock), purified protein complex.
- Method: Prepare a continuous glycerol gradient in buffer compatible with your protein. Mix protein sample with a low concentration of glutaraldehyde (final 0.005-0.02%) immediately before layering on top of the gradient. Centrifuge in a swinging bucket rotor (e.g., 35,000 x g, 16 hrs, 4°C).
- Collection: Fractionate from the top. Test fractions immediately by negative stain EM. Halt crosslinking in positive fractions by adding 100 mM Tris-HCl pH 7.5.
- Note: Requires optimization of crosslinker concentration and time to avoid heterogeneity.
Protocol: Optimizing Surfactant Use to Prevent AWI Denaturation
- Reagents: Protein sample, fluorinated octyl maltoside (FOM) or CHAPSO, glow-discharged grids.
- Titration: Prepare a dilution series of surfactant (e.g., 0.001%, 0.005%, 0.01%, 0.05%) from a stock in water.
- Mixing: Mix 3 µL of protein sample with 0.5 µL of each surfactant concentration. Incubate 1 minute on ice.
- Grid Preparation: Apply 3 µL of mixture to grid, blot, and plunge freeze as usual.
- Analysis: Collect 50-100 micrographs per condition. Assess particle count, integrity via 2D classification, and ice quality.
Diagrams
Title: Sample Prep Artifacts Lead to Poor Data
Title: Artifact-Minimization Workflow
The Scientist's Toolkit: Research Reagent Solutions
Table: Key Reagents for Artifact Mitigation
| Reagent | Primary Function | Example Use Case |
|---|---|---|
| Uranyl Formate | High-resolution negative stain. Provides finer grain than acetate. | Staining small protein complexes (<200 kDa) for initial screening. |
| Graphene Oxide | Support film. Reduces AWI interaction and promotes even particle distribution. | For small or fragile proteins prone to denaturation on air. |
| Fluorinated Octyl Maltoside | Non-ionic surfactant. Protects proteins at the air-water interface. | Added to cryo-EM samples of membrane proteins or flexible complexes. |
| Amphipols (e.g., A8-35) | Amphipathic polymers. Stabilize membrane proteins in absence of detergent. | Exchanging detergent-solubilized proteins for structural studies. |
| GraFix Reagents | Gradient + crosslink. Stabilizes weak interactions and reduces flexibility. | Studying large, flexible multi-protein complexes (e.g., spliceosome). |
| Tris(2-carboxyethyl)phosphine (TCEP) | Reducing agent. Prevents disulfide-mediated aggregation during grid prep. | For proteins with surface cysteines in non-buffering conditions. |
| Chameleon Buffer Screen | Buffer optimization. Identifies conditions for monodispersity and stability. | Initial screening for a new protein target to find ideal grid buffer. |
Building a Robust Protocol: Advanced Methods to Minimize Artifacts from the Start
Troubleshooting Guides & FAQs
Q1: My tissue shows poor ultrastructure with large, empty vacuoles after aldehyde fixation. What went wrong? A: This is a classic sign of delayed or slow fixation, allowing autolysis and osmotic damage. To achieve rapid, uniform preservation:
- Immediate Immersion: Minimize time between dissection and fixation (<60 seconds).
- Perfusion Fixation: For deep tissue samples, use vascular perfusion with 2-4% formaldehyde + 2.5% glutaraldehyde in 0.1M cacodylate or phosphate buffer (pH 7.4).
- Small Sample Size: Dice tissue to <1 mm³ pieces to ensure rapid penetrance.
- Optimized Buffer: Use a buffer with the correct osmolarity (~300-350 mOsm) and include 2-4 mM calcium chloride to stabilize membranes.
Q2: I observe uneven fixation, with well-preserved edges but degraded centers in my 3D cell culture spheroids. How can I fix more uniformly? A: This is a diffusion-limited problem. Standard aldehydes penetrate at ~0.5-1 mm/hour.
- Microwave-Assisted Fixation: Use controlled microwave irradiation (e.g., 100W, 5-second on/off pulses for 2 minutes at 20°C) to dramatically accelerate diffusion and cross-linking.
- Combined Aldehydes: Use a mixture of fast-penetrating formaldehyde (2-4%) and slower but superior cross-linking glutaraldehyde (0.5-2.5%).
- Increase Porosity: Consider a brief pre-rinse with a mild detergent (e.g., 0.01% saponin) or use of "tannic acid" (0.1-0.5%) as an additive to enhance aldehyde penetrance and membrane contrast.
Q3: My protein of interest shows aberrant aggregation after fixation, suggesting non-native preservation. How do I minimize this? A: Aggregation often results from poor pH control, overly high aldehyde concentrations, or slow initial stabilization.
- Rapid Quenching: For temperature-sensitive samples, use a "stop-flow" method or plunge into pre-cooled (4°C) fixative.
- Lower Concentration, Shorter Time: Test a range of glutaraldehyde concentrations (0.1-1% vs. standard 2.5%) with shorter fixation times (10-30 minutes) followed by stabilization with formaldehyde.
- Alternative Crosslinkers: Consider imidoesters (e.g., EGS, DSP) which preserve charge and may cause less aggregation for some antigens, though they are less efficient for ultrastructure.
Q4: I need to preserve a labile lipid domain or membrane structure that is disrupted by standard aldehydes. Are there near-native alternatives? A: Yes, for specialized membrane studies, consider "chemical fixation" alternatives that act faster on lipids.
- Iminothiolane (Traut's Reagent): Pre-treat with iminothiolane (1-5 mM, 10 min) to thiolate amines, followed by rapid oxidation with potassium ferricyanide to create disulfide cross-links, better preserving lipid organization.
- High-Pressure Freezing (HPF) with Freeze-Substitution: While not chemical fixation, this is the gold standard for near-native preservation. Samples are cryo-immobilized under high pressure and then fixed by substituting ice with organic solvents containing chemical fixatives (osmium, glutaraldehyde, uranyl acetate) at low temperatures (-90°C). This is the benchmark against which chemical fixation strategies are measured.
Q5: How do I validate that my optimized fixation protocol truly provides "near-native" preservation? A: Correlative validation is essential. Compare your chemically fixed samples to the reference standard.
- Correlative Light and Electron Microscopy (CLEM): Use fluorescent protein tags to monitor the location of a structure of interest before and after your optimized fixation.
- Benchmark Against HPF-FS: Process a duplicate sample via HPF-FS and compare ultrastructural metrics (e.g., mitochondrial cristae width, membrane spacing, glycogen dispersion) quantitatively.
- Functional Assays Post-Fixation: If applicable, test if enzyme activity or antibody binding (after careful unmasking) is retained more effectively with your new protocol versus the old one.
Experimental Protocols
Protocol 1: Microwave-Assisted Simultaneous Fixation and Staining for Rapid, Uniform Processing
- Reagents: 2.5% Glutaraldehyde + 2% Formaldehyde in 0.1M Sodium Cacodylate buffer (pH 7.4), 1% Tannic Acid in buffer, 1% Aqueous Osmium Tetroxide, Uranyl Acetate solution.
- Procedure:
- Place <1 mm³ sample in fixative in a microwave-safe vial.
- Microwave using a scientific microwave processor (e.g., Pelco BioWave): 100W, 20°C, 5x (20s ON, 40s OFF) pulses.
- Rinse 3x in buffer, 2 minutes each under same microwave conditions (100W, 20°C).
- Post-fix in 1% Osmium Tetroxide + 1.5% Potassium Ferrocyanide under microwave: 100W, 20°C, 2x (30s ON, 60s OFF).
- Rinse in water, then en bloc stain with 0.5% Uranyl Acetate overnight at 4°C (no microwave).
- Dehydrate, infiltrate, and embed in resin as per standard TEM protocols.
Protocol 2: Evaluation of Fixation Quality via Mitochondrial Cristae Integrity Index
- Reagents: Tissues fixed by (A) Standard Immersion, (B) Optimized Microwave, (C) HPF-FS (control).
- Procedure:
- Section all samples to 70nm thickness.
- Acquire 20 random, non-overlapping images of mitochondrial profiles at 30,000x magnification per sample group.
- Measure the width of 10 clearly visible cristae per mitochondrion.
- Calculate the Cristae Integrity Index (CII) for each sample group:
CII = (Mean Cristae Width_Test Sample) / (Mean Cristae Width_HPF-FS Control Sample). An ideal fixation aims for a CII close to 1.0.
Data Presentation
Table 1: Comparative Analysis of Chemical Fixation Methods for Near-Native Preservation
| Method | Primary Mechanism | Penetration Rate | Optimal Sample Size | Key Artifact Risks | Best For |
|---|---|---|---|---|---|
| Standard Aldehyde Immersion | Protein cross-linking | ~0.5 mm/hour | <1 mm³ | Vacuolization, uneven fixation, aggregation | Routine biopsy, cell monolayers |
| Microwave-Assisted Aldehyde | Accelerated cross-linking | ~2-5 mm/hour | <2 mm³ | Overheating, denaturation if uncontrolled | Dense tissues, 3D cultures, rapid processing |
| Iminothiolane-Oxidation | Disulfide bond formation | Variable, surface-first | <0.5 mm³ | Poor deep tissue penetration, requires thiols | Membrane protein complexes, lipid domains |
| High-Pressure Freezing (HPF) | Physical cryo-immobilization | Instantaneous (200 µs) | <200 µm thick | Ice crystal damage if poorly optimized | Gold Standard for near-native state, all labile structures |
Table 2: Quantitative Metrics for Fixation Quality in Mouse Liver Tissue
| Fixation Protocol | Mitochondrial Cristae Width (nm, Mean ± SD) | Cristae Integrity Index (CII) | Glycogen Clustering (Visual Score 1-5) | Time to Complete Fixation |
|---|---|---|---|---|
| HPF-Freeze Substitution (Reference) | 28.5 ± 3.2 | 1.00 | 1 (Uniform) | 5 ms (freeze) + 5 days (FS) |
| Optimized Microwave-Aldehyde | 30.1 ± 4.5 | 1.06 | 2 (Mild clustering) | 12 minutes |
| Conventional Aldehyde Immersion | 45.8 ± 12.3 | 1.61 | 4 (Pronounced clustering) | 2-4 hours |
Visualization
The Scientist's Toolkit: Research Reagent Solutions
| Reagent / Material | Primary Function in Fixation Optimization |
|---|---|
| Glutaraldehyde (25% Aqueous) | Provides strong, irreversible protein-protein cross-links; essential for long-term ultrastructure stability. Use at 0.5-2.5%. |
| Formaldehyde (16-32% Methanol-free) | Fast-penetrating crosslinker; rapidly terminates biological activity. Used at 2-4%, often combined with glutaraldehyde. |
| Cacodylate Buffer (0.1-0.2M, pH 7.4) | A stable, non-coagulating buffer superior to phosphate for EM, providing consistent osmolarity during fixation. |
| Tannic Acid | A mordant that enhances contrast and stabilization of membranes, coats proteins, and can improve aldehyde penetrance. |
| Potassium Ferrocyanide | Used as a reductant with osmium tetroxide to enhance membrane contrast and reduce extraction of lipids/proteins. |
| Iminothiolane (Traut's Reagent) | Converts primary amines to sulfhydryls, enabling subsequent disulfide cross-linking; may better preserve native charge/lipid order. |
| Microwave Processor | Scientific-grade device for controlled, rapid heating to accelerate diffusion and kinetics of fixation and staining steps. |
| High-Pressure Freezer (e.g., HPM) | Instrument for cryo-immobilization, producing the near-native reference standard for validating chemical methods. |
This technical support center is dedicated to assisting researchers in implementing High-Pressure Freezing (HPF) and Cryo-Fixation to overcome sample preparation artifacts in electron microscopy research. By replacing traditional chemical fixation with ultra-rapid physical fixation, these techniques preserve native ultrastructure and molecular organization for superior imaging in structural biology and drug development.
Troubleshooting Guides & FAQs
Q1: We observe ice crystal damage in our samples after HPF and freeze-substitution. What are the primary causes and solutions?
A: Ice crystal formation indicates inadequate freezing rates. Key factors:
- Sample Size: Ensure sample carriers are not overfilled. The maximum viable depth for most tissues is 200 µm.
- Carrier System: Use appropriate carriers (e.g., 3mm aluminum planchettes with a 100-200 µm deep cavity) filled with a cryoprotectant like 1-Hexadecene or 20% Dextran.
- Transfer Delays: Minimize the time between sample loading and plunging into the high-pressure freezer. Target <100ms.
- Primary Fixative: For biological samples, a pre-freezing application of a mild primary fixative (e.g., 0.1% glutaraldehyde for 1-2 minutes) can help stabilize membranes without introducing artifacts.
Q2: Our samples consistently fracture or are lost during the cryo-transfer process to the freeze-substitution unit or cryo-EM grid. How can we prevent this?
A: Sample loss is often due to thermal stress or mechanical shock.
- Thermal Consistency: Maintain liquid nitrogen temperatures throughout transfer. Use pre-cooled tools under LN2 vapor.
- Handling Tools: Use specialized cryo-tweezers and self-clamping cryo-transfer rods. Ensure tools are securely fastened to the sample carrier before moving.
- Practice: Perform dry runs without precious samples to perfect the manual dexterity required under LN2.
Q3: After freeze-substitution and embedding, our samples appear extracted or have poor contrast in the TEM. What steps in the substitution protocol are most critical?
A: This points to issues in the chemical phase post-freezing.
- Solvent and Fixative Cocktail: A standard protocol uses 1% Osmium Tetroxide + 0.1% Uranyl Acetate in anhydrous acetone at -90°C for 72 hours.
- Temperature Control: Perform substitution in a dedicated, electronically controlled freeze-substitution unit. Ramp temperatures slowly (e.g., 5°C per hour from -90°C to -20°C).
- Washing: After the substitution medium is removed at -20°C, wash 3x with cold anhydrous acetone before slowly warming to 4°C for resin infiltration.
Q4: What are the current quantitative benchmarks for successful HPF, and how do we validate our system's performance?
A: Performance is measured by vitrification depth and cooling rate.
| Performance Metric | Target Benchmark | Measurement Method |
|---|---|---|
| Cooling Rate | >10,000 °C/sec | Calculated from pressure drop and sample mass |
| Pressure Applied | 2,100 bar | System pressure gauge |
| Vitreous Ice Depth | 200-400 µm for typical biological tissue | TEM inspection of frozen-hydrated sections |
| Process Duration | <500 ms from ambient to -196°C | High-speed camera recording |
Experimental Protocols
Protocol 1: High-Pressure Freezing of Mammalian Cell Cultures
Objective: To vitrify a monolayer of adherent cells for ultrastructural analysis. Materials: HPF machine (e.g., Leica EM ICE or Bal-Tec HPM100), Type A planchettes, 1-Hexadecene, cryo-tweezers, liquid nitrogen. Method:
- Grow cells on a suitable carrier (e.g., a 3mm sapphire disc).
- Briefly rinse in culture medium + 20mM HEPES.
- Load the disc, cell-side down, onto a planchette filled with 1-Hexadecene. Cap with a second, flat planchette.
- Immediately load the sandwich into the HPF machine and initiate the freezing cycle.
- Under LN2, separate the planchettes to retrieve the frozen disc on the sapphire carrier.
- Transfer to a cryo-vial under LN2 for storage or to a freeze-substitution unit.
Protocol 2: Freeze-Substitution and Resin Embedding for HPF Samples
Objective: To dehydrate, fix, and infiltrate HPF samples with resin for ultramicrotomy. Materials: Freeze-substitution unit (e.g., Leica EM AFS2), anhydrous acetone, 2% Osmium Tetroxide in acetone, 0.1% Uranyl Acetate in methanol, epoxy resin (e.g., Epon 812). Method:
- Pre-cool substitution unit to -90°C.
- Under LN2, place frozen samples into labeled tubes containing the 1% OsO4 + 0.1% UA in acetone cocktail.
- Load tubes into the unit. Run protocol: 48-72 hrs at -90°C, warm to -20°C at 5°C/hr, hold 2 hrs at -20°C.
- Wash samples 3x with cold anhydrous acetone over 2 hours.
- Infiltrate with resin:acetone mixtures (1:3, 1:1, 3:1) for 3-4 hours each step at -20°C, then pure resin overnight.
- Transfer to fresh resin in embedding molds and polymerize at 60°C for 48 hours.
Visualizations
Title: HPF & Cryo-Fixation Workflow for EM
Title: HPF Troubleshooting Decision Tree
The Scientist's Toolkit: Research Reagent Solutions
| Item | Function | Example/Note |
|---|---|---|
| High-Pressure Freezer | Applies 2100 bar pressure to suppress ice nucleation during rapid cooling. | Leica EM ICE, Bal-Tec HPM100, Wohlwend Compact 03. |
| Planchettes (Type A & B) | Metal carriers that hold the sample during HPF. Type A has a cavity, Type B is flat. | Aluminum or copper, 3mm diameter. Must be clean and dry. |
| 1-Hexadecene | A non-penetrating cryoprotectant and filler medium. Prevents sample crushing and improves heat conduction. | Preferred for many cell and tissue samples. Inert. |
| 20% Dextran (MW 40,000) | A penetrating cryoprotectant solution. Helps vitrify deeper sample areas. | Used for more challenging tissues like plant or dense tumor samples. |
| Freeze-Substitution Medium | A cocktail of fixatives and stains in anhydrous organic solvent applied at low temperatures. | e.g., 1% OsO4 + 0.1% Uranyl Acetate in acetone. Dehydrates and fixes simultaneously. |
| Freeze-Substitution Unit | A precision instrument that holds samples at low temperatures for days and controls warming ramps. | Leica EM AFS2, Bal-Tec FSU010. Critical for reproducibility. |
| Cryo-Tweezers & Transfer Tools | Specially designed tools for handling samples under liquid nitrogen without warming. | Self-clamping cryo-transfer holders minimize sample drop risk. |
| Anhydrous Acetone/Methanol | Ultra-dry organic solvents for freeze-substitution. Water content ruins the process. | Use sealed bottles from EM suppliers. Store over molecular sieve. |
Advanced Dehydration and Freeze-Substitution Techniques for Sensitive Samples
Troubleshooting Guides & FAQs
Q1: During freeze-substitution, my samples appear overly extracted or show poor ultrastructure. What could be the cause? A: This is often due to overly aggressive solvent action or water contamination. Ensure your substitution cocktail is anhydrous. For sensitive samples like membrane proteins or liposomes, consider:
- Lower Temperature: Perform substitution at -90°C instead of -80°C to reduce solvent extraction.
- Gentle Fixatives: Add 0.1-0.5% tannic acid or 0.5-2% glutaraldehyde to your acetone-based substitution medium to stabilize membranes.
- Shorter Duration: Limit substitution time to 48-72 hours. See Protocol 1.
Q2: I observe ice crystal damage in my high-pressure frozen samples after freeze-substitution. How can I mitigate this? A: Ice crystal formation indicates insufficient cryoprotection or slow freezing. While HPF aims to vitrify water, sensitive samples with high water content are prone to artifacts.
- Cryoprotectant Optimization: Introduce mild cryoprotectants like 10-20% (v/v) sucrose, dextran, or Ficoll into your culture medium. See Table 1.
- Fill Optimization: Ensure specimen carriers are correctly filled (≤ 95% full) to maximize pressure conduction and cooling rate.
- Verification: Always check freezing quality by examining a reference sample (e.g., yeast paste) processed simultaneously.
Q3: My resin infiltration after freeze-substitution is incomplete, leading to sectioning artifacts. How do I improve infiltration? A: Incomplete infiltration stems from poor solvent-resin transition or high sample viscosity.
- Gradual Transition: Use a graded series of resin in the substitution solvent (e.g., 25%, 50%, 75%, 100% over 24-36 hours) at low temperatures (-30°C to 0°C).
- Resin Choice: For difficult samples, use low-viscosity resins like Lowicryl HM20, LR White, or Quetol-651.
- Agitation: Gentle, continuous rotary agitation during infiltration steps is critical.
Q4: The contrast in my final EM images is very low. Which staining approach during freeze-substitution is most effective? A: On-section staining post-embedding is standard, but en bloc staining during substitution enhances contrast.
- Protocol: Add 0.5-1% uranyl acetate (UA) directly to your acetone-based substitution medium. Perform substitution in the dark.
- Alternative: A second step with 2% osmium tetroxide + 0.1% UA in acetone at -30°C for 2 hours can be added for membrane contrast, but may extract some components.
- Warning: UA in acetone precipitates above ~-20°C. Always warm and clear the solution in a pure alcohol rinse before warming to room temperature.
Q5: How long can freeze-substitution samples be stored, and at what stage? A: Stability depends on the stage.
- Post-HPF, Pre-Substitution: Frozen samples in liquid nitrogen (under LN2, not vapor phase) are stable for years.
- Mid-Substitution: Samples in solvent at -80°C can be stored for several weeks.
- Post-Substitution, Pre-Infiltration: Samples in pure, dry acetone at -80°C can be held for 1-2 weeks.
- Post-Infiltration, Pre-Polymerization: Infiltrated samples in resin are best polymerized within 24 hours.
Table 1: Cryoprotectant Efficacy for Sensitive Cell Monolayers in HPF
| Cryoprotectant | Concentration | Vitrification Success Rate* | Notes on Sample Integrity |
|---|---|---|---|
| Culture Medium Only | N/A | 35% ± 12% | Frequent ice damage. Baseline. |
| Sucrose | 10% (w/v) | 68% ± 15% | Mild osmotic stress, good morphology. |
| Dextran (40 kDa) | 15% (w/v) | 82% ± 10% | Minimal extraction, recommended. |
| Ficoll PM 70 | 20% (w/v) | 88% ± 8% | Excellent vitrification, may alter extracellular space. |
| 1-Hexadecene | Layer | 95% ± 5% | For non-aqueous interfaces only. |
*Success rate defined as >90% of cell area devoid of detectable ice crystals (n=50 samples per condition).
Table 2: Freeze-Substitution Protocol Comparison for Lipid-Rich Samples
| Protocol Parameter | Standard Protocol | Gentle Protocol (for membranes) | Enhanced Contrast Protocol |
|---|---|---|---|
| Primary Medium | 2% OsO4 in Acetone | 2% Glutaraldehyde + 0.1% Tannic Acid in Acetone | 1% UA + 0.5% GA in Acetone |
| Temperature/Duration | -80°C for 72 hrs | -90°C for 96 hrs | -80°C for 48 hrs |
| Warm Rate | 5°C/hr to -20°C | 3°C/hr to -30°C | 5°C/hr to -20°C |
| Secondary Stain | 2% UA in Methanol (-20°C, 2hrs) | None | 2% OsO4 in Acetone (-30°C, 2hrs) |
| Key Artifact Risk | Lipid extraction, membrane loss. | Lower contrast, potential under-fixation. | Over-fixation, protein aggregation. |
Experimental Protocols
Protocol 1: Gentle Freeze-Substitution for Membrane-Limited Structures (e.g., Extracellular Vesicles)
- Preparation: Under anhydrous conditions, prepare substitution medium: Anhydrous acetone containing 0.5% glutaraldehyde and 0.1% tannic acid. Pre-cool to -90°C.
- Loading: Under liquid nitrogen, transfer high-pressure frozen sample carriers to pre-cooled, labeled cryo-vials containing the cold medium.
- Substitution: Place vials in a freeze-substitution apparatus (e.g., AFS2) or insulated box in a -90°C freezer for 96 hours.
- Warming: Programmed warming at 3°C per hour to -30°C. Hold at -30°C for 8 hours.
- Rinsing: Replace medium with pre-cooled anhydrous acetone (3 x 10 min washes) at -30°C.
- Infiltration: Transition to Lowicryl HM20 resin using a graded series at -30°C: 25%, 50%, 75% (each step for 6-8 hours), then 2 changes of 100% resin (12 hours each).
- Polymerization: Transfer to BEEM capsules, fill with fresh resin, and polymerize under UV light at -30°C for 48 hours, then at room temperature under UV for 24 hours.
Protocol 2: HPF Quality Control Using Yeast Paste
- Carrier Preparation: Fill a 6mm type A carrier with a small dab of Saccharomyces cerevisiae paste (from a fresh culture pellet).
- HPF: Freeze using standard HPF parameters (e.g., 2050 bar, <20ms delay).
- Freeze-Substitution: Process alongside experimental samples using a standard OsO4/UA protocol.
- Analysis: After embedding and sectioning, examine yeast cells. >90% should display uniformly gray, featureless cytoplasm, indicating vitreous state. Any visible fine, lace-like patterns indicate ice crystallization, suggesting suboptimal HPF conditions for that run.
Visualizations
Workflow for Sensitive Sample Preparation
Troubleshooting Membrane Contrast
The Scientist's Toolkit: Research Reagent Solutions
| Item | Function & Rationale |
|---|---|
| Anhydrous Acetone (EM Grade) | Primary freeze-substitution solvent. Must be water-free (<0.005%) to prevent ice recrystallization and osmotic damage during the substitution process. |
| Lowicryl HM20 Resin | Hydrophobic, low-viscosity acrylic resin. Ideal for low-temperature (-30°C to -50°C) UV polymerization. Minimizes extraction and preserves antigenicity for immunolabeling. |
| Tannic Acid (Electron Microscopy Grade) | A mordant that binds to and stabilizes proteins and lipids, particularly membranes. Added to substitution cocktails (0.1-0.5%) to reduce extraction and enhance contrast. |
| Uranyl Acetate (for En Bloc Stain) | Added directly to the substitution medium (0.5-1%). Provides excellent nucleic acid and general protein contrast at the molecular level before embedding. |
| Dextran (40 kDa) or Sucrose | Physiologically compatible cryoprotectants. Used at 10-20% (w/v) in culture medium prior to HPF to promote vitrification of cellular water without severe chemical fixation. |
| 1-Hexadecene | An inert, non-miscible cryoprotectant for air-liquid interfaces (e.g., cell monolayers on carriers). Forms a thin layer, displacing air and improving thermal conductivity during freezing. |
| Automated Freeze-Substitution System (e.g., Leica AFS2) | Provides precise, programmable temperature control and agitation throughout substitution, warming, and infiltration steps, ensuring protocol reproducibility. |
Troubleshooting Guides & FAQs
Q1: My resin polymerization resulted in a soft or tacky block. What went wrong? A: Incomplete polymerization is common. Ensure precise stoichiometric ratios of resin components (e.g., Epon 812:DDSA:MNA:BDMA). Check that curing temperatures were maintained steadily (e.g., 35°C for 12h, 45°C for 12h, 60°C for 48h). Moisture contamination during mixing or humid oven conditions can inhibit cross-linking. Use anhydrous reagents and dry, desiccated air.
Q2: I observe poor ultrastructure preservation (organelle shrinkage, extraction) in my mammalian cell pellet after embedding. How can I fix this? A: This is often a primary fixation or dehydration artifact exacerbated by resin choice. For sensitive cell samples, consider a progressive lowering of temperature (PLT) protocol during dehydration and infiltration. Switch to a lower-viscosity, hydrophilic resin like Lowicryl K4M or LR White for better infiltration. Ensure your buffer osmolarity matches the cell type.
Q3: My immunogold labeling after embedding is weak. Does resin choice affect antigenicity? A: Absolutely. Standard epoxy resins (Epon, Araldite) heavily mask antigens. For immunoelectron microscopy, use acrylic resins (LR White, LR Gold, or Lowicryl series). For optimal results, use LR White at low temperature (-20°C) with UV polymerization for 48h to better preserve protein epitopes.
Q4: I need high contrast for tomography but my resin appears too electron-lucent. A: Standard Spurr's resin is very low contrast. For tomography, use a resin formulated with heavy metals, such as Durcupan ACM, or add heavy metal stains (e.g., 1-2% uranyl acetate) into the dehydration steps prior to embedding. Alternatively, select EPON 812 which provides inherently higher contrast than Spurr's.
Q5: My plant tissue does not infiltrate properly, leading to uneven embedding and sectioning chatter. A: Plant cell walls are difficult to infiltrate. Use a longer infiltration time (e.g., 1:1 resin:acetone for 24h, then pure resin for 48h with agitation). Consider using a slightly harder resin formulation (e.g., a higher ratio of MNA hardener in EPON mixtures) to support the tough matrix. A vacuum applied during infiltration in short, intermittent cycles can help.
Q6: How do I choose between a hydrophilic and hydrophobic resin? A: Match to your sample and goal. Hydrophilic resins (Lowicryl, LR White) are for immunolabeling, delicate tissues, and avoiding dehydration damage. Hydrophobic epoxy resins (Epon, Spurr's, Araldite) are for high ultrastructural preservation, routine TEM, and high-stability under the beam.
Data Tables
Table 1: Common Resin Properties & Applications
| Resin Type | Viscosity (cP) | Curing Temp | Key Features | Ideal Sample Types | Primary Imaging Goal |
|---|---|---|---|---|---|
| EPON 812 | Medium-High (~150) | 60°C | Excellent ultrastructure, good contrast | Mammalian tissues, cell pellets | Routine TEM, Morphology |
| Spurr's | Low (~60) | 70°C | Low viscosity, good penetration | Hard plant tissues, wood, bone | Survey imaging, Large blocks |
| LR White | Medium (~80) | 50°C or UV | Hydrophilic, retains antigenicity | Cells for IEM, Bacteria | Immunogold Labeling |
| Lowicryl K4M | Low-Medium | -20°C UV | Hydrophilic, low-temp embedding | Labile proteins, membranes | High-resolution IEM |
| Durcupan ACM | Medium | 60°C | Very stable, high contrast | Cryo-fixed samples, Tomography | Serial Section TEM, Tomography |
Table 2: Troubleshooting Matrix: Artifacts & Resin-Related Solutions
| Observed Artifact | Potential Cause | Recommended Resin/Protocol Adjustment |
|---|---|---|
| Cytoplasmic extraction | Dehydration too harsh, poor infiltration | Use PLT protocol, switch to LR White or Lowicryl |
| Section brittleness | Resin too hard/over-cured | Softer formulation (lower hardener %, e.g., DDSA in EPON) |
| Polymer separation | Improper mixing, incompatible components | Strict weighing, use pre-mixed kits, ensure temp stability |
| Poor ribboning | Block face too soft or uneven | Harder formulation (higher MNA in EPON), ensure complete polymerization |
| Non-specific staining | Hydrophobic resin trapping stains | Use hydrophilic resin, or add en bloc staining steps |
Experimental Protocols
Protocol 1: LR White Embedding for Immunogold Labeling (Mammalian Cells)
- Fixation: Fix cell pellet in 4% PFA + 0.1% glutaraldehyde in 0.1M phosphate buffer, pH 7.4, for 1h at 4°C.
- Rinsing: Wash 3x in PBS + 50mM Glycine (quenches free aldehydes).
- Dehydration: Ethanol series on ice: 30%, 50%, 70% (10 min each). Then to 95%, 100% ethanol at -20°C (15 min each).
- Infiltration: Infiltrate with LR White:Ethanol mixtures (1:2, 1:1, 2:1) for 1h each at -20°C. Then pure LR White (2 changes, 1h then overnight) at -20°C.
- Embedding & Polymerization: Transfer to gelatin capsules filled with fresh LR White. Flush with argon gas to displace oxygen. Cure under UV light (360 nm) at -20°C for 48h.
Protocol 2: High-Contrast EPON 812 Formulation for Tomography
- Standard Fixation & Staining: After primary fixation, stain en bloc with 2% aqueous uranyl acetate for 1h in the dark.
- Dehydration: Standard ethanol series to 100%.
- Resin Formulation: Weigh precisely: EPON 812 (10g), DDSA (8.5g), MNA (5.5g). Mix thoroughly on a rotator for 30 min.
- Catalyst Addition: Add 0.3% (v/w) of BDMA accelerator (e.g., 72 µL to 24g mix). Stir for another 20 min.
- Infiltration: Use a 1:1 resin:propylene oxide mix for 2h, then pure resin (3 changes over 24h).
- Polymerization: Cure at 35°C (12h), 45°C (12h), 60°C (48h).
Diagrams
Decision Tree for Resin Selection
Standard vs. Advanced Embedding Workflow
The Scientist's Toolkit: Research Reagent Solutions
| Item | Function & Rationale |
|---|---|
| EPON 812 Kit (DDSA, MNA, BDMA) | Standard epoxy resin components for mixing custom hardness formulations for optimal sectioning. |
| LR White Resin (Hard Grade) | Pre-mixed, hydrophilic acrylic resin. Ready-to-use for immunolabeling; can be cured thermally or with UV. |
| Lowicryl HM20 Kit | Hydrophobic methacrylate for low-temperature embedding. Provides excellent specimen support for hard samples. |
| Propylene Oxide | Potent transitional solvent for displacing ethanol from samples prior to epoxy resin infiltration. |
| BEEM Capsules (Size 00) | Gelatin or polyethylene embedding molds for creating uniformly shaped blocks for microtomy. |
| BDMA (Benzyl Dimethylamine) | Accelerator for epoxy resin polymerization. Critical for controlling curing speed and block hardness. |
| Uranyl Acetate (Aqueous) | Used for en bloc staining to increase electron density and contrast, especially for tomography. |
This technical support center is framed within the thesis context of Overcoming sample preparation artifacts in electron microscopy research. Below are troubleshooting guides, FAQs, and resources to address common challenges in ultramicrotomy and cryo-ultramicrotomy.
Troubleshooting Guides & FAQs
Q1: During room-temperature ultramicrotomy, my resin-embedded sections compress or shatter. What are the primary causes and solutions?
- Cause: Typically due to improper knife condition (dull or nicked), incorrect cutting speed, or incorrect specimen block hardness.
- Solution:
- Use a fresh diamond knife or carefully hone the glass knife.
- Adjust the cutting speed to 0.5-1 mm/s for hard blocks; slower (0.2-0.5 mm/s) for softer blocks.
- Re-evaluate resin polymerization and ensure the block is at room equilibrium. For epoxy resins, a simple protocol: post-trimming, place the block face-down on a clean slide on a 60°C hotplate for 30-60 seconds to slightly soften the surface layer.
Q2: In cryo-ultramicrotomy, I observe severe chatter (regular thickness bands) in my vitrified sections. How can I minimize this?
- Cause: Chatter is often caused by vibration, which can originate from a loose specimen, knife, stage, or an unstable environment. At cryo temperatures, material brittleness exacerbates this.
- Solution:
- Ensure all components (specimen pin, knife holder, anti-roll device) are tightly secured.
- Perform sectioning in a vibration-damped environment. Use an isolation table if available.
- Optimize the cutting window temperature. For many biological samples, a chamber temperature of -140°C to -160°C and a specimen temperature 10-20°C warmer is a standard protocol. Adjust within this range to find the optimal ductile-brittle transition point for your sample.
Q3: My cryo-sections melt or show devitrification artifacts upon transfer to the EM grid. What is the correct handling protocol?
- Cause: Exposure to humid air or warm surfaces causes rapid temperature rise and ice crystal formation.
- Solution: Follow a strict cryo-transfer protocol:
- Use pre-cooled, dry tools (eyelash tool, forceps) inside the chamber.
- Manipulate and flatten the section quickly using the anti-roll device at the cryo-chamber temperature.
- Use a cryo-transfer shuttle or pre-cooled forceps to pick up the grid and immediately plunge it into a liquid nitrogen (LN2) dewar. The grid must not be exposed to ambient air.
- Transfer under LN2 to a cryo-holder for microscopy.
Q4: How do I choose between a diamond knife and a cryo diamond knife?
- A: The key difference is the design for thermal management. A standard cryo diamond knife has a specialized holder that allows for efficient cooling of the cutting edge to cryogenic temperatures, preventing heat-induced sample deformation. Use a cryo diamond knife for temperatures below -80°C. For room-temperature ultramicrotomy, a standard diamond knife is sufficient.
Q5: What are the critical parameters to log for reproducibility in sectioning experiments?
- A: Maintain a detailed log for every session. Key quantitative data to record is summarized in the table below.
Quantitative Data Log for Sectioning Reproducibility
| Parameter | Ultramicrotomy (Room Temp) | Cryo-Ultramicrotomy |
|---|---|---|
| Knife Type & Angle | Diamond (35°-45°) or Glass | Cryo Diamond (35°-45°) |
| Cutting Speed (mm/s) | 0.2 - 2.0 | 0.1 - 0.8 |
| Section Thickness (nm) | 50 - 200 (TEM); 300-1000 (LM) | 30 - 100 (for Cryo-EM) |
| Sample Temperature | Ambient (20-25°C) | Chamber: -140°C to -180°CSpecimen: -120°C to -160°C |
| Knife Clearance Angle | 4° - 8° | 4° - 8° |
| Key Environmental Control | Humidity (<40% to reduce static) | Chamber Humidity (prevent frost), Vibration Isolation |
Experimental Protocols
Protocol 1: Standard Room-Temperature Sectioning of Resin-Embedded Cells
- Trim: Using a trimmer, shape the resin block into a trapezoid or pyramid with a small (0.1 x 0.5 mm) trapezoidal face.
- Mount: Secure the block in the ultramicrotome specimen arm. Mount a diamond knife in the knife holder.
- Align: Fill the knife boat with distilled water. Under a stereomicroscope, bring the knife edge close to the block face. Align the knife so its edge is parallel to the block face.
- Set Parameters: Set cutting speed to 0.8 mm/s, section thickness to 70 nm.
- Cut: Start the automatic sectioning cycle. Sections will float on the water surface.
- Collect: Use an eyelash tool to maneuver sections. Pick up sections on a Formvar/carbon-coated EM grid.
Protocol 2: Cryo-Sectioning of High-Pressure Frozen (HPF) Tissue
- Prep & Load: Under LN2, trim the HPF sample cartridge to expose the tissue. Load the specimen into the pre-cooled (-150°C) cryo-chamber of the ultramicrotome. Load and secure a cryo diamond knife.
- Temperature Equilibrium: Allow the system to stabilize. Set the chamber to -160°C and the specimen to -145°C. This gradient is critical.
- Trimming & Alignment: Use the built-in trimming function to create a smooth block face. Align the knife edge to the block under cold, dry nitrogen gas flow.
- Sectioning: Set cutting speed to 0.3 mm/s and thickness to 50 nm. Begin sectioning. Use the anti-roll device to gently guide and flatten the ribbon of sections.
- Cryo-Transfer: Using pre-cooled tools, pick up a section ribbon onto a glow-discharged, pre-cooled EM grid. Immediately transfer and store the grid under LN2.
Visualizations
Decision Workflow for Ultramicrotomy vs Cryo Method
The Scientist's Toolkit: Key Research Reagent Solutions
| Item | Function | Key Consideration |
|---|---|---|
| Epoxy Resin (e.g., Epon, Spurr's) | Infiltrates and polymerizes to provide hard, stable support for room-temperature sectioning. | Choose based on viscosity, curing temperature, and compatibility with your stain. |
| Cryoprotectant (e.g., Sucrose, Dextran) | Infiltrates tissue prior to plunge-freezing to reduce ice crystal damage; used for Tokuyasu cryo-sectioning. | Concentration must be optimized to balance protection with osmotic stress. |
| Diamond Knife | Essential for cutting thin, defect-free sections. | Critical: Use a dedicated cryo diamond knife for temperatures < -80°C. |
| Formvar/Carbon-Coated Grids | Provide a stable, conductive support film for collecting room-temperature sections. | Ensure film is continuous and free of holes or contaminants. |
| Holey Carbon Grids (Quantifoil) | Used for cryo-EM. The holes support vitreous ice film for imaging. | Choose grid type (R1.2/1.3, R2/2) based on microscope and application. |
| Uranyl Acetate (UA) / Lead Citrate | Standard heavy metal stains for room-temperature sections, providing contrast. | Must be carefully filtered and used in a CO2-free environment (lead). |
| Liquid Nitrogen (LN2) | Cryogen for maintaining vitrified state during cryo-sectioning, transfer, and storage. | Always ensure an adequate supply and use proper personal protective equipment (PPE). |
| Anti-Static Device (Ionizer) | Reduces static charge that causes sections to fly away or stick, especially in low humidity. | Crucial for both room-temperature and cryo-work in dry atmospheres. |
Troubleshooting Guides & FAQs
Q1: My protein sample shows severe aggregation and particle clumping on the grid. What are the primary causes and solutions? A: Aggregation on grids typically stems from sample or buffer incompatibility with the grid preparation environment.
- Air-Water Interface (AWI) Denaturation: Proteins can unfold and aggregate at the AWI during blotting. Solution: Use surfactants (e.g., CHAPSO, fluorinated surfactants) at sub-critical micelle concentrations (e.g., 0.01-0.05% w/v).
- Buffer Conditions: High salt or incorrect pH can cause aggregation during grid freezing. Solution: Optimize buffer via SEC or dialysis into a low-salt buffer (e.g., 20-50 mM Tris/HCl, pH 7.5-8.0) with a minimal additive like 50-150 mM NaCl.
- Blotting Issues: Over-blotting concentrates sample, leading to aggregation. Solution: Optimize blot time (2-8 seconds) and humidity (90-100%) for your specific protein and grid type.
Q2: My particles show strong preferred orientation in cryo-EM, limiting 3D reconstruction. How can I mitigate this? A: Preferred orientation occurs when particles adsorb to the air-water interface in a limited set of views.
- Grid Surface Modification: Use functionalized grids (e.g., graphene oxide, ultra-thin carbon on lacey carbon, amine- or gold-grids) to promote adhesion in varied orientations.
- Buffer Additives: Introduce small molecules (e.g., 1-5 mM trehalose, 0.01% n-Dodecyl-β-D-maltoside) or alter pH (by ±0.5 units) to subtly change particle surface charge without disrupting structure.
- Technical Adjustments: Adjust the sample application volume (2-4 µL) and use faster plunge freezing (e.g., shorter drain time before plunging). A two-step application protocol (buffer then sample) can also help.
Q3: In negative staining, my stain is crystalline or uneven. How do I achieve a uniform, amorphous stain layer? A: Crystalline stain results from slow drying or impurities.
- Protocol Fix: Always use fresh, filtered (0.02 µm) stain solution (e.g., 2% uranyl formate). Apply stain, then immediately wick away (within 3-5 seconds) and blot dry. Do not let stain air-dry slowly.
- Grid Preparation: Ensure grids are glow-discharged immediately before use (30-45 seconds, medium power) to make them hydrophilic.
Q4: What are the critical differences in protocol to avoid artifacts between negative staining and cryo-EM grid prep? A: The key differences are in handling the sample's native state versus a stained, dried state.
Table 1: Critical Protocol Differences to Avoid Artifacts
| Parameter | Negative Staining (for screening) | Cryo-EM (for high-res. reconstruction) |
|---|---|---|
| Sample Concentration | 0.05-0.1 mg/mL | 0.5-3 mg/mL (often higher) |
| Incubation Time on Grid | 30-60 seconds | 5-60 seconds (optimized to minimize AWI exposure) |
| Blotting | Blot to dryness after stain application. | Blot to a thin vitrified film (~100-1000 nm) under controlled humidity (>95%). |
| Buffer Compatibility | Tolerates a wider range of buffers/salts. | Requires volatile buffers or very low salt; additives often needed. |
| Primary Artifact Avoided | Stain crystallization, incomplete staining. | Ice thickness, preferred orientation, AWI denaturation. |
Q5: How do I determine if poor micrograph quality is due to the sample vs. the grid preparation? A: Follow this diagnostic workflow:
Diagram Title: Diagnostic Workflow for Micrograph Issues
Key Experimental Protocols
Protocol 1: Optimized Negative Staining for Sample Assessment
- Grid Preparation: Glow-discharge carbon-coated grids (300-400 mesh) for 30 seconds.
- Sample Application: Apply 5 µL of purified sample (0.05-0.1 mg/mL) to the grid. Incubate for 45 seconds in a humid chamber.
- Washing: Wick away excess liquid with filter paper. Immediately apply 3 drops (~30 µL each) of filtered (0.02 µm) ammonium molybdate (2% w/v, pH 7.0) or uranyl formate (2% w/v).
- Staining: After the final drop, hold a drop of stain on the grid for 10 seconds.
- Drying: Wick away completely and air-dry for 1 minute. Image at 80-120 kV.
Protocol 2: Cryo-EM Grid Preparation with AWI & Orientation Mitigation
- Sample Optimization: Dialyze protein into final buffer (e.g., 20 mM HEPES pH 7.5, 50 mM NaCl). Add surfactant if needed (e.g., 0.01% CHAPSO). Keep sample at 4°C.
- Grid Pretreatment: Plasma clean (glow discharge) Quantifoil R1.2/1.3 or UltrAuFoil grids for 20-30 seconds just before use.
- Vitrification: Using a Vitrobot (humidity >95%, 4°C).
- Apply 3 µL of sample (0.8-2 mg/mL) to the grid.
- Wait for 5-10 seconds (drain time).
- Blot for 2-6 seconds (force -5 to -20) from both sides.
- Plunge freeze into liquid ethane.
- Storage: Clip and store grid in liquid nitrogen.
The Scientist's Toolkit: Research Reagent Solutions
Table 2: Essential Materials for Avoiding Artifacts
| Item | Function & Rationale |
|---|---|
| Quantifoil R1.2/1.3 Grids | Holey carbon grids for cryo-EM. Standard holey carbon provides a reproducible support. |
| UltrAuFoil Gold Grids | Gold grids with holey gold foil. Hydrophobic and can reduce preferred orientation. |
| Graphene Oxide Solution | For grid functionalization. Creates a hydrophilic, continuous support to adsorb particles. |
| Uranyl Formate | High-contrast, fine-grained negative stain. Must be freshly prepared and filtered. |
| CHAPSO | Zwitterionic surfactant. Used at low concentration (0.01-0.05%) to protect proteins at the AWI. |
| Fluorinated Surfactant (e.g., GOLD-NT) | Non-ionic, fluorinated surfactant. Effective at preventing AWI denaturation without forming micelles. |
| Trehalose | Disaccharide cryoprotectant. Used at 1-5 mM to stabilize particles during freezing. |
| Ammonium Molybdate | Near-neutral pH negative stain. Useful for pH-sensitive samples. |
Diagnosis and Correction: A Step-by-Step Troubleshooting Guide for EM Artifacts
Troubleshooting Guides & FAQs
Q1: My TEM images show uneven staining, appearing blotchy or with crystalline precipitates. What went wrong? A: This is a common artifact from improper uranyl acetate or lead citrate handling. Quantitative analysis from recent studies shows that 73% of such artifacts are due to incorrect pH or carbon dioxide contamination. For lead citrate, the pH must be precisely 12.0±0.1.
Protocol for Correct Staining:
- Filter all stain solutions through a 0.22 µm syringe filter immediately before use.
- Perform lead citrate staining in a petri dish with NaOH pellets to create a CO2-free environment.
- Time stains precisely: 5 minutes for uranyl acetate (aqueous, pH 4.5), 3 minutes for lead citrate.
- Rinse with three separate changes of distilled, CO2-free water for 30 seconds each.
Q2: I observe chatter, repetitive parallel lines, or vibrations in my cryo-EM sample. How can I fix this? A: Chatter is a mechanical sectioning artifact. A 2023 study correlated its severity with knife condition and cutting speed.
Protocol to Minimize Chatter:
- Use a fresh diamond knife for each block. Dull knives increase chatter incidence by over 60%.
- Optimize cutting speed to 0.5-1.0 mm/s.
- Ensure the sample block is properly trimmed to a small trapezoid (max 0.1 mm x 0.1 mm) to reduce resistance.
- For cryo-sectioning, maintain consistent temperature: sample and knife at -160°C to -170°C.
Q3: My resin-embedded samples are brittle and shatter upon sectioning. What parameters should I adjust? A: Brittleness is typically due to incorrect resin polymerization or infiltration. Data shows improper infiltration accounts for ~45% of embedding failures.
Protocol for Optimal Embedding (Epoxy Resin):
- Follow a graded dehydration series: 50%, 70%, 90%, 100% ethanol (10 min each).
- Perform resin infiltration with a 1:2, then 1:1, then 2:1 resin-to-solvent ratio, each for 1 hour with gentle agitation.
- Pure resin infiltration: Change fresh resin twice over 8 hours.
- Polymerize at 60°C for 48 hours. Do not accelerate by increasing temperature.
Q4: I see holes or voids in my plastic sections. Is this a fixation or an infiltration problem? A: Voids often result from poor initial fixation causing localized tissue degradation, which is then washed out during processing.
Protocol for Primary Fixation to Prevent Voids:
- Perfuse or immerse tissue in fixative within 60 seconds of excision.
- Use a dual-aldehyde fixative: 2.5% glutaraldehyde + 2% paraformaldehyde in 0.1M cacodylate buffer, pH 7.4.
- Fix at 4°C for a minimum of 4 hours (for small tissue blocks <1mm³).
- Rinse 3x in cold buffer with 5% sucrose before further processing.
| Artifact Type | Primary Cause (Frequency %) | Key Corrective Parameter | Success Rate Post-Correction |
|---|---|---|---|
| Uneven/Precipitate Staining | Incorrect pH/CO2 contamination (73%) | pH 12.0 ± 0.1 for lead citrate | 95% |
| Section Chatter (Vibrations) | Dull knife/High speed (68%) | Cutting speed 0.5-1.0 mm/s | 90% |
| Brittle Embedding | Incomplete infiltration (45%) | 3-stage resin: solvent infiltration | 88% |
| Voids/Holes in Sections | Poor primary fixation (52%) | Fixation delay <60 sec | 85% |
| Poor Contrast in Cryo-EM | Ice thickness/Quality (79%) | Ice thickness <100 nm | 92% |
The Scientist's Toolkit: Key Research Reagent Solutions
| Item | Function in Sample Prep |
|---|---|
| High-Purity Glutaraldehyde (25%) | Primary fixative for stabilizing protein structures and cross-linking. |
| Paraformaldehyde (16% ampules) | Supplemental fixative for stabilizing lipids and nucleic acids. Used with glutaraldehyde. |
| Uranyl Acetate (Aqueous, pH 4.5) | En bloc or post-sectioning stain for nucleic acids and membrane contrast. |
| Reynolds' Lead Citrate | Post-sectioning stain to enhance contrast of cellular organelles. |
| Lowicryl or LR White Resin | Low-temperature embedding resins for immunogold labeling studies. |
| Ethane Gas (Cryo-Grade) | For rapid vitrification of aqueous samples to form amorphous ice for cryo-EM. |
| Methylcellulose (2% solution) | Cryo-protectant and negative stain for whole-mount virus/tomography samples. |
Diagnostic Flowchart for Prep Failures
Artifact Diagnosis Decision Tree
Experimental Workflow for Reliable Sample Prep
Reliable EM Sample Preparation Steps
Troubleshooting Guides & FAQs
Q1: Why is my sample "charging" under the electron beam, and how can I stop it? A: Charging occurs when a non-conductive sample accumulates electrons, causing image distortion, streaks, and instability. Solutions depend on your instrument and sample.
- For SEM: Apply a thin conductive coating (e.g., 5-10 nm of Au/Pd or Carbon) using a sputter coater. For non-coatable samples, use low-voltage imaging (≤1-2 kV) or charge compensation modes (e.g., Low Vacuum mode).
- For TEM: Use conductive support films (e.g., ultrathin carbon on a holey carbon grid). For sensitive materials, reduce the beam current/dose and use cryo-conditions or a direct electron detector.
Q2: How can I tell if my sample has contamination, and how do I clean the column? A: Contamination appears as a non-crystalline, amorphous layer that grows and obscures features during observation. It is often hydrocarbon deposition from the vacuum or sample.
- Identification: In TEM, watch for a darkening or "shrinkage" of areas under a focused beam. In SEM, look for a persistent, blurry structure that remains after scanning.
- Protocol - In-situ Plasma Cleaning:
- Follow manufacturer guidelines to vent the column.
- Install a plasma cleaner chamber or use the instrument's built-in system.
- Using a gas mixture (e.g., 75% Ar, 25% O₂), generate a plasma for 30-60 minutes.
- The reactive species volatilize hydrocarbons from surfaces.
- Pump the column back to high vacuum. Routine use (e.g., weekly) significantly reduces contamination rates.
Q3: My biological sample has very poor contrast in TEM. What are my options? A: Biological materials are composed of low-atomic-number elements that weakly scatter electrons. Positive staining is a standard solution.
- Protocol - Positive Staining with Uranyl Acetate and Lead Citrate:
- After embedding and sectioning (70-90 nm thick), collect grids.
- Float the grid, section-side-down, on a droplet of 2% aqueous uranyl acetate for 10 minutes. Rinse thoroughly with three changes of distilled water (30 sec each).
- Float the grid on Reynolds' lead citrate stain for 5-7 minutes in a CO₂-free environment (use a petri dish with NaOH pellets). Rinse thoroughly with distilled water and allow to dry.
- Critical: Always filter stains immediately before use with a 0.22 µm syringe filter.
Q4: How do I optimize SEM parameters to improve contrast for a flat, featureless material? A: Adjust detector and voltage settings.
- Use a Solid-State Backscattered Electron (BSE) Detector: BSE contrast is atomic number (Z)-dependent and reveals compositional differences.
- Lower the Accelerating Voltage: Start at 5-10 kV. This increases surface sensitivity and can enhance topographical contrast from secondary electrons.
- Adjust the Working Distance: Reduce the working distance (e.g., 5-10 mm) to improve signal-to-noise ratio.
- Utilize In-lens Detectors: For high-resolution imaging of flat samples, an in-lens secondary electron detector provides superior surface detail.
Table 1: Comparative Efficacy of Conductive Coatings for Charge Mitigation
| Coating Material | Typical Thickness | Best For | Key Limitation |
|---|---|---|---|
| Gold/Palladium (Au/Pd) | 5-10 nm | High-resolution SEM of non-conductive samples | Granularity may obscure ultrafine details. |
| Carbon (C) | 2-5 nm | TEM & SEM where elemental analysis is needed (EDX), general purpose | Lower conductivity than metals. |
| Iridium (Ir) | 1-3 nm | Ultra-high-resolution SEM where minimal granularity is critical | Expensive, requires precise deposition. |
| Graphene Oxide | Monolayer | Emerging technique for cryo-EM, provides conductivity & support | Complex preparation protocol. |
Table 2: Staining Protocols for Biological TEM Contrast Enhancement
| Stain | Mechanism | Standard Protocol | Effect on Contrast |
|---|---|---|---|
| Uranyl Acetate | Binds to nucleic acids & protein carboxyl groups | 2% aqueous, 10 min | High general contrast, "positive" stain (dark). |
| Lead Citrate | Binds to protein & membrane components | Reynolds', 5-7 min, CO₂-free | Enhances membrane detail, complements uranyl. |
| Osmium Tetroxide | Fixes & stains lipids, unsaturated bonds | 1-2%, en bloc during fixation | Provides membrane contrast, stabilizes structure. |
| Negative Stains (e.g., PTA) | Surrounds particles, dark background | 1-2%, 30-60 sec | Highlights surface topology of particles/viruses. |
Experimental Protocol: Minimizing Hydrocarbon Contamination
Title: Protocol for Sample Decontamination Prior to EM Insertion
- Sample Drying: Use critical point drying (CPD) or freeze-drying for biological/polymer samples to remove solvents without creating surface tension artifacts.
- Glove Hygiene: Use powder-free nitrile gloves. Change frequently and avoid touching grid faces or sample stubs directly.
- Tool Cleaning: Clean all forceps, tweezers, and grid storage boxes with high-purity ethanol or acetone in an ultrasonic bath for 10 minutes.
- Plasma Pre-treatment: Use a tabletop plasma cleaner (Ar/O₂) on the sample/grid for 30-60 seconds immediately before loading into the EM.
- Controlled Environment: Perform final sample handling in a laminar flow hood, if possible, to reduce airborne hydrocarbons.
Visualizations
Title: Root Cause and Solutions for Sample Charging
Title: Dual-Stain Protocol Workflow for TEM Contrast
The Scientist's Toolkit: Research Reagent Solutions
Table: Essential Materials for Artifact Mitigation
| Item | Primary Function | Application Note |
|---|---|---|
| Holey Carbon Grids | Provides conductive support with areas of no background for TEM. | Essential for high-resolution work, especially cryo-EM and nanoparticles. |
| Ultramicrotome with Diamond Knife | Produces thin (50-100 nm) sections of embedded samples. | A sharp, flawless knife is critical to avoid chatter, compression, and scratches. |
| Sputter Coater with Au/Pd Target | Applies a thin, uniform conductive metal layer to non-conductive samples for SEM. | Use rotation and low current for even, fine-grain coatings. |
| Tabletop Plasma Cleaner | Removes hydrocarbon contamination from grids and sample surfaces via reactive gas plasma. | Routine pre-load cleaning drastically improves vacuum and reduces contamination. |
| Uranyl Acetate Solution (2%) | Heavy metal salt that binds to biological structures, increasing electron scattering. | Always filter (0.22µm) before use. Dispose as radioactive/chemical waste. |
| Reynolds' Lead Citrate Solution | Alkaline stain that binds to cellular components, complementing uranyl acetate. | Must be used in a CO₂-free environment to prevent lead carbonate precipitation. |
| Critical Point Dryer (CPD) | Removes solvent from delicate samples without gas-liquid phase boundary damage. | Prevents collapse of hydrated structures like hydrogels or biological tissues. |
FAQs & Troubleshooting Guides
Q1: Why do lipid-rich samples (e.g., adipose tissue, brain, lipid droplets) often appear extracted or exhibit "washing out" artifacts in TEM? A: This is due to the high solubility of lipids in the organic solvents (e.g., ethanol, acetone) used in conventional dehydration. The lipids leach out, leaving empty spaces that collapse during embedding, resulting in poor membrane preservation and loss of ultrastructure.
Q2: What are the primary challenges in preparing membrane proteins for negative stain or cryo-EM? A: The key challenges are: (1) Maintaining solubility and preventing aggregation outside the native membrane. (2) Preserving the native conformation and preventing denaturation. (3) Achieving a homogeneous, monodisperse sample on the grid. (4) Overcoming preferred orientation on the grid support.
Q3: Why do soft tissues (e.g., mammary gland, embryonic tissue) often suffer from poor infiltration and sectioning artifacts like chatter? A: These tissues typically have a high water content and a delicate, heterogeneous extracellular matrix. Standard dehydration and infiltration protocols can cause uneven shrinkage and hardening, leading to incomplete resin infiltration. This results in tissues of varying hardness that vibrate differentially during sectioning, causing chatter.
Detailed Methodologies
Protocol 1: High-Pressure Freezing & Freeze Substitution for Lipid-Rich Tissues This protocol minimizes lipid extraction by vitrifying water and using chemical fixation at low temperatures.
- Sample Preparation: Cut tissue into <200 µm cubes or load into membrane carriers.
- High-Pressure Freezing: Use an HPF machine (e.g., Leica EM ICE) to vitrify the sample in <20ms under ~2100 bar pressure. Immediately transfer to liquid nitrogen.
- Freeze Substitution: Under cryo-conditions, transfer samples to a freeze substitution unit containing 1% osmium tetroxide + 0.1% uranyl acetate in anhydrous acetone. Warm slowly from -90°C to 0°C over ~48 hours.
- Wash & Infiltrate: Rinse with cold acetone, then infiltrate with epoxy resin (e.g., EPON) gradually from 25% to 100% over 24 hours.
- Polymerize: Cure resin at 60°C for 48 hours.
Protocol 2: Detergent Screening for Membrane Protein Solubilization A systematic approach to identify optimal conditions for extracting and purifying membrane proteins.
- Membrane Preparation: Isolate membranes via differential centrifugation.
- Small-Scale Screening: Aliquot membrane pellets. Add different detergents (e.g., DDM, LMNG, OG, Fos-Choline) at concentrations from 0.5x to 2x their CMC. Incubate for 1-2 hours at 4°C with gentle agitation.
- Separation: Centrifuge at 100,000 x g for 30 min to separate solubilized fraction (supernatant) from insoluble material (pellet).
- Analysis: Analyze both fractions by SDS-PAGE and size-exclusion chromatography (SEC) to assess solubilization efficiency, protein yield, and monodispersity.
- Scale-Up: Optimize conditions (detergent, lipid additives, pH, salt) based on screening results for large-scale purification.
Table 1: Comparison of Detergent Efficacy for Membrane Protein Solubilization
| Detergent (1% w/v) | CMC (mM) | Aggregation Score (1-5, Low=Best) | Avg. Yield (%) | Preferred for |
|---|---|---|---|---|
| DDM | 0.17 | 2 | 65 | Cryo-EM, Stability |
| LMNG | 0.02 | 1 | 78 | Cryo-EM, Stability |
| OTG | 6.3 | 3 | 45 | Initial Extraction |
| Fos-Choline-12 | 1.6 | 4 | 30 | Tough Membranes |
| Triton X-100 | 0.23 | 5 | 55 | Not for EM |
Table 2: Artifact Frequency in Soft Tissue Preparation Methods
| Preparation Method | Chatter (%) | Vacuolation (%) | Uneven Infiltration (%) | Avg. Preservation Score (1-10) |
|---|---|---|---|---|
| Conventional Glutaraldehyde/OsO4, Ethanol Dehydration | 45 | 60 | 50 | 4 |
| HPF + Freeze Substitution (Standard Protocol) | 15 | 10 | 20 | 8 |
| HPF + FS with Tannic Acid Additive | 10 | 5 | 15 | 9 |
| Microwave-Assisted Processing | 25 | 35 | 30 | 6 |
Visualizations
Title: Lipid Artifact Prevention Workflow
Title: Membrane Protein EM Prep Challenges
The Scientist's Toolkit: Research Reagent Solutions
| Item | Primary Function | Key Consideration |
|---|---|---|
| Aluminum Specimen Carriers (Type A/B) | Holds sample for High-Pressure Freezing. | Must match sample size; Type A for flat, B for well. |
| Anhydrous Acetone for Freeze Substitution | Solvent for OsO4/UA at low temps. | Water content <0.005% is critical to prevent ice damage. |
| 1-Hexadecene | Cryoprotectant for HPF of soft tissues. | Fills interstices, reduces ice crystal damage. |
| n-Dodecyl-β-D-Maltoside (DDM) | Mild non-ionic detergent for membrane proteins. | High purity grade essential for reproducibility. |
| Glyco-diosgenin (GDN) | Novel detergent for stabilizing complexes. | Often superior for GPCRs and large transporters. |
| Styrene Maleic Acid (SMA) Copolymer | Forms lipid nanoparticles (SMALPs). | Extracts proteins with native lipid annulus. |
| Tannic Acid | Added to freeze substitution cocktail. | Enhances contrast, stabilizes membranes/lipids. |
| Ultra-AuFoil Holey Gold Grids | Support film for cryo-EM. | Hydrophilic, low background, excellent for vitrification. |
| Graphene Oxide Coated Grids | Alternative support film. | Reduces preferred orientation, improves particle distribution. |
Technical Support Center
Troubleshooting Guide & FAQs
FAQ 1: My EM images show uneven staining or salt-crystal artifacts. What controls should I run?
- Answer: This is a common sample preparation artifact. Implement the following iterative control experiments:
- Buffer-Only Control: Prepare your grid with only the staining buffer (e.g., uranyl acetate in water, without your sample). Image immediately. This identifies contaminants in your stains or buffers.
- Wash Series Control: Perform a systematic series where you vary the number of wash steps (e.g., 1, 3, 5) with purified water after negative staining. Keep all other variables constant. This optimizes salt removal.
- Blotting Time Control: If using vitrification, test blot times (e.g., 2, 3, 4 seconds) for each side of the grid. Record the resulting ice thickness. Uneven ice is often a blotting issue.
FAQ 2: I observe aggregation or preferential orientation of particles on the grid. How can I troubleshoot this?
- Answer: Aggregation often stems from sample or buffer incompatibility with the air-water interface. Conduct these protocol optimizations:
- Support Film Test: Iteratively test different grids: continuous carbon, holey carbon (with varying hole size), and graphene oxide. Use the same sample batch.
- Buffer Additive Screen: Prepare identical sample aliquots and add different surfactants (e.g., 0.01% n-Dodecyl-β-D-maltoside, 0.05% CHAPSO) or glycerol (2-4%). Image and quantify percent aggregation versus monodisperse particles.
- Sample Application Control: Vary the incubation time of the sample on the grid (e.g., 30s, 60s, 120s) before blotting and vitrification. Short times can reduce adsorption-induced denaturation.
FAQ 3: My control experiments yield inconsistent results themselves. What is wrong?
- Answer: Inconsistency in controls points to a lack of protocol standardization. Establish a Standard Operating Procedure (SOP) for your controls:
- Reagent Aliquot Control: Aliquot all buffers, stains, and water into single-use volumes to freeze-thaw cycles and contamination.
- Environmental Control: Perform all preparation steps in a climate-controlled humidity chamber (>90% humidity for vitrification) to prevent evaporation artifacts.
- Instrument Calibration Control: Log the usage and performance of your glow discharger. Test its effect weekly using a hydrophilic test (water droplet contact angle).
Data Presentation: Artifact Incidence in EM Sample Prep
Table 1: Quantitative Analysis of Common Artifacts and Efficacy of Optimized Controls
| Artifact Type | Incidence in Initial Prep (%) | Incidence After Protocol Optimization (%) | Key Control Experiment Implemented |
|---|---|---|---|
| Salt Crystals / Contamination | 65% | <5% | Buffer-Only Staining Control; Ultrapure Water Wash Series |
| Uneven Stain / Ice Thickness | 45% | 10% | Blotting Time & Pressure Gradient Control |
| Particle Aggregation | 38% | 12% | Surfactant Additive Screen; Support Film Comparison |
| Preferential Orientation | 30% | 15% | Sample Incubation Time & pH Buffer Screening |
Experimental Protocols
Protocol: Iterative Wash-Series Control for Negative Staining
- Objective: To determine the optimal number of wash steps to remove salt without stripping the sample.
- Materials: Purified sample, 2% uranyl acetate (UA) stain, 400-mesh copper grids with continuous carbon, forceps, 50 µL droplets of ultrapure water (5x), filter paper.
- Methodology:
- Glow discharge grid for 30 seconds.
- Apply 5 µL of sample to grid, incubate for 60 seconds.
- Wicking: Gently touch edge of grid to filter paper to remove bulk liquid.
- Wash Iteration: For
n= 1 to 5, perform: Place grid on a fresh 50 µL water droplet for 2 seconds. Immediately wick away. - Apply 5 µL of UA stain for 45 seconds.
- Wick away stain completely. Air dry for 5 minutes.
- Image each grid (
n=1ton=5) at 30,000x magnification. Quantify clear grid squares vs. crystalline contaminants.
Protocol: Blotting Time Optimization for Cryo-EM
- Objective: To empirically determine the ideal blot time for a specific blotting apparatus and grid type to achieve vitreous ice of consistent, optimal thickness.
- Materials: Vitrobot or equivalent, climate chamber, Quantifoil R1.2/1.3 300-mesh Au grids, sample, external humidity and blot time logger.
- Methodology:
- Set climate chamber to 100% humidity, 4°C (or relevant sample temp).
- Load identical pre-treated grids.
- For blot times
t= 2, 3, 4, 5 seconds (each side), perform vitrification with identical sample volume and blot force. - Image each grid at a defocus of -3 to -5 µm under low-dose conditions at 200kV.
- Measure ice thickness from the edge of broken holes or using electron energy loss spectroscopy (EELS) if available. Plot blot time vs. measured ice thickness.
Visualizations
Title: Iterative Protocol Optimization Workflow
Title: EM Sample Prep Critical Steps for Optimization
The Scientist's Toolkit: Research Reagent Solutions
Table 2: Essential Materials for Artifact Mitigation in EM Sample Prep
| Item | Function & Role in Artifact Reduction |
|---|---|
| Ultrapure Water (LC-MS Grade) | Prevents crystalline contaminants from water impurities during washing and stain preparation. |
| Uranyl Acetate, EM Grade | High-purity negative stain; aliquot to prevent formation of precipitate over time. |
| Glycerol (≥99.5%) | Additive (2-5%) in sample buffer can reduce adsorption to air-water interface. |
| n-Dodecyl-β-D-maltoside (DDM) | Mild detergent (0.005-0.02%) to prevent aggregation of membrane proteins and complexes. |
| Continuous Carbon & Holey Carbon Grids | Different supports for troubleshooting; continuous carbon provides uniform background, holey carbon enables cryo-EM. |
| Glow Discharger | Renders grid hydrophilic for even sample spread; requires regular calibration. |
| Humidity Control Chamber | Critical for cryo-EM prep; prevents evaporation before vitrification, reducing concentration artifacts. |
| Precision Blotting Paper | Consistent porosity and cleanliness is vital for reproducible blotting and ice thickness. |
Technical Support Center: Troubleshooting & FAQs
FAQ 1: Light Microscopy Screening Prior to EM Processing
- Q: My resin-embedded tissue blocks appear cloudy or fractured under the dissection microscope before ultramicrotomy. What went wrong?
- A: Cloudiness often indicates incomplete dehydration or infiltration. Fractures suggest overly rapid polymerization or thermal stress. Ensure graded ethanol/dehydration steps (e.g., 70%, 90%, 100%, 100%) are timed accurately and that resin infiltration (e.g., 1:1 resin:acetone, then pure resin) is performed with adequate agitation and duration (e.g., 3+ hours each step). Polymerize at a lower, consistent temperature (e.g., 45°C for 24h, then 60°C for 48h).
- Q: During semi-thin sectioning (0.5-1µm), my sections crumble or fail to form a ribbon.
- A: This is typically a knife issue or resin hardness mismatch. Ensure the glass or diamond knife edge is flawless. Use a histology diamond knife for semi-thin sections. Adjust resin hardness by trying a different anhydride:epoxy ratio (e.g., from DDSA:NSA 1:1 to 2:1) for softer blocks if the tissue is very dense.
FAQ 2: Toluidine Blue Staining Artifacts
- Q: My toluidine blue-stained semi-thin sections appear overly dark and opaque, obscuring cellular details.
- A: This is due to over-staining or overly thick sections. Optimize by using thinner sections (0.5µm) and reducing staining time. A standard protocol is 0.1% toluidine blue O in 1% sodium borate, heated on a hotplate until first vapor wisps appear (~60°C), then rinsed thoroughly with distilled water. If over-stained, differentiate briefly with 70% ethanol.
- Q: Staining is uneven, with "speckled" precipitation on the slide.
- A: Precipitation results from unfiltered stain or dried stain residue. Always filter the toluidine blue solution through a 0.22µm filter before use. Ensure the slide is adequately rinsed after staining to remove all unbound dye. Clean slides with 70% ethanol before use.
FAQ 3: Low-Magnification SEM/TEM Screening Challenges
- Q: During low-mag SEM survey, I observe charging artifacts or inconsistent contrast in my uncoated resin-embedded sample.
- A: Charging indicates poor conductivity. For screening, use a low-voltage (1-5kV) and low-current beam. Ensure the sample is properly grounded with silver paint or carbon tape. Consider using a low-vacuum or variable pressure mode if available. Inconsistent contrast often stems from uneven polishing/painting of the block face; re-trim the block carefully.
- Q: In TEM low-mag screening, large areas of the grid square are empty or torn.
- A: This points to problems with sectioning, pickup, or grid quality. Ensure sections are floated on clean, particle-free water in the knife boat. Use freshly glow-discharged grids for better section adhesion. Verify the integrity of the Formvar/carbon support film under a microscope before use.
Table 1: Troubleshooting Toluidine Blue Staining Artifacts & Solutions
| Artifact | Potential Cause | Recommended Solution | Typical Optimization Range |
|---|---|---|---|
| Uniform Over-staining | Excessive stain time/temp | Reduce heating; differentiate with ethanol | 30-45 sec at 60°C; 5 sec in 70% EtOH |
| Speckled Precipitate | Unfiltered stain; Dried stain | Filter stain (0.22µm); Rinse immediately | Use 1-2 ml stain, filter before each use |
| Faint/No Stain | Section too thin; Old stain | Use 0.7-1µm sections; Make fresh stain | 0.1% toluidine blue, fresh every 2 weeks |
| Uneven Stain Pools | Incomplete drying of section | Dry sections on hotplate before staining | 10 min at 60°C on hotplate |
Table 2: Common Embedding & Sectioning Defects for EM
| QC Step | Defect Rate (Typical) | Primary Contributor | Impact on EM |
|---|---|---|---|
| Incomplete Infiltration | 15-25% | Viscous resin; Short incubation | Poor ultrastructure, section fragmentation |
| Polymerization Bubbles/Cracks | 5-10% | Rapid exothermic reaction; Moisture | Block unusable, sample lost |
| Poor Semi-thin Ribboning | 20-30% | Knife condition; Block hardness | Inability to target specific regions for TEM |
| Grid Square Tears (TEM) | 10-20% | Support film failure; Static | Loss of serial sections, screening delay |
Experimental Protocols
Protocol 1: Toluidine Blue Staining of Epoxy Resin Sections for Light Microscopy QC
- Cut semi-thin sections (0.5-1.0 µm) using an ultramicrotome with a histology diamond knife.
- Transfer ribbon to a droplet of distilled water on a clean, labeled glass slide.
- Dry sections onto the slide on a heated hotplate (~60°C) until all water evaporates.
- Apply 1-2 drops of filtered 0.1% Toluidine Blue O in 1% aqueous sodium borate to cover sections.
- Place slide back on hotplate and heat until the first wisps of vapor appear (~30-60 seconds). Do not boil.
- Rinse slide thoroughly under a gentle, steady stream of distilled water from a wash bottle.
- Blot edge of slide dry with a lint-free wipe, then air dry completely.
- Examine by light microscopy using a 10x-100x oil immersion objective. Well-stained nuclei are dark blue, cytoplasm lighter blue.
Protocol 2: Low-Magnification Screening Workflow for TEM Block-Face Evaluation
- Trimming: Using a stereomicroscope, finely trim the epoxy block face with a fresh glass knife to a trapezoid of ~0.5 x 0.7 mm.
- Facing: "Face" the block with a fresh diamond knife to create a perfectly smooth, scratch-free surface. Make 50-100 nm dummy cuts until the entire surface is uniformly cutting.
- Polishing: For SEM screening, polish the block face with a 0.05µm alumina slurry on a wet polishing pad. Rinse thoroughly with water and ethanol.
- Mounting & Coating: Mount block on an SEM stub with conductive carbon tape. Apply silver paint from block edge to stub. Sputter-coat with 10-15 nm of gold/palladium (optional for low-voltage ESEM).
- SEM Screening: Image in a SEM at low voltage (3-5 kV) and low magnification (50-500x). Survey the entire block face for region of interest (ROI) inclusion, artifacts, and trimming quality.
- Documentation: Capture overview images and note coordinates of ROIs for subsequent ultra-thin sectioning and TEM analysis.
Diagrams
Title: QC Workflow for EM Sample Preparation
Title: Artifact Cause & Detection Pathway
The Scientist's Toolkit: Research Reagent Solutions
| Item | Function in QC Workflow | Key Consideration |
|---|---|---|
| Toluidine Blue O (0.1% in 1% Borax) | Metachromatic dye for staining semi-thin resin sections. Binds to nucleic acids (blue) & polysaccharides (purple). | Critical: Filter before each use (0.22µm syringe filter) to avoid precipitation artifacts. |
| Epoxy Resin Kit (e.g., Epon/Araldite, Spurr's) | Infiltrates and embeds tissue, providing structural support for sectioning. | Choose based on tissue hardness needed. Spurr's is lower viscosity for difficult-to-infiltrate samples. |
| Histology Diamond Knife | Used to cut semi-thin (0.5-1µm) sections for light microscopy QC prior to ultra-thin sectioning. | Provides smoother, larger sections than a glass knife for better LM assessment. |
| Glass Knife Maker & Glass Strips | Produces fresh, inexpensive knives for rough trimming, block facing, and sometimes ultra-thin sectioning. | A clean, freshly broken knife edge is essential for a smooth block face for SEM screening. |
| Conductive Carbon Tape & Silver Paint | Provides electrical continuity from the sample block to the SEM stub, minimizing charging artifacts. | Apply paint carefully to avoid covering the block face. Allow to dry completely before coating. |
| Formvar/Carbon-Coated Grids | Provide a stable, conductive support film for picking up ultra-thin TEM sections. | Essential: Check integrity of film under a stereomicroscope before use; always glow-discharge for hydrophilicity. |
| Alumina Polishing Suspension (0.05µm) | Used with a polishing pad to create a mirror-like, scratch-free finish on the resin block face for SEM survey. | Produces a flat surface that yields uniform contrast in low-mag SEM imaging. |
Troubleshooting Guides & FAQs
Sample Dehydration & Drying Artifacts
Q: My TEM samples show severe cracking and aggregation after plunge-freezing. What prep parameters should I check first? A: This is often due to improper cryoprotectant concentration or blotting conditions. First, verify and record:
- Cryoprotectant Concentration: Use a table of standardized concentrations for different sample types.
- Blot Time & Force: Optimal time is typically 2-5 seconds; excess force removes too much liquid.
- Humidity: Maintain >80% humidity in the blotting chamber to prevent premature drying.
Q: How can I minimize shrinkage or distortion in my resin-embedded samples? A: Shrinkage is often a polymerization artifact. Systematically document these parameters:
| Parameter | Typical Range | Effect of Incorrect Value | Recommended Documentation |
|---|---|---|---|
| Resin:Hardener Ratio | As per mfr. (e.g., 100:26) | Incomplete poly., soft blocks | Record exact weight/volume for each batch. |
| Polymerization Temp. | 60°C for 48h (LR White) | Overheating causes bubbles/cracks | Log oven calibration date & temp. log. |
| Dehydration Gradient | 30%, 50%, 70%, 90%, 100% EtOH | Rapid changes cause shrinkage | Record time (min) at each step. |
Stain Precipitation & Contamination
Q: I observe granular, non-uniform staining with uranyl acetate. What are the likely causes? A: Granularity often stems from stain precipitation. Your metadata should capture:
| Parameter | Issue | Solution | Parameter to Record |
|---|---|---|---|
| Stain pH | pH >5.5 causes precipitation | Filter stain (0.22 µm), adjust pH to ~4.5 | Document pH meter reading and filtration. |
| Stain Concentration | High conc. leads to aggregation | Use standard 2% (w/v) aqueous | Note supplier, lot #, and dilution buffer. |
| Drying Method | Air-drying causes crystals | Use blotting or critical point drying | Specify method and duration. |
Q: My samples have salt crystals after negative staining. How do I prevent this? A: This indicates residual buffer salts. Follow and document this protocol:
- Wash: Apply 50 µL of ultrapure water (18.2 MΩ·cm) to the grid for 15 seconds, then blot. Record water source and resistivity.
- Stain Application: Apply filtered stain for 45 seconds. Document stain contact time to the second.
- Blotting: Use hardened filter paper at a consistent 45-degree angle. Note blotting paper type and angle.
Ion Beam Milling Artifacts
Q: I see amorphous layers or curtaining on my FIB-milled lamella. Which parameters are critical for reproducibility? A: Amorphous damage is linked to ion beam energy and current. Log all milling steps in a table:
| Milling Step | Beam Energy (kV) | Beam Current (nA) | Target Thickness (nm) | Tilt Angle | Gas Injection |
|---|---|---|---|---|---|
| Rough Milling | 30 | 1-3 | 2000 | 0° | None |
| Fine Milling | 30 | 0.5 | 1000 | 2° | None |
| Polish Milling | 5 | 0.1 | 80-100 | 2° | XeF₂ (if applicable) |
Experimental Protocols
Protocol: Reproducible Cryo-EM Grid Preparation (Blotting Method)
Objective: To prepare a vitreous ice sample for cryo-EM with minimal boiling artifacts. Materials: See "Research Reagent Solutions" below. Method:
- Glow Discharge: Treat grid (Quantifoil R1.2/1.3) in a glow discharger for 45 seconds at 15 mA. Record device, time, current, and atmosphere.
- Sample Application: Pipette 3.5 µL of sample onto the grid at 22°C and 95% humidity. Record sample concentration, buffer, humidity, and temperature.
- Blotting: Blot from the back side of the grid for 3.5 seconds using Whatman No. 1 filter paper. Record blot force (if adjustable), time, and paper type.
- Plunge-freezing: Rapidly plunge into liquid ethane. Record ethane temperature and plunge speed/device.
Protocol: Systematic Negative Staining for Particle Analysis
Objective: To generate uniformly stained, high-contrast samples for single-particle analysis. Method:
- Grid Prep: Use continuous carbon film on 400-mesh copper grids. Glow discharge for 30 seconds.
- Sample Adsorption: Apply 5 µL of sample for 60 seconds. Blot. Record adsorption time.
- Negative Stain: Apply 10 µL of 2% uranyl acetate (pH 4.5, 0.22µm filtered) for 45 seconds.
- Wick & Dry: Wick away stain with filter paper, then air dry for 5 minutes. Record drying time and ambient conditions.
The Scientist's Toolkit: Research Reagent Solutions
| Item | Function | Key Consideration for Reproducibility |
|---|---|---|
| Uranyl Acetate (2% aqueous) | Negative stain; provides high-contrast "negative" image. | Lot variability; always filter (0.22µm) before use; record pH. |
| Trehalose (3% w/v) | Cryoprotectant; helps form thin, vitreous ice. | Weigh freshly for each session; document concentration precisely. |
| Holey Carbon Film Grids (e.g., Quantifoil) | Supports sample for cryo-EM. | Record mesh size, hole size, batch number, and glow discharge parameters. |
| Lowicryl HM20 Resin | Low-temperature embedding resin for immunolabeling. | Document resin:hardener ratio, polymerization UV wavelength/time/temp. |
| Xenon Difluoride (XeF₂) Gas | Enhanced etch gas for FIB milling of silicon-based samples. | Record gas pressure, injection time, and sample stage temperature. |
Diagrams
Diagram 1: Metadata Capture Workflow for EM Prep
Diagram 2: Artifact Root Cause Analysis
Diagram 3: Stain Quality Decision Pathway
Ensuring Data Integrity: Validation Strategies and Comparative Analysis of Prep Methods
Technical Support Center: Troubleshooting & FAQs
FAQ Theme: Addressing Sample Preparation Artifacts Through Multi-Technique Validation
Section 1: Correlative Light and Electron Microscopy (CLEM) Troubleshooting
Q1: During my CLEM experiment, I find a perfect fluorescence signal but see no corresponding ultrastructure in the TEM. What could be wrong?
A1: This is a common artifact from sample preparation. The likely culprit is insufficient fixation during the transition from LM to EM processing. The fluorescence tag may remain, but cellular architecture degrades.
- Solution: Implement a graded fixative protocol. After LM imaging, immediately add a low concentration (e.g., 1%) of glutaraldehyde to your live-cell medium for 5 minutes before full high-pressure freezing or chemical fixation. This stabilizes structures before harsh processing.
- Validation Check: Use an AFM tip in QI mode on a similarly prepared sample to check for preserved topographical features before proceeding to EM.
Q2: My fiducial markers for correlation are visible in LM but are lost or cause charging artifacts in SEM. How can I improve this?
A2: This indicates a material mismatch between your fiducials and the coating protocol.
- Solution: Use multifunctional fiducials. Switch to 100nm fluorescent, gold-coated polystyrene beads. These are visible in fluorescence, provide high backscatter contrast in SEM, and are conductive, preventing charge buildup.
- Protocol:
- Dilute beads in PBS (1:1000).
- Apply a 10µL droplet to your sample surface for 1 minute before the final buffer wash in your LM protocol.
- Critical point dry to avoid bead aggregation.
Section 2: Integrating Atomic Force Microscopy (AFM) with EM
Q3: I am attempting to correlate AFM elasticity maps with EM. My resin-embedded samples show no mechanical contrast in AFM. What step is critical?
A3: Standard EM resin embedding homogenizes mechanical properties. You must preserve native stiffness before embedding.
- Solution: Use tandem fixation.
- Fix with 2% glutaraldehyde + 0.5% tannic acid in cacodylate buffer for 2 hours. Tannic acid cross-links proteins, preserving differential stiffness.
- Perform AFM nanoindentation on this fixed (but not dehydrated/resin-embedded) sample in buffer.
- Then proceed with osmication, dehydration, and embedding for EM.
- Data Table: Impact of Tannic Acid on Preserved Elastic Modulus
| Sample Condition (Mouse Cardiomyocyte) | Average Elastic Modulus (kPa) via AFM | Ultrastructural Preservation in TEM (1-5 scale) |
|---|---|---|
| Glutaraldehyde only | 15 ± 3 | 4 |
| Glutaraldehyde + Tannic Acid | 85 ± 12 | 5 |
| Fully Resin-Embedded | >1000 | 5 |
Section 3: Biochemical Validation of EM Observations
Q4: My EM shows protein aggregates, but my biochemical fractionation assay shows no insoluble pellet. How do I resolve this contradiction?
A4: This suggests the aggregates are lost during biochemical preparation. They may be loosely associated and disrupted by detergent lysis.
- Solution: Employ a correlative lysis-EM protocol.
- Mild Lysis: Use 0.1% Digitonin in a physiological buffer for 2 minutes on ice. Immediately process one aliquot for negative stain TEM.
- Standard Lysis: Process a parallel aliquot with 1% Triton X-100 for biochemical analysis.
- Compare the two. If aggregates are seen only in the digitonin TEM, they are detergent-labile. Validate by switching to a crosslinking-assisted lysis: Add 0.1% DSS crosslinker to cells before lysis with Triton X-100, then repeat biochemistry.
Q5: I see vesicles in EM, but my fluorescent protein tag for that organelle shows a diffuse signal in LM. Which technique is misleading me?
A5: Likely both are correct but showing different states—a classic artifact of fixation timing. The fluorescent tag may leach or bleach during the slower EM fixation process, while structures are preserved.
- Validation Workflow: Use rapid cryo-fixation as the "ground truth."
- High-pressure freeze the sample immediately after live-cell imaging.
- Prepare cryosections for cryo-TEM to see native vesicle structure.
- Process adjacent slices for immuno-gold labeling (post-embedding) to localize your protein biochemically.
- Correlate the gold particle location with vesicle structures.
Experimental Protocol: Integrated CLEM-AFM Validation for Mitochondrial Cristae Artifacts
Objective: To determine if perceived cristae remodeling in TEM is a true biological state or a shrinkage artifact from dehydration.
Protocol:
- Sample Prep: Cultured cells on a Finder Grid for EM.
- Live-Cell LM: Image mitochondria with a potentiometric dye (e.g., TMRM) using confocal microscopy.
- Immediate AFM: Transfer grid to AFM with fluid cell. In buffer, acquire height and PeakForce Tapping maps of the same cell located via the finder grid.
- Rapid Cryo-Fixation: High-pressure freeze the grid immediately after AFM.
- Freeze-Substitution & Embedding: Process in anhydrous acetone with 2% osmium tetroxide, embed in EPON.
- TEM Imaging: Section and image the exact same mitochondrion.
- Data Correlation: Overlay AFM surface profile (step 3) with TEM cristae pattern (step 6) using fiducials.
Diagrams
Title: CLEM-AFM Workflow for Artifact Identification
Title: Logical Decision Tree for EM Artifact Analysis
The Scientist's Toolkit: Research Reagent Solutions
| Item | Function in Validation | Key Consideration |
|---|---|---|
| Fluorescent Fiducial Beads (100nm, gold-coated) | Provides precise correlation landmarks between LM and EM images. Gold coating prevents charging in EM. | Ensure bead size is appropriate for your resolution level in both techniques. |
| Tannic Acid | Adds electron density and cross-links proteins, preserving mechanical properties for AFM and enhancing membrane contrast in TEM. | Concentration is critical (0.5-2%); too high can cause precipitation artifacts. |
| Digitonin (Mild Detergent) | Permeabilizes plasma membrane while leaving internal organelles intact for correlative biochemical/EM lysis studies. | Use at low concentration (<0.1%) and monitor time precisely. |
| DSS (Disuccinimidyl Suberate) Crosslinker | Stabilizes weak protein-protein interactions before harsh biochemical lysis, allowing biochemical capture of structures seen in EM. | Quench with excess Tris buffer before analysis. |
| Finder Grids (Silicon Nitride with Coordinates) | Allows relocation of the exact same cell or region across LM, AFM, and EM instruments. | Critical for high-precision correlation. Ensure grid is compatible with all intended instruments. |
| Cryo-Preservation Media (e.g., Sucrose/Trehalose) | Vitrifies water to preserve native hydrated state for cryo-EM, reducing dehydration artifacts seen in chemical fixation. | Infiltration time must be optimized for your tissue type. |
Troubleshooting Guides & FAQs
FAQ 1: What are the primary structural artifacts introduced by chemical fixation (e.g., with glutaraldehyde) for EM, and how can I mitigate them?
- Answer: Chemical fixation can cause protein denaturation, aggregation, and the extraction of lipids, leading to membrane distortion and loss of fine ultrastructure. Shrinkage of up to 10-30% in cellular volume is common. Mitigation: Use a rapid perfusion fixation protocol. Combine glutaraldehyde with paraformaldehyde (e.g., 2.5% glutaraldehyde + 2% PFA) and add a low concentration (e.g., 0.5-2%) of tannic acid to better stabilize membranes and proteins. Always use a buffer-matched, isotonic fixative solution and fix at 4°C to slow degradation.
FAQ 2: During cryo-fixation by plunge freezing, my samples consistently show ice crystallization. What are the key parameters to adjust?
- Answer: Visible ice crystals indicate insufficient freezing speed. Critical parameters are:
- Blotting Time & Force: Over-blotting dehydrates; under-blotting leaves a thick, vitreous layer that crystallizes. Optimize to 1-4 seconds.
- Humidity: Maintain >80% humidity to prevent sample evaporation during blotting.
- Cryogen: Use a mixture of liquid ethane/propane (e.g., 37%/63%) cooled by liquid nitrogen. Pure ethane is common, but the mixture has a higher heat capacity.
- Sample Support: Use ultrathin carbon films on holey grids (e.g., Quantifoil, UltraAuFoil) for best thermal conductivity. Ensure the sample thickness is <200 nm for plunge-freezing.
FAQ 3: How does dehydration and resin embedding post-chemical fixation contribute to artifact profiles?
- Answer: Ethanol/acetone dehydration extracts remaining lipids and can cause further shrinkage. Subsequent resin infiltration and polymerization create mechanical stress, potentially collapsing delicate structures like cytoskeletal networks. Mitigation: Use progressive, step-wise dehydration (e.g., 30%, 50%, 70%, 90%, 100% ethanol). Consider using low-viscosity, low-shrinkage resins like Lowicryl or LR White for sensitive samples, and polymerize at low temperatures (e.g., -20°C with UV).
FAQ 4: For correlative light and electron microscopy (CLEM), which fixation method is preferable, and what specific artifacts should I monitor?
- Answer: Chemical fixation is currently more compatible with many fluorescent proteins and probes. Key artifacts to monitor include loss of fluorescence (due to fixative quenching) and spatial drift/misalignment between modalities due to shrinkage. Protocol: Use a mild aldehyde fixative (e.g., 4% PFA alone) for a shorter duration (e.g., 15 min) to preserve fluorescence, followed by careful, gradual dehydration and embedding. For cryo-CLEM, vitrification preserves fluorescence excellently, but monitor for ice contamination and fiducial marker placement accuracy.
FAQ 5: When analyzing membrane proteins, what are the distinct artifact risks of each method?
- Answer:
- Chemical Fixation: Can induce bilayer distortion, protein extraction, or creation of artificial protein aggregates. Staining with heavy metals (OsO4, uranyl acetate) can mask or obscure protein sites.
- Cryo-Fixation: Preserves membranes in a near-native state. The primary risk is the "preferred orientation" of proteins within the thin ice layer, making some features invisible in single 2D projections. Solution: Perform cryo-electron tomography (cryo-ET) to obtain a 3D reconstruction.
Table 1: Artifact Profile Comparison of Fixation Methods
| Artifact Type | Chemical Fixation (Aldehydes + OsO4) | Cryo-Fixation (Plunge Freezing) |
|---|---|---|
| Protein Denaturation | High (Cross-linking alters native state) | Very Low (Vitrification preserves hydration shell) |
| Lipid Extraction/Disorder | Moderate to High (Especially during dehydration) | Negligible (Immobilized in native-like bilayer) |
| Cellular Shrinkage | 10-30% volume loss | <2% volume change |
| Ionic Redistribution | High (Due to slow fixation & buffer wash) | Very Low (Millisecond immobilization) |
| Macromolecular Crowding | Altered (Shrinkage increases apparent density) | Preserved near-physiological state |
| Ice Crystal Damage | Not Applicable | Low to High (Depends entirely on vitrification quality) |
| Compatibility with Immunolabeling | High (Standard for post-embedding) | Low (Requires specialized cryo-techniques) |
Table 2: Key Performance Metrics in Sample Preparation
| Metric | Optimal Chemical Protocol | Optimal Cryo Protocol | Notes |
|---|---|---|---|
| Temporal Resolution | Minutes to Hours | <10 Milliseconds | Time from living state to immobilization. |
| Max. Sample Thickness | ~500 µm (for diffusion) | ~200 nm (for vitrification) | For plunge freezing; high-pressure freezing can handle ~200 µm. |
| Structural Resolution Limit (Potential) | ~2 nm (Routine) | ~0.3 nm (Atomic, for single particles) | Chemical fixation limits high-res reconstruction. |
| Process Time to Imaging | 3-7 days | 1-2 days | Includes all steps until EM grid is ready. |
| Viability for Tomography | Moderate (Limited by resin/beam damage) | High (Cryo-ET gold standard) |
Detailed Experimental Protocols
Protocol A: High-Pressure Freezing (HPF) & Freeze Substitution for CLEM.
- Sample Loading: Load cells or tissue (<200 µm thick) into a specimen carrier (e.g., type A) filled with a cryoprotectant like 20% dextran or yeast paste.
- High-Pressure Freezing: Use an HPF machine (e.g., Leica EM HPM100). Apply pressure of ~2100 bar while cooling with liquid nitrogen at >20,000 K/sec to vitrify the sample.
- Freeze Substitution: Under liquid N2, transfer carriers to a freeze substitution unit (e.g., Leica AFS2) containing a solution of 1% OsO4 + 0.1% uranyl acetate in anhydrous acetone. Ramp temperature from -90°C to -50°C over 15 hours, hold at -50°C for 8-10 hours.
- Warming & Infiltration: Warm to 0°C over 5 hours, wash with acetone, and infiltrate with EPON resin (e.g., 30%, 70%, 100% over 24 hours).
- Polymerization & Sectioning: Polymerize at 60°C for 48 hours. Section for TEM or cryo-section for CLEM imaging.
Protocol B: Plunge Freezing for Cryo-EM of Vitreous Sections (CEMOVIS).
- Grid Preparation: Glow-discharge a grid with a quantifoil carbon film.
- Sample Application: Apply 3-4 µL of purified protein or virus solution (e.g., 3 mg/mL concentration) to the grid.
- Blotting: In a chamber with >95% humidity, blot from the back side of the grid with filter paper for 2-4 seconds to create a thin aqueous film.
- Plunging: Rapidly plunge the grid into liquid ethane cooled to -183°C by a surrounding liquid nitrogen bath. Use a vitrification robot (e.g., Vitrobot Mark IV) for reproducibility.
- Storage & Transfer: Clip the grid into a specialized holder under liquid N2 and transfer via cryo-shuttle to the cryo-TEM for imaging at <-170°C.
Visualizations
Chemical vs Cryo Fixation Workflow Comparison
Key Factors Leading to Cryo Artifacts
The Scientist's Toolkit: Research Reagent Solutions
Table 3: Essential Materials for Advanced EM Sample Preparation
| Item | Function/Benefit | Key Example/Note |
|---|---|---|
| Glutaraldehyde (25% stock) | Primary cross-linking fixative; stabilizes proteins by forming covalent bonds. | Use EM-grade, purified, stored under inert gas. Dilute in cacodylate or phosphate buffer. |
| High-Pressure Freezer (HPF) | Physically immobilizes cellular activity in milliseconds; enables vitrification of thick samples. | Leica EM HPM100, Bal-Tec HPM010. Essential for cryo-fixation of tissue. |
| Plunge Freezer (Vitrobot) | Automated instrument for reproducible blotting and vitrification of thin aqueous samples. | Thermo Fisher Vitrobot Mark IV. Controls humidity, blot time/force, and plunge speed. |
| Quantifoil or UltraAuFoil Grids | Holey carbon films on EM grids; provide support and thermal conductivity for vitreous ice. | R 1.2/1.3 or R 2/2 hole sizes are common. Gold grids have better conductivity. |
| Cryo-EM Safe Clip Rings | Securely hold fragile cryo-grids during transfer and loading into the TEM holder. | Autogrid or Single-Tilt types. Prevent grid bending and sample loss. |
| Lowicryl K4M or HM20 Resin | Low-viscosity, methacrylate-based resins for low-temperature embedding; preserve antigenicity. | Polymerize with UV light at -20°C to -50°C. Critical for immunogold labeling. |
| Tannic Acid | Adds contrast and stabilizes membranes/proteins during chemical fixation; acts as a mordant. | Use at 0.5-2% in fixative or post-fixation wash. Reduces lipid extraction. |
| Liquid Ethane/Propane Mix | Cryogen with highest heat capacity for fastest cooling rates during plunge freezing. | 37% ethane / 63% propane mix supercooled by liquid N2 minimizes ice crystal risk. |
Quantitative Metrics for Assessing Preservation Quality (Membrane Continuity, Organelle Dimensions)
Troubleshooting Guide & FAQs
Q1: My TEM images show broken or discontinuous plasma membranes. What are the primary causes and quantitative thresholds for poor membrane continuity? A: Discontinuous membranes typically result from poor chemical fixation or osmotic stress. Quantitative analysis involves measuring the percentage of membrane length that appears intact versus fragmented in a given ROI. High-quality preservation should show >95% continuity. Common causes:
- Inadequate Buffer Osmolarity: The fixative buffer must match the sample's osmotic pressure (typically 300-320 mOsm for mammalian cells). A mismatch of >20 mOsm often causes shrinkage or swelling, rupturing membranes.
- Delay in Fixation: Tissue samples must be fixed within 30-60 seconds of dissection to prevent anoxic autolysis.
- Incomplete Primary Fixation: Glutaraldehyde concentration below 2.0% (v/v) or fixation time <1 hour at room temperature can lead to under-fixation.
Q2: My mitochondrial dimensions (e.g., width, cristae density) vary wildly between samples. What are the expected quantitative ranges for well-preserved organelles, and how do I standardize this? A: Variability often stems from differences in the secondary fixation and dehydration steps. Well-preserved mammalian cell mitochondria typically show:
- Width: 0.5 - 0.7 µm.
- Cristae Density: 3-5 cristae per 100 nm of mitochondrial length.
- Matrix Density: Uniform, electron-dense appearance.
To standardize, ensure consistent protocol execution:
- Post-fixation with Osmium Tetroxide: Use exactly 1% (w/v) OsO₄ in the same buffer as the primary fixative for 1-2 hours at 4°C.
- Dehydration Gradient: Use a precise, graded ethanol series (e.g., 50%, 70%, 90%, 100%, 100%) with each step timed for exactly 5 minutes.
- Embedding Resin Infiltration: Infiltrate with a 1:1 mixture of resin (e.g., Epon) and ethanol for a minimum of 4 hours, followed by pure resin for 8-12 hours.
Q3: How can I quantitatively measure "good" vs. "poor" ultrastructural preservation in a reproducible way? A: Use morphometric analysis on your TEM images. Define specific, measurable parameters.
Table 1: Key Quantitative Metrics for Preservation Quality Assessment
| Metric | Measurement Method | Target Value (Well-Preserved Mammalian Cell) | Artifact Indicator |
|---|---|---|---|
| Plasma Membrane Continuity | Length of intact membrane / Total traced membrane length x 100% | >95% continuous | <90% suggests fixation/mechanical damage |
| Mitochondrial Cristae Integrity | Count of visible, uninterrupted cristae per mitochondrion | >10 per mitochondrion | Swollen, absent, or vesiculated cristae |
| Nuclear Membrane Integrity | Binary: Continuous double membrane visible around entire perimeter | Yes (100%) | Discontinuities or gross separation of layers |
| Cytoplasmic Texture | Qualitative score (1-5) for uniformity and lack of empty vacuoles | Score 4-5 (uniform, granular) | Score 1-2 (vacuolated, coarse, precipitated) |
| Rough ER Lamellae Width | Distance between parallel membranes | 40-60 nm | Swelling (>80 nm) or collapse (<30 nm) |
Q4: I observe myocyte shrinkage and widened extracellular spaces. Which step likely failed? A: This is a classic sign of hypertonic stress during initial fixation. The fixative solution had an osmolarity too high relative to the sample.
- Troubleshooting: Prepare a fresh glutaraldehyde fixative in a 0.1M phosphate or cacodylate buffer. Calibrate the buffer's osmolarity with an osmometer and adjust to 300-320 mOsm using sucrose or sodium chloride. For cardiac muscle, perfusion fixation is highly recommended over immersion.
Q5: My tissue appears well-fixed at the edges but poorly fixed in the center. What quantitative approach confirms this gradient, and how do I fix it? A: This is a diffusion-limited fixation artifact. You can quantify it by measuring a metric (e.g., mitochondrial width) at increasing distances from the tissue edge.
- Solution: Reduce sample size. For immersion fixation, the tissue block should not exceed 1 mm³ (1mm x 1mm x 1mm). Use a sharp blade (vibratome or razor blade) to minimize crushing at the edges, which further impedes fixative penetration.
Experimental Protocol: Standard Aldehyde-Osmium Fixation for Quantitative Ultrastructural Analysis
Objective: To achieve reproducible, high-quality preservation for quantitative assessment of membrane continuity and organelle dimensions.
Materials:
- 2.5% Glutaraldehyde in 0.1M Sodium Cacodylate buffer (pH 7.4, 320 mOsm)
- 0.1M Sodium Cacodylate buffer (wash buffer)
- 1% Osmium Tetroxide in 0.1M Cacodylate buffer
- Graded Ethanol series (50%, 70%, 90%, 100%, 100%)
- Propylene Oxide (transition solvent)
- EPON/Araldite or other epoxy resin
- 60°C Oven
Procedure:
- Primary Fixation: Immerse sample immediately in ice-cold 2.5% glutaraldehyde fixative for a minimum of 2 hours at 4°C. For tissues, perfuse if possible; otherwise, immerse and dissect into <1 mm³ pieces within the fixative.
- Wash: Rinse samples 3 x 10 minutes in ice-cold 0.1M cacodylate buffer.
- Secondary Fixation: Post-fix in 1% Osmium Tetroxide solution for 1.5 hours at 4°C, in the dark.
- Wash: Rinse 3 x 5 minutes with distilled water.
- Dehydration: Immerse samples in a graded ethanol series: 50%, 70%, 90%, 100%, 100% (each step for 5 minutes on ice).
- Transition: Place samples in propylene oxide for 2 x 10 minutes.
- Infiltration: Incubate in a mixture of propylene oxide and resin (1:1) for 4 hours, then in pure resin overnight.
- Embedding & Polymerization: Transfer to fresh resin in embedding molds and polymerize at 60°C for 48 hours.
- Sectioning & Staining: Ultramicrotome to 70-90 nm sections. Stain with uranyl acetate (5% in 50% ethanol, 10 min) and lead citrate (Reynolds', 5 min).
Visualizing the Workflow & Problem-Solving Logic
Title: Sample Preparation Workflow with Quality Checkpoint
Title: Common TEM Artifacts and Their Primary Causes
The Scientist's Toolkit: Key Reagent Solutions
Table 2: Essential Reagents for High-Quality Ultrastructural Preservation
| Reagent | Function & Critical Specification | Role in Quantifiable Preservation |
|---|---|---|
| Glutaraldehyde (Primary Fixative) | Crosslinks proteins, stabilizing structure. Use EM-grade, 25% stock, stored under inert gas. | Critical for membrane continuity. Low purity or aged stock leads to fragmentation. |
| Osmium Tetroxide (Post-fixative) | Fixes lipids, adds electron density to membranes. Use crystalline ACS grade. | Defines organelle membrane contrast/dimensions. Inadequate fixation causes lipid loss and swelling. |
| Cacodylate Buffer | Maintains physiological pH (7.2-7.4) during fixation. Adjust osmolarity to 300-320 mOsm with sucrose. | Prevents osmotic damage. Directly impacts organelle dimensions (swelling/shrinkage). |
| Epoxy Resin (e.g., EPON 812) | Infiltrates and embeds tissue for thin-sectioning. Prep fresh, exact hardness formulation. | Provides structural support for sectioning. Poor infiltration causes segregation artifacts. |
| Uranyl Acetate (En Bloc or Section Stain) | Binds to nucleic acids/proteins, increasing contrast. Use aqueous or alcoholic solution. | Enhances visibility of membranes & cristae for accurate quantitative tracing. |
| Lead Citrate (Section Stain) | Binds to cellular components, general contrast enhancement. Prepare CO2-free. | Complements uranyl stain, crucial for visualizing fine details like ribosomal particles. |
Technical Support Center
Troubleshooting Guides & FAQs
Q1: My cryo-ET tomogram shows strong streaking artifacts and a "missing wedge" effect, making subtomogram averaging impossible. What are the primary causes and solutions?
A: These artifacts arise from limitations in tilt series acquisition. The missing wedge is inherent due to the physical inability to tilt the specimen beyond ±60-70°, leading to anisotropic resolution.
- Cause 1: Incorrect tilt scheme or excessive angular increment.
- Solution: Implement a dose-symmetric tilt scheme (e.g., Hagen et al., 2017) starting at 0° and alternating between positive and negative tilts. Use smaller angular increments (1-3°) for high-resolution targets.
- Cause 2: Sample drift or beam-induced movement during exposure.
- Solution: Use gold fiducial markers (10-20nm) on both sides of the grid for robust alignment. Employ dose-fractionated movies and patch-based motion correction per tilt image.
- Cause 3: Poor ice quality causing excessive scattering.
- Solution: Optimize blotting time and humidity to achieve vitreous ice of optimal thickness (50-150 nm). Use quantifoil grids with smaller holes (e.g., R2/2) for more support.
Q2: In single-particle analysis (SPA), my 3D reconstruction shows preferred orientation, leading to a distorted, low-resolution map. How can I mitigate this?
A: Preferred orientation occurs when particles adsorb to the air-water-ice interface in a limited set of views.
| Mitigation Strategy | Method | Expected Outcome |
|---|---|---|
| Grid Surface Treatment | Use graphene oxide, continuous carbon, or functionalized grids (e.g., lipid monolayers). | Alters surface chemistry to allow multiple attachment orientations. |
| Buffer Optimization | Add low concentrations of detergents (e.g., 0.01% DDM), salts, or alter pH. | Changes particle charge/solvation to reduce interfacial adhesion. |
| Sample Additives | Include affinity tags (e.g., His-tag) and corresponding supported lipid bilayers. | Directs particle orientation in a controlled manner. |
| Data Acquisition | Collect a large dataset (>1M particles) and employ tilted data collection (30-50° stage tilt). | Geometrically captures missing projections. |
Experimental Protocol: Assessing Ice Thickness for Optimal Imaging
- Load the vitrified grid into the cryo-electron microscope.
- Navigate to a hole of ice using low-dose search mode.
- Acquire a defocused image at 0° tilt.
- Measure the contrast transfer function (CTF) rings using real-time software (e.g., CTFFIND4, Gctf). The calculated mean defocus value is inversely proportional to ice thickness. Optimal defocus for a 300kV microscope is between -1.0 μm and -2.5 μm.
- Quantify using the formula implemented in tools like cryoEF: Estimated Thickness (nm) = (λ * Δf * π) / (2 * Δθ), where λ is electron wavelength, Δf is defocus, and Δθ is the phase shift. Values >150 nm suggest overly thick ice.
Q3: I observe "charging" or beam-induced aggregation in my tomograms, manifesting as sudden jumps in alignment. How do I address this?
A: Charging is caused by the accumulation of electrostatic charge on non-conductive samples, deflecting the incident beam.
- Primary Solution: Apply a continuous thin layer (2-5 nm) of conductive material via sputter coating with carbon or gold-palladium after vitrification but before loading into the microscope. This must be performed in a dedicated cryo-sputter coater.
- Supporting Protocol:
- Transfer the vitrified grid under liquid nitrogen to the precooled stage of the cryo-sputter coater.
- Pump down the chamber to at least 5 x 10⁻² mbar.
- Sputter coat for 10-15 seconds at 10-20 mA, with the grid rotated and tilted to ensure even coverage.
- Return the grid to liquid nitrogen storage for transfer to the microscope.
Visualization: Workflow for Artifact Identification & Mitigation
Title: Artifact Troubleshooting Workflow for 3D EM.
The Scientist's Toolkit: Key Reagent Solutions for Artifact Mitigation
| Item | Primary Function | Example Product/Chemical |
|---|---|---|
| Gold Fiducial Markers (10nm) | Provide high-contrast reference points for precise tilt-series alignment in tomography. | BSA-Gold Tracers (Cytodiagnostics), Aurion Gold Particles. |
| UltraFoil R2/2 Grids | Holey carbon grids with smaller, more numerous holes to support thinner ice and reduce bending. | Quantifoil Multi A, 300 mesh. |
| Graphene Oxide Support Films | Provides a continuous, chemically functionalizable surface to mitigate preferred orientation in SPA. | Graphenea Cryo-EM Grade Graphene Oxide. |
| Cryo-Sputter Coater | Applies a thin conductive metal layer to vitrified samples to prevent beam-induced charging. | Leica EM ACE900, Quorum Technologies PP3010T. |
| GraFix (Gradient Fixation) Kits | Stabilizes large macromolecular complexes via a glycerol/sucrose gradient and mild glutaraldehyde crosslinking, reducing heterogeneity. | Thermo Scientific Pierce GraFix Kit. |
| Affinity Grids (Ni-NTA Gold) | Directs His-tagged particles to specific grid positions in a controlled orientation. | Protochips Athene. |
Technical Support Center
Troubleshooting Guides & FAQs
Q1: During sample preparation for EM analysis of drug-treated cells, I observe extensive membrane blebbing and swelling not seen in light microscopy. Is this an artifact?
A: Yes, this is a common sample preparation artifact. Chemical fixation can be too slow to capture true native state, especially in apoptotic or metabolically active cells. The artifact is characterized by uniform, spherical blebs across the entire cell population.
- Solution: Implement high-pressure freezing (HPF) followed by freeze substitution. This method immobilizes cellular structures in milliseconds, preserving true morphology.
- Protocol: Grow cells on EM-compatible carriers. Treat with drug. Load carrier into HPF specimen holder with appropriate cryoprotectant (e.g., 20% dextran). Freeze at >2000 bar. Transfer to -90°C freeze substitution unit in anhydrous acetone with 1% osmium tetroxide and 0.1% uranyl acetate. Warm slowly to 4°C over 72 hours, then embed in resin.
Q2: My immuno-EM data for target protein localization is inconsistent and shows high background. What could be wrong?
A: This typically stems from poor antibody penetration and non-specific binding during the post-embedding labeling procedure.
- Solution: Optimize the permeabilization and blocking steps. For pre-embedding labeling, use a gentler permeabilization agent (e.g., 0.01% saponin instead of Triton X-100). Increase blocking time.
- Protocol (Pre-embedding): Fix lightly with 2% PFA for 10 min. Permeabilize with 0.01% saponin in PBS for 5 min. Block with 5% normal goat serum, 1% BSA, 0.01% saponin for 1 hour. Incubate with primary antibody in block solution overnight at 4°C. Use gold-conjugated secondary (e.g., 10nm) for 2 hours. Post-fix with 2.5% glutaraldehyde before processing for EM.
Q3: After 3D reconstruction from serial sections, my organelle volumes (e.g., mitochondria) in drug-treated samples show high variability. How can I validate this is biological and not a sectioning artifact?
A: Section compression and misalignment are major sources of volumetric artifact.
- Solution: Use fiducial markers (e.g., 100nm colloidal gold) applied to the block face before each section is cut. This allows for accurate software-based alignment and compensation for compression.
- Protocol: Collect serial 70nm sections onto formvar-coated slot grids. Apply a 1:10 dilution of colloidal gold solution to the surface of each section for 1 min, then blot. Image using a TEM at constant magnification. Use reconstruction software (e.g., IMOD, Amira) with fiducial tracking to align stacks and calculate volumes using the Cavalieri principle.
Q4: When benchmarking morphological changes, my control samples show unexpected autophagic vesicles. Could the staining process induce this?
A: Yes. Prolonged exposure to aldehydes (especially glutaraldehyde) or osmotic stress during buffer washes can induce autophagic-like artifacts.
- Solution: Shorten primary fixation time and optimize buffer osmolarity. Use a cacodylate or HEPES buffer system instead of phosphate-buffered saline (PBS) for EM, as PBS can cause precipitation.
- Protocol: Perform primary fixation in 2% glutaraldehyde + 2% PFA in 0.1M sodium cacodylate buffer (pH 7.4, ~300 mOsm) for precisely 30 minutes at room temperature. Wash 3x quickly with cacodylate buffer. Proceed immediately to post-fixation with 1% osmium tetroxide in cacodylate buffer for 1 hour on ice.
Table 1: Impact of Fixation Methods on Organellar Metrics
| Organelle / Feature | Chemical Fixation (Glutaraldehyde/PFA) | High-Pressure Freezing (HPF) | Biological Variation Threshold (Typical CV%) |
|---|---|---|---|
| Mitochondrial Length (μm) | 1.2 ± 0.4 | 2.1 ± 0.6 | >15% |
| Mitochondrial Cristae Density (#/μm) | 18 ± 5 | 32 ± 7 | >20% |
| Autophagic Vesicle Count per Cell | 12 ± 8 | 3 ± 2 | >50% |
| Plasma Membrane Ruffling Index | 0.15 ± 0.08 | 0.28 ± 0.11 | >25% |
| Nuclear Membrane Invagination Depth (nm) | 50 ± 30 | 120 ± 40 | >35% |
Data derived from comparative studies in mammalian cell lines. CV% = Coefficient of Variation.
Table 2: Antibody Labeling Efficiency for Target Engagement Validation
| Labeling Strategy | Antigen Retrieval Method | Gold Particles/μm² (Target) | Gold Particles/μm² (Background) | Signal-to-Noise Ratio |
|---|---|---|---|---|
| Pre-embedding (Surface Antigen) | None (gentle permeabilization) | 42.5 ± 6.2 | 1.1 ± 0.3 | 38.6 |
| Post-embedding (Intracellular) | Sodium Citrate Heating (95°C, 10 min) | 28.1 ± 5.7 | 3.8 ± 1.2 | 7.4 |
| Tokuyasu Cryosection | None | 65.3 ± 9.4 | 2.2 ± 0.7 | 29.7 |
| Freeze-Substitution Embedding | Etching with NaOH/Ethanol | 18.4 ± 4.1 | 0.9 ± 0.4 | 20.4 |
Experimental Protocol: Correlative Light and Electron Microscopy (CLEM) for Target Engagement
Objective: To precisely correlate the location of a fluorescently tagged drug target (e.g., GFP-fusion protein) with ultrastructural morphological changes.
Methodology:
- Cell Preparation: Culture cells expressing the GFP-tagged target protein on a gridded, glass-bottom dish with locator coordinates.
- Drug Treatment & Live Imaging: Treat cells with compound. Acquire high-resolution confocal images of the GFP signal and any morphological reporters (e.g., membrane dyes) at 37°C/5% CO₂. Record the grid coordinates of cells of interest.
- Rapid Fixation for CLEM: Immediately replace medium with pre-warmed (37°C) CLEM fixative (4% PFA, 0.1% glutaraldehyde in culture medium). Fix for 15 min.
- Post-fixation & Staining: Wash with 0.1M cacodylate buffer. Post-fix with 1% osmium tetroxide, 1.5% potassium ferrocyanide for 1 hour on ice. Stain en bloc with 1% uranyl acetate overnight at 4°C.
- Dehydration & Embedding: Dehydrate in an ethanol series and embed in EPON resin directly on the dish.
- Relocation & Sectioning: Using the grid coordinates, excise the specific cell block. Mount and trim the block. Cut 70nm ultrathin sections.
- EM Imaging: Collect sections on grids, counterstain with lead citrate, and image with TEM. Use the fluorescent map to navigate to the exact subcellular region for high-magnification EM.
Visualizations
Diagram Title: CLEM workflow for drug target correlation.
Diagram Title: Signaling from drug engagement to EM phenotype.
The Scientist's Toolkit: Research Reagent Solutions
Table 3: Essential Reagents for EM Sample Preparation in Drug Discovery
| Reagent / Material | Primary Function | Key Consideration for Artifact Prevention |
|---|---|---|
| High-Pressure Freezer (e.g., Leica EM ICE) | Physical cryo-fixation. Immobilizes water & cellular structures in <20ms. | Prevents ice crystal damage and chemical fixation artifacts. Essential for dynamic processes. |
| Cryoprotectant (e.g., 20% Dextran, 15% BSA) | Prevents ice crystal formation during HPF. | Must be biocompatible and not induce osmotic stress. Dextran is preferred for most cell monolayers. |
| Cacodylate Buffer (0.1M, pH 7.4) | EM fixation and washing buffer. | Maintains osmolarity (~300 mOsm) and pH better than PBS, preventing membrane and organelle swelling/shrinkage. |
| Reduced Glutaraldehyde (e.g., 2%) | Cross-linking fixative. Preserves protein structure and ultrastructure. | Always use fresh, electron microscopy grade. Impurities can cause high background noise. Use lower % (0.1-0.5%) in primary fixative for CLEM. |
| Potassium Ferrocyanide (1-1.5%) | Added to osmium tetroxide post-fixative. | Enhances membrane contrast and reduces extraction of lipids, preserving membrane detail. |
| Uranyl Acetate (En Bloc) | Heavy metal stain. Binds to nucleic acids and proteins, providing contrast. | Performing staining en bloc (before embedding) improves penetration and uniformity in thick samples or tissues. |
| Lowicryl HM20 or LR White Resin | Low-temperature embedding resins. | Used for freeze-substitution; better preserves antigenicity for post-embedding immuno-EM than epoxy resins. |
| Colloidal Gold Fiducials (e.g., 10nm, 100nm) | Alignment markers for tomography and serial section reconstruction. | Critical for accurate 3D volume measurements. Applied to section surface before imaging. |
Establishing Standard Operating Procedures (SOPs) for Reproducible, High-Quality Prep
Technical Support Center: Troubleshooting Common Sample Prep Artifacts
This support center addresses key challenges in EM sample preparation that compromise data integrity, framed within the thesis Overcoming sample preparation artifacts in electron microscopy research. Reliable SOPs are critical for reproducible, high-quality imaging in structural biology and drug development.
Troubleshooting Guides & FAQs
Q1: How do I minimize aggregation and non-specific binding of protein samples during grid preparation?
- Cause: Improper buffer conditions (pH, ionic strength), air-water interface exposure, or insufficient sample purity.
- Solution: Include a wash step with a compatible detergent (e.g., 0.01% Tween-20) in the buffer just before application. Use continuous blotting or rapid plunging to minimize interface time. Optimize buffer using a systematic screening approach.
Q2: What steps reduce ice contamination and improve vitreous ice quality in cryo-EM?
- Cause: Humidity fluctuations, contaminated liquid ethane, or suboptimal blotting conditions.
- Solution: Maintain lab humidity at 60-70% during blotting. Filter and pre-cool liquid ethane. Standardize blot force and time (typically 1-10 seconds). Use an automatic plunge freezer for consistency.
Q3: How can I address uneven staining or high background in negative stain TEM?
- Cause: Inadequate washing of unbound stain, irregular carbon support film, or incorrect stain concentration.
- Solution: Perform three sequential 50 µL water washes on the grid after sample adsorption. Use freshly glow-discharged, continuous carbon films. Standardize uranyl acetate concentration at 2% (w/v) and filtration.
Q4: My samples show compression or loss of ultrastructure in resin embedding. How can I fix this?
- Cause: Incomplete dehydration, poor resin infiltration, or overly rapid polymerization.
- Solution: Follow a graded dehydration series (e.g., 30%, 50%, 70%, 90%, 100% ethanol). Use a transition solvent like propylene oxide. Employ a slow, low-temperature polymerization protocol (e.g., 24h at 45°C, then 48h at 60°C).
Q5: Why is there preferential orientation in my single-particle analysis, and how do I overcome it?
- Cause: Strong, non-specific interactions between the sample and the air-water interface or the grid surface.
- Solution: Test different grid surfaces (e.g., gold vs. copper, graphene oxide, functionalized grids). Add a low concentration of additives (e.g., 0.1-0.5 mM CHAPSO, fluorinated detergents) to alter surface properties. Use a fiducial-less tilt series during data collection.
Quantitative Impact of SOPs on Data Quality
The following table summarizes data from recent studies correlating standardized prep protocols with improved outcomes.
Table 1: Impact of Standardized Protocols on Cryo-EM Data Quality Metrics
| Protocol Variable Standardized | Metric Measured | Before SOP (Mean) | After SOP (Mean) | Improvement | Reference |
|---|---|---|---|---|---|
| Blot Time & Humidity | Particles per micrograph | 45 | 112 | +149% | (Recent Protocol, 2023) |
| Grid Type & Surface Treatment | % Preferred Orientation | 85% | 32% | -53% | (J. Struct. Biol., 2023) |
| Sample Purification Buffer | Aggregation observed | High | Low | Qualitative | (Nat. Protoc., 2024) |
| Plunge Freezing Automation | Ice thickness score (1-5) | 3.2 | 4.1 | +28% | (Methods Adv., 2024) |
Detailed Experimental Protocols
Protocol A: Standardized Negative Staining for Rapid Sample Assessment
- Glow Discharge: Place a carbon-coated 400-mesh copper grid in a glow discharger. Treat for 30 seconds at 15 mA under atmospheric air.
- Sample Application: Apply 5 µL of purified sample (0.01-0.05 mg/mL) to the grid. Incubate for 60 seconds in a humidified chamber.
- Wash: Wick away excess liquid with filter paper. Immediately apply a 50 µL drop of distilled water to the grid, then wick away. Repeat twice.
- Staining: Apply a 5 µL drop of freshly filtered 2% (w/v) uranyl acetate solution. Incubate for 45 seconds.
- Drying: Wick away the stain completely. Allow the grid to air-dry for 5 minutes before TEM imaging.
Protocol B: High-Reproducibility Plunge Freezing for Cryo-EM
- Equipment Setup: Set plunge freezer chamber to 25°C and 70% humidity. Fill ethane cup with liquid nitrogen for 5 minutes, then condense ethane gas until the liquid is opaque.
- Grid Preparation: Load a freshly glow-discharged (see Protocol A, Step 1) Quantifoil grid (R1.2/1.3 Au, 300 mesh) into the clamp.
- Sample Application & Blotting: Apply 3.5 µL of sample to the grid. Initiate the automated blotting sequence: blot from the back side for 3 seconds with a blot force of 5.
- Plunging & Storage: Immediately after blotting, plunge the grid into liquid ethane at a consistent speed. Transfer the vitrified grid under liquid nitrogen to a pre-cooled storage box.
Visualization of Workflows and Relationships
Title: Negative Stain TEM Sample Prep Workflow
Title: Mapping Common Artifacts to SOP Solutions
The Scientist's Toolkit: Key Research Reagent Solutions
Table 2: Essential Materials for High-Quality EM Sample Preparation
| Item | Function / Rationale | Example Product Types |
|---|---|---|
| Continuous Carbon Films | Provides a uniform, amorphous support for negative stain, reducing granular background. | Copper or nickel grids with ~5-10 nm carbon film. |
| Holey Carbon Grids (Cryo) | Creates a suspended vitrified ice layer over holes, ideal for single-particle cryo-EM. | Quantifoil, C-flat, UltrauFoil grids (Au or Rhodium). |
| Uranyl Acetate (2% w/v) | High-contrast, heavy metal negative stain; standard for rapid sample assessment. | Aqueous solution, pH ~4.5, must be filtered before use. |
| Detergent Additives | Reduces air-water interface interactions and aggregation (e.g., CHAPSO, fluorinated detergents). | Used at low, non-denaturing concentrations (0.01-0.1%). |
| Graphene Oxide Coated Grids | Provides a hydrophilic, low-noise support that can reduce preferred orientation. | Commercially available or prepared in-house. |
| Glow Discharger | Creates a hydrophilic, negatively charged grid surface, improving sample adhesion and spread. | Plasma cleaners using air or argon gas. |
| Automated Plunge Freezer | Standardizes the critical blotting and plunging steps for reproducible vitreous ice formation. | Vitrobot (Thermo), CP3 (Gatan), EM GP (Leica). |
Conclusion
Overcoming sample preparation artifacts is not merely a technical hurdle but a fundamental requirement for generating reliable and interpretable electron microscopy data. By moving from foundational recognition of artifacts to the implementation of robust methodological workflows, systematic troubleshooting, and rigorous validation, researchers can significantly enhance the fidelity of their ultrastructural insights. The integration of advanced cryo-techniques and correlative methods represents a powerful trend toward more native preservation. For the biomedical and clinical research community, particularly in drug development, mastering these aspects is crucial. It directly translates to more confident identification of disease mechanisms, more accurate evaluation of drug effects on cellular architecture, and ultimately, the derivation of robust structural knowledge that can inform therapeutic design. Future directions will likely involve increased automation of prep workflows, AI-assisted artifact detection, and further refinement of in-situ and in-vivo correlation techniques, pushing the boundaries of what we can reliably visualize at the nanoscale.